| Param | Original file | Final file |
|---|---|---|
| Filename | modeM0/AS1A10_002T05_9000004024_27877cztM0_level2.evt | modeM0/AS1A10_002T05_9000004024_27877cztM0_level2_quad_clean.evt |
| Size (bytes) | 223,709,760 | 52,372,800 |
| Size | 213.3 MB | 49.9 MB |
| Events in quadrant A | 1,506,961 | 363,155 |
| Events in quadrant B | 1,790,932 | 353,112 |
| Events in quadrant C | 1,719,350 | 331,120 |
| Events in quadrant D | 1,562,133 | 334,493 |
| Mode M0 | |||
|---|---|---|---|
| Quadrant | BADHDUFLAG | Total packets | Discarded packets |
| A | 0 | 6188 | 0 |
| B | 0 | 7154 | 0 |
| C | 0 | 6906 | 0 |
| D | 0 | 6304 | 0 |
| Quadrant | Total seconds | Saturated seconds | Saturation percentage |
|---|---|---|---|
| A | 2850 | 0 | 0.000000% |
| B | 2851 | 56 | 1.964223% |
| C | 2851 | 24 | 0.841810% |
| D | 2851 | 12 | 0.420905% |
Noise dominated data is calculated using 1-second bins in cleaned event files. If a bin has >2000 counts, and if more than 50% of those come from <1% of pixels, then it is considered to be noise-dominated and hence unusable.
| Quadrant | # 1 sec bins | Bins with >0 counts | Bins with >2000 counts | High rate bins dominated by noise | Noise dominated (total time) | Noise dominated (detector-on time) | Marked lightcurve |
|---|---|---|---|---|---|---|---|
| A | 2850 | 2850 | 0 | 0 | 0.00% | 0.00% |  |
| B | 2851 | 2851 | 50 | 50 | 1.75% | 1.75% |  |
| C | 2851 | 2851 | 4 | 4 | 0.14% | 0.14% |  |
| D | 2851 | 2851 | 13 | 13 | 0.46% | 0.46% |  |
Top three noisy pixels from each quadrant. If the there are fewer than three noisy pixels in the level2.evt file, extra rows are filled as -1
| Pixel properties | Quadrant properties | ||||||
|---|---|---|---|---|---|---|---|
| Quadrant | DetID | PixID | Counts | Sigma | Mean | Median | Sigma |
| A | 6 | 16 | 7734 | 94.83 | 388 | 383 | 77.5 |
| A | 13 | 254 | 5265 | 62.98 | 388 | 383 | 77.5 |
| A | 0 | 226 | 3401 | 38.93 | 388 | 383 | 77.5 |
| B | 5 | 172 | 161214 | 2250.72 | 373 | 364 | 71.5 |
| B | 4 | 52 | 85670 | 1193.66 | 373 | 364 | 71.5 |
| B | 10 | 245 | 55211 | 767.46 | 373 | 364 | 71.5 |
| C | 3 | 233 | 242657 | 2915.83 | 355 | 359 | 83.1 |
| C | 14 | 238 | 58543 | 700.19 | 355 | 359 | 83.1 |
| C | 15 | 208 | 26481 | 314.35 | 355 | 359 | 83.1 |
| D | 1 | 52 | 92642 | 1050.26 | 371 | 363 | 87.9 |
| D | 2 | 250 | 41678 | 470.22 | 371 | 363 | 87.9 |
| D | 12 | 0 | 11934 | 131.69 | 371 | 363 | 87.9 |
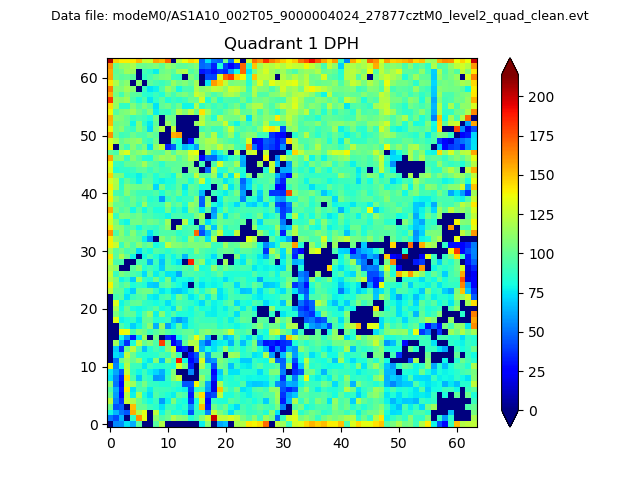
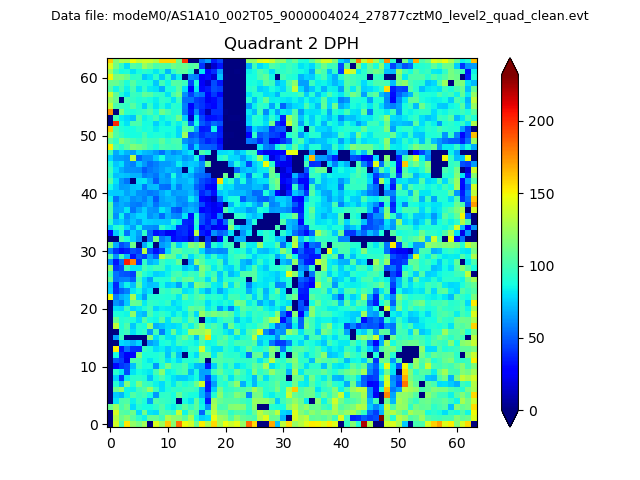
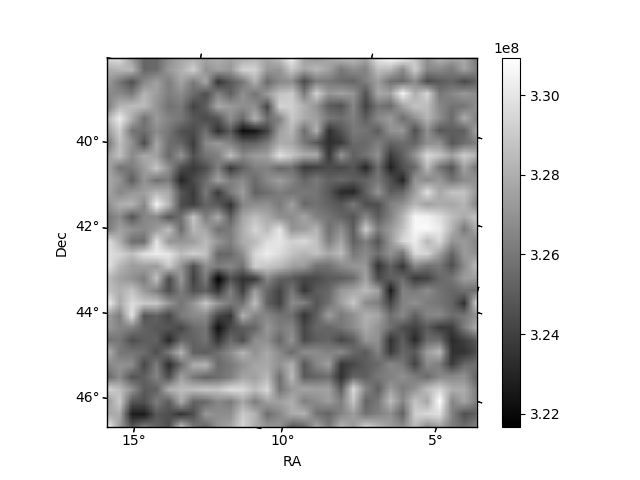
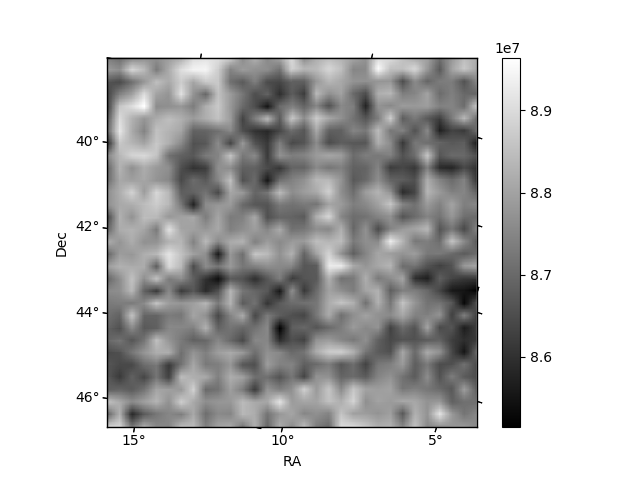
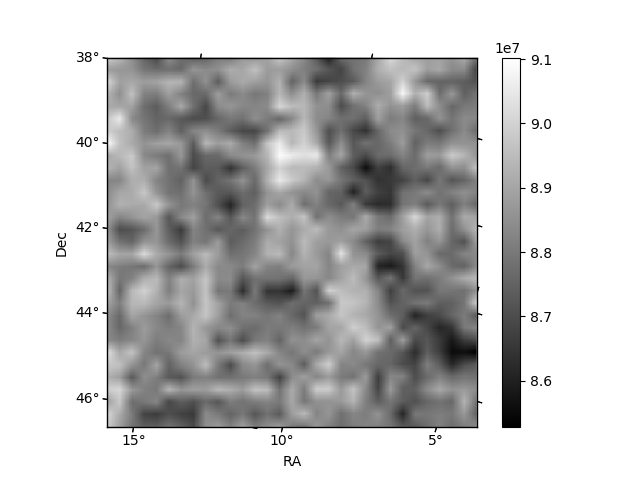
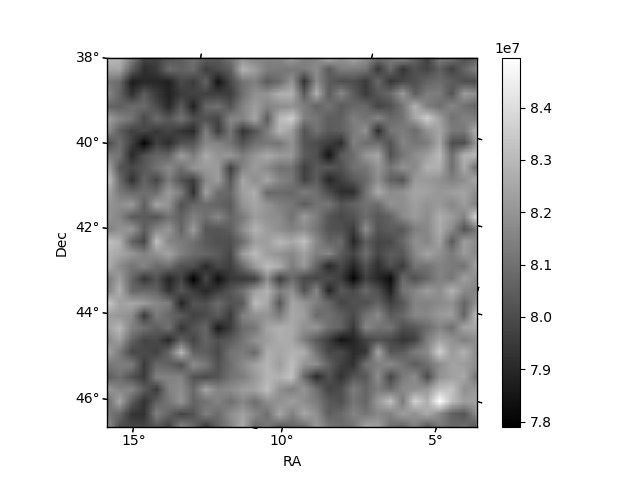
Histogram calculated using DETX and DETY for each event in the final _common_clean file
| Quadrant A | 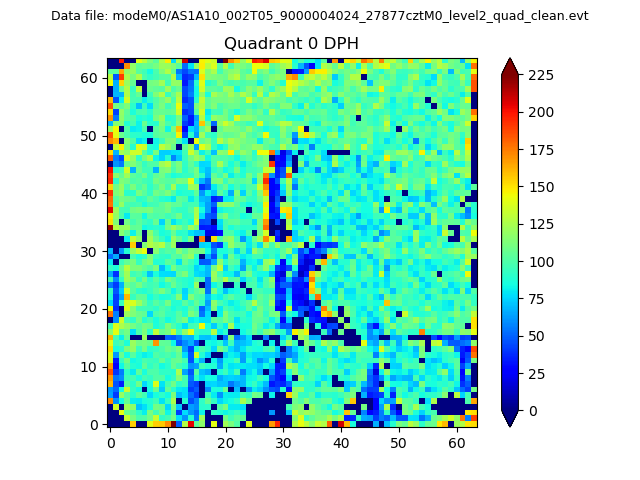 |
 |
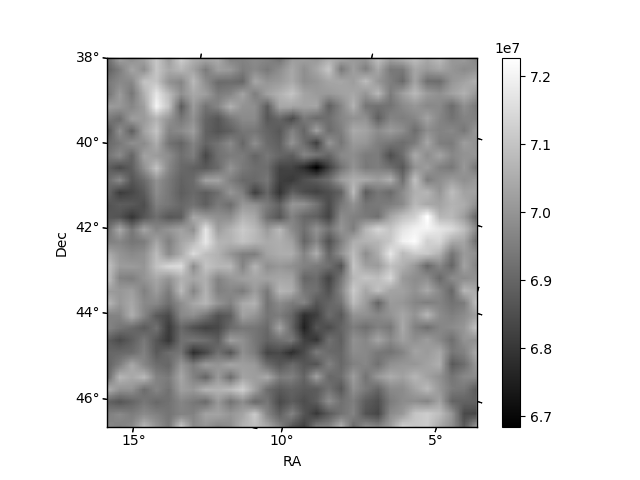
Quadrant B |
|---|---|---|---|
| Quadrant D | 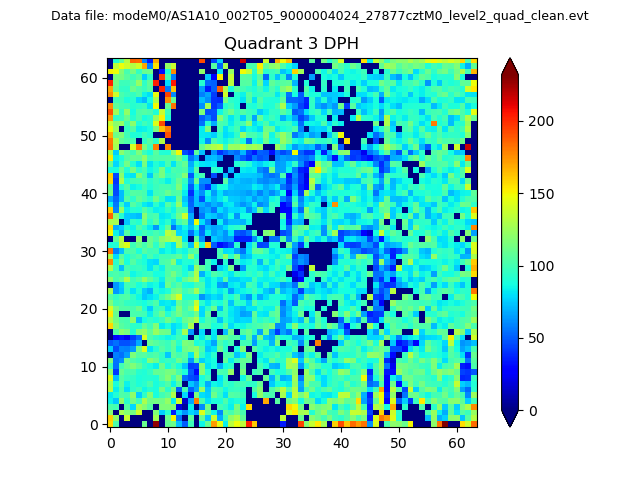 |
 |
Quadrant C |
| Plot type | Count rate plots | Images |
|---|---|---|
| Comparison with Poisson distribution Blue bars denote a histogram of data divided into 1 sec bins. Red curve is a Poisson curve with rate = median count rate of data. |
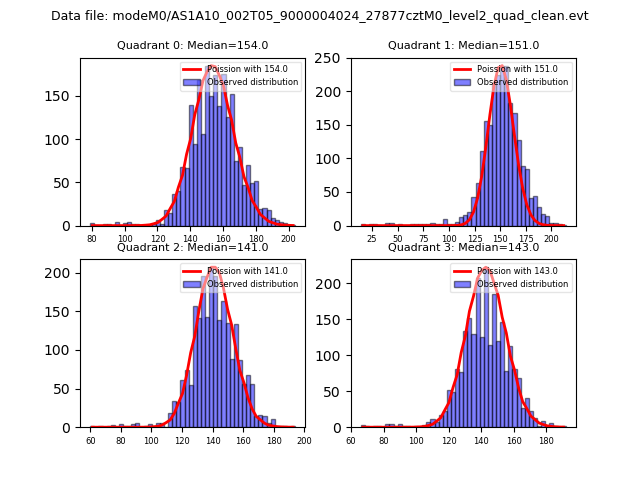 |
 |
| Quadrant-wise count rates Data is divided into 100 sec bins |
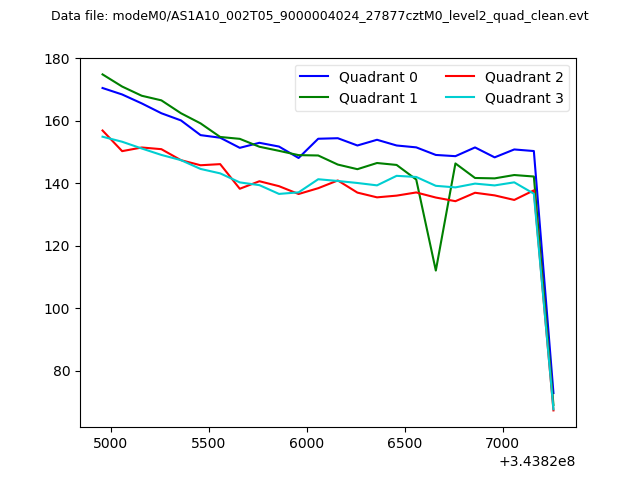 |
|
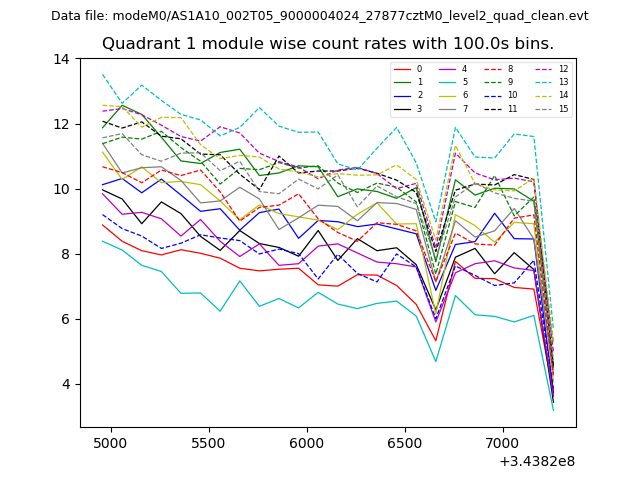
| Module-wise count rates for Quadrant A Data is divided into 100 sec bins |
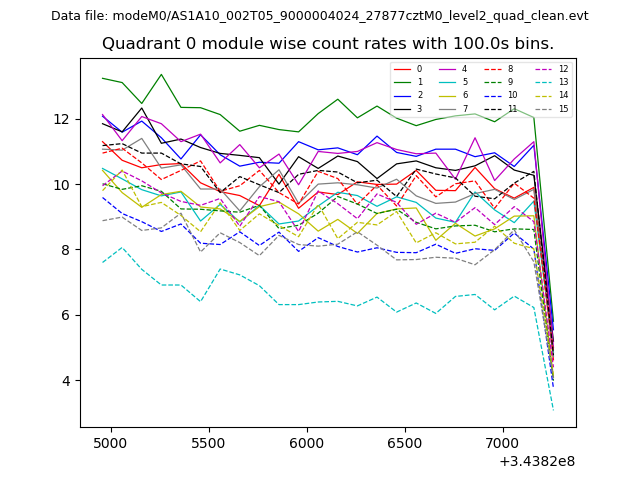 |
 |
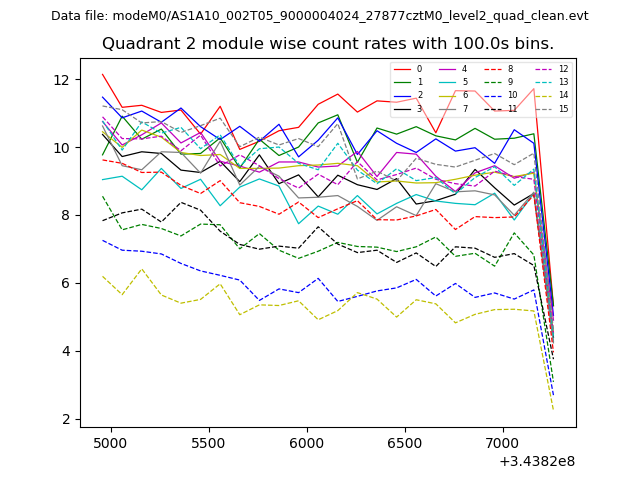
| Module-wise count rates for Quadrant B Data is divided into 100 sec bins |
 |
 |
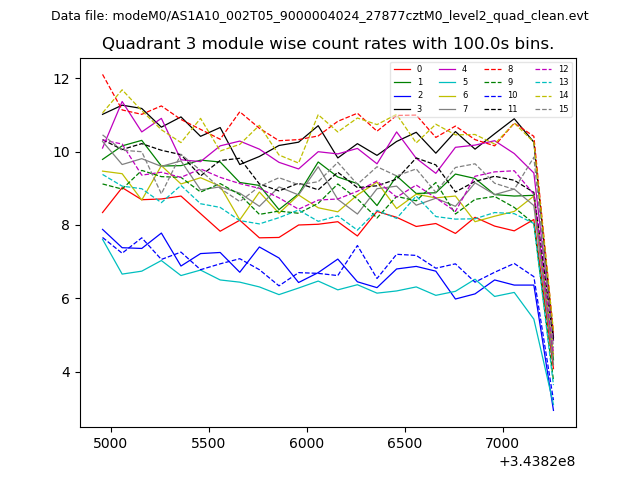
| Module-wise count rates for Quadrant C Data is divided into 100 sec bins |
 |
 |
| Module-wise count rates for Quadrant D Data is divided into 100 sec bins |
 |
 |
| Parameter | Plot |
|---|---|
| CZT HV Monitor | 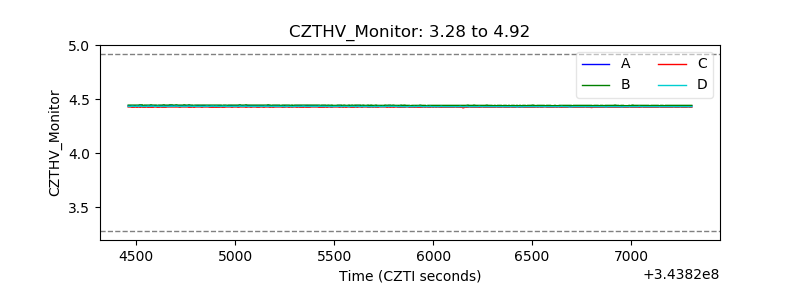 |
| D_VDD | 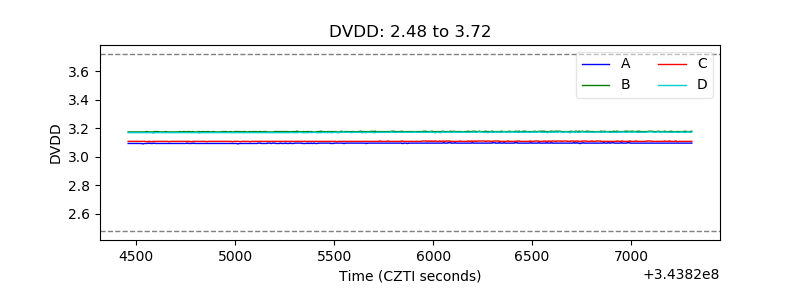 |
| Temperature 1 | 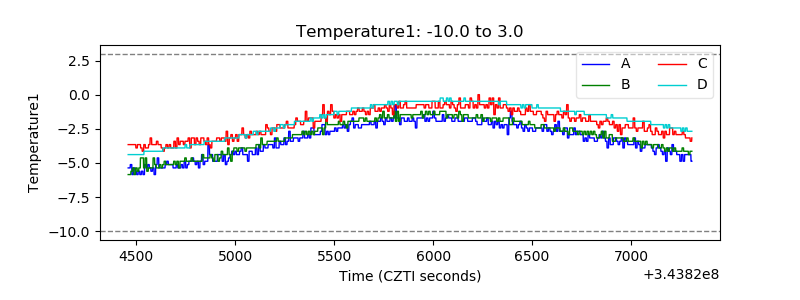 |
| Veto HV Monitor | 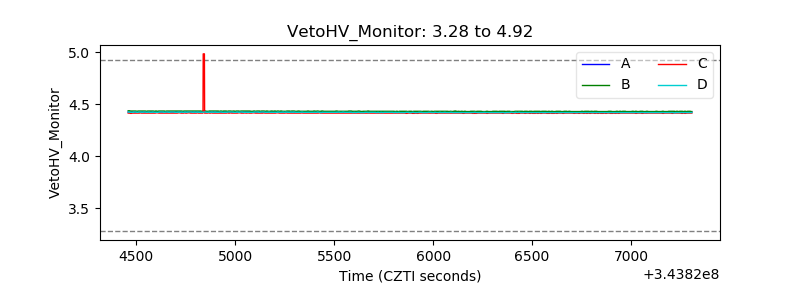 |
| Veto LLD | 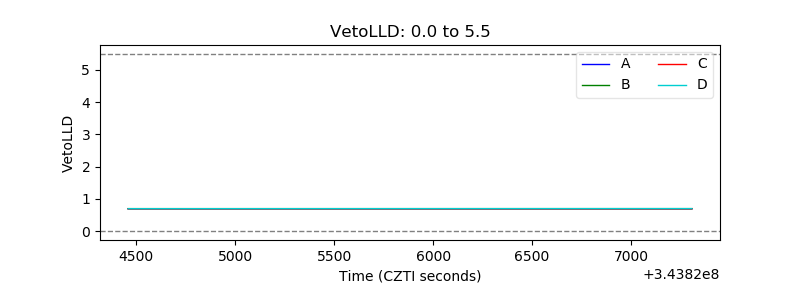 |
| Alpha Counter | 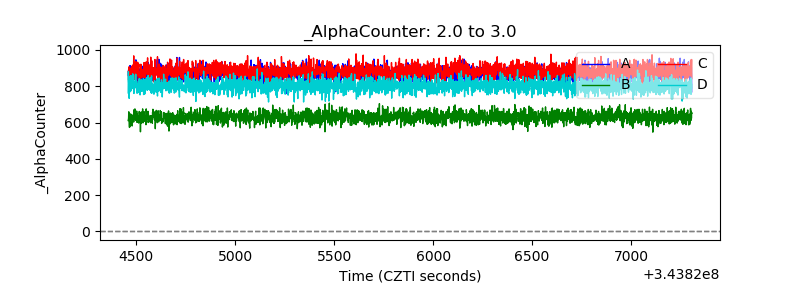 |
| _CPM_Rate | 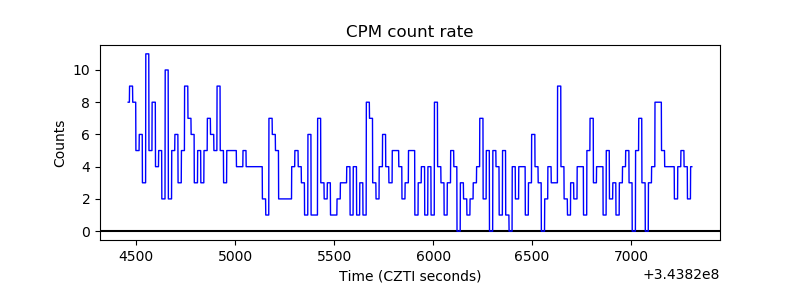 |
| CZT Counter | 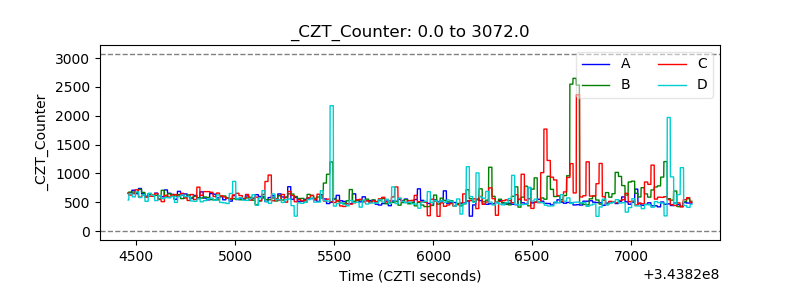 |
| +2.5 Volts monitor |  |
| +5 Volts monitor |  |
| _ROLL_ROT | 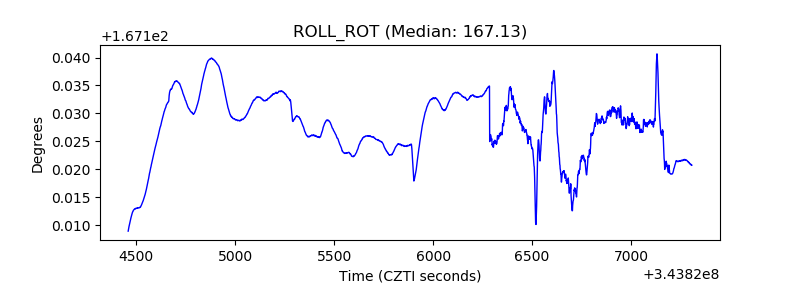 |
| _Roll_DEC | 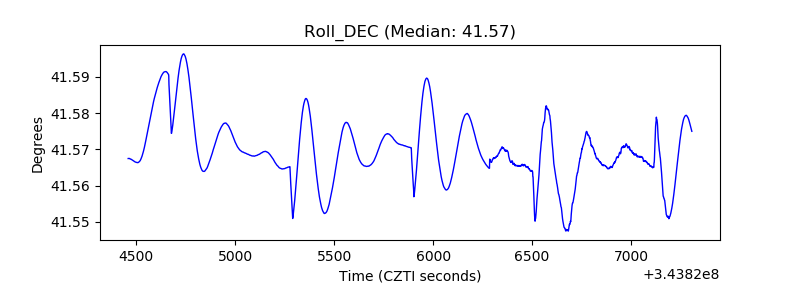 |
| _Roll_RA | 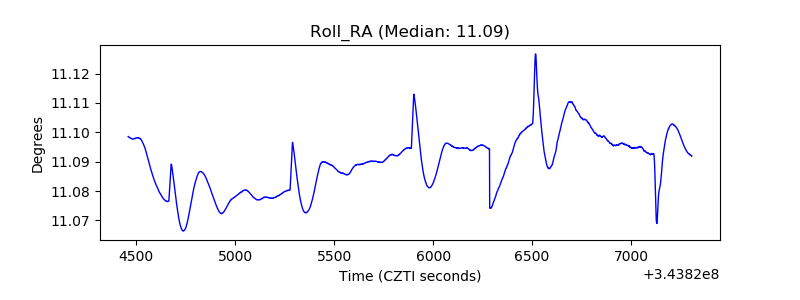 |
| Veto Counter | 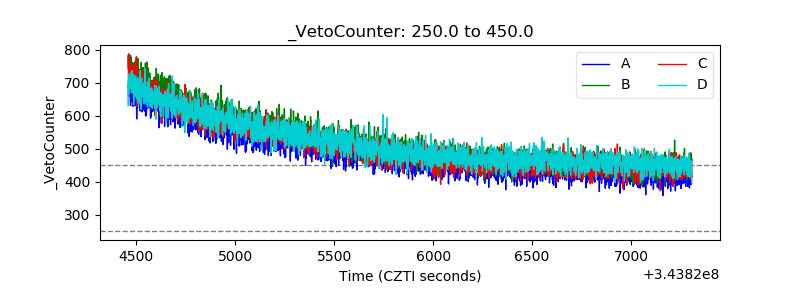 |