| Param | Original file | Final file |
|---|---|---|
| Filename | modeM0/AS1A10_024T01_9000004026cztM0_level2.fits | modeM0/AS1A10_024T01_9000004026cztM0_level2_quad_clean.evt |
| Size (bytes) | 234,037,440 | 136,897,920 |
| Size | 223.2 MB | 130.6 MB |
| Events in quadrant A | 1,508,144 | 706,201 |
| Events in quadrant B | 1,408,382 | 691,591 |
| Events in quadrant C | 1,410,528 | 644,946 |
| Events in quadrant D | 1,224,002 | 564,553 |
| Mode M0 | |||
|---|---|---|---|
| Quadrant | BADHDUFLAG | Total packets | Discarded packets |
| A | 0 | 49012 | 0 |
| B | 0 | 53699 | 0 |
| C | 0 | 49323 | 0 |
| D | 0 | 61256 | 0 |
| Mode M9 | |||
|---|---|---|---|
| Quadrant | BADHDUFLAG | Total packets | Discarded packets |
| A | 0 | 59 | 0 |
| B | 0 | 59 | 0 |
| C | 0 | 59 | 0 |
| D | 0 | 59 | 0 |
| Mode SS | |||
|---|---|---|---|
| Quadrant | BADHDUFLAG | Total packets | Discarded packets |
| A | 0 | 456 | 0 |
| B | 0 | 456 | 0 |
| C | 0 | 456 | 0 |
| D | 0 | 456 | 0 |
| Quadrant | Total seconds | Saturated seconds | Saturation percentage |
|---|---|---|---|
| A | 22323 | 332 | 1.487255% |
| B | 22323 | 729 | 3.265690% |
| C | 22323 | 455 | 2.038257% |
| D | 22323 | 1403 | 6.284998% |
Noise dominated data is calculated using 1-second bins in cleaned event files. If a bin has >2000 counts, and if more than 50% of those come from <1% of pixels, then it is considered to be noise-dominated and hence unusable.
| Quadrant | # 1 sec bins | Bins with >0 counts | Bins with >2000 counts | High rate bins dominated by noise | Noise dominated (total time) | Noise dominated (detector-on time) | Marked lightcurve |
|---|---|---|---|---|---|---|---|
| A | 28218 | 22320 | 0 | 0 | 0.00% | 0.00% | 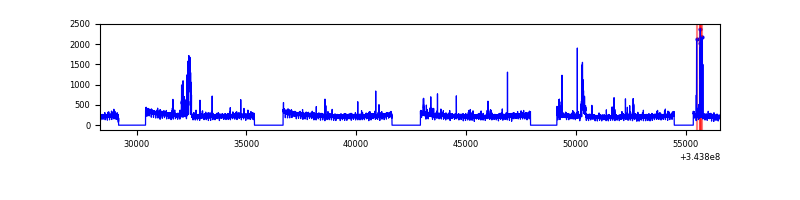 |
| B | 28218 | 22320 | 0 | 0 | 0.00% | 0.00% | 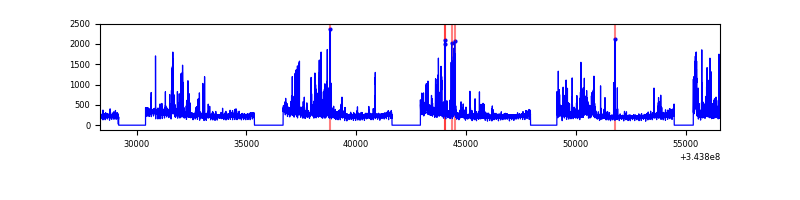 |
| C | 28218 | 22319 | 0 | 0 | 0.00% | 0.00% |  |
| D | 28218 | 22301 | 0 | 0 | 0.00% | 0.00% |  |
Top three noisy pixels from each quadrant. If the there are fewer than three noisy pixels in the level2.evt file, extra rows are filled as -1
| Pixel properties | Quadrant properties | ||||||
|---|---|---|---|---|---|---|---|
| Quadrant | DetID | PixID | Counts | Sigma | Mean | Median | Sigma |
| A | 7 | 110 | 1225 | 8.87 | 393 | 372 | 96.1 |
| A | 0 | 29 | 1216 | 8.78 | 393 | 372 | 96.1 |
| A | 9 | 19 | 1127 | 7.85 | 393 | 372 | 96.1 |
| B | 2 | 9 | 1076 | 9.67 | 374 | 360 | 74.0 |
| B | 3 | 80 | 914 | 7.48 | 374 | 360 | 74.0 |
| B | 5 | 225 | 912 | 7.46 | 374 | 360 | 74.0 |
| C | 1 | 80 | 1038 | 7.27 | 372 | 350 | 94.7 |
| C | 1 | 81 | 1037 | 7.26 | 372 | 350 | 94.7 |
| C | 12 | 241 | 1019 | 7.07 | 372 | 350 | 94.7 |
| D | 6 | 67 | 893 | 6.14 | 350 | 321 | 93.2 |
| D | 3 | 14 | 890 | 6.1 | 350 | 321 | 93.2 |
| D | 7 | 3 | 875 | 5.94 | 350 | 321 | 93.2 |
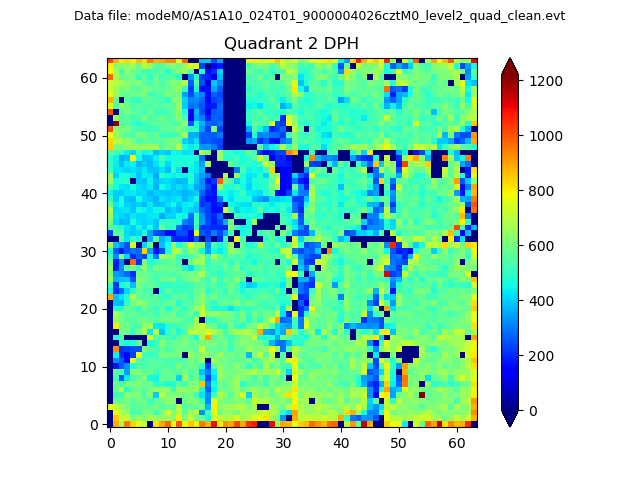
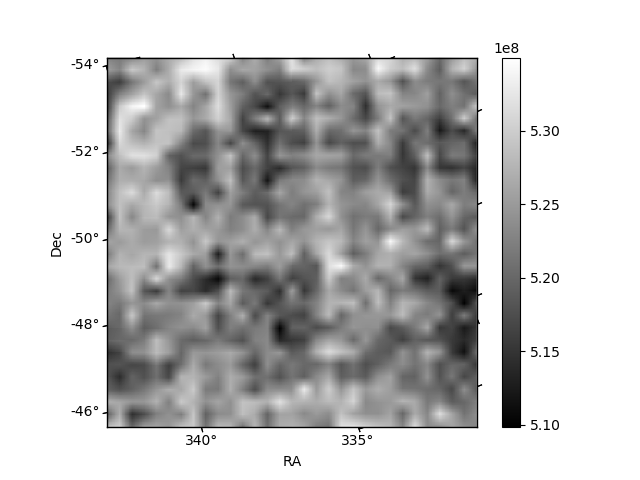
Histogram calculated using DETX and DETY for each event in the final _common_clean file
| Quadrant A | 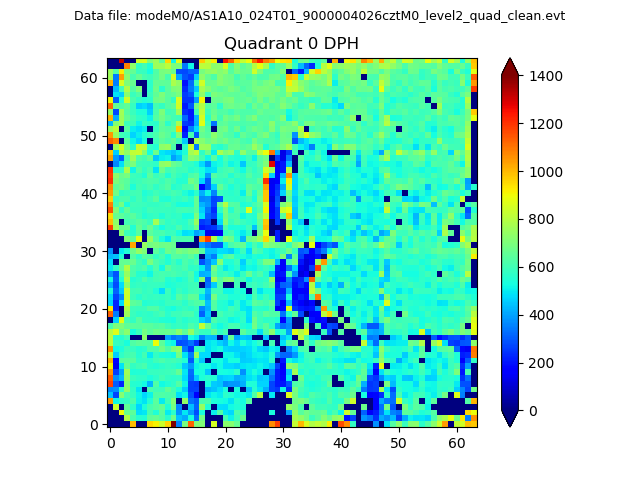 |
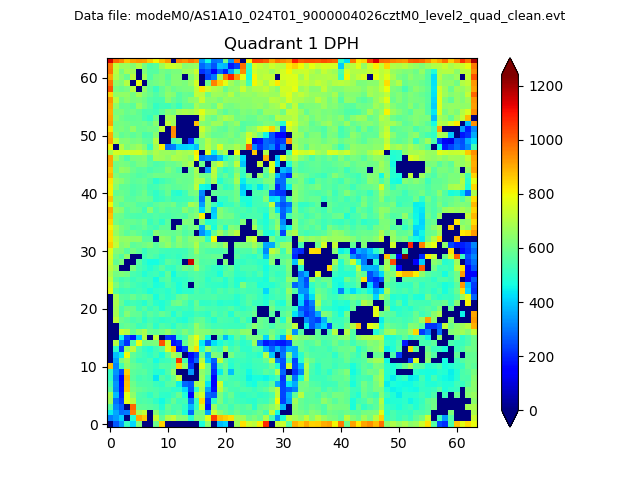 |
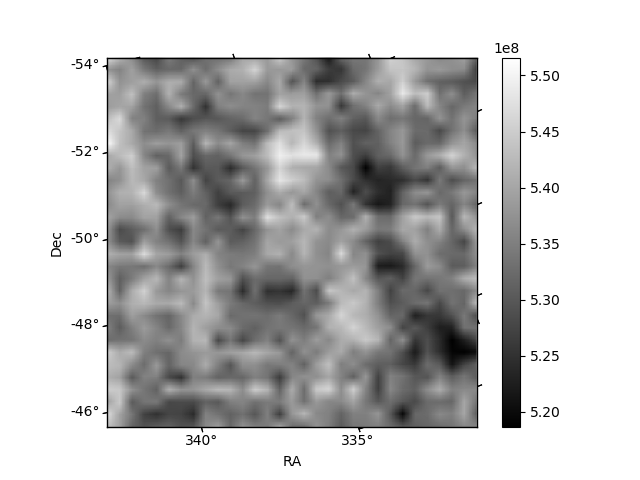
Quadrant B |
|---|---|---|---|
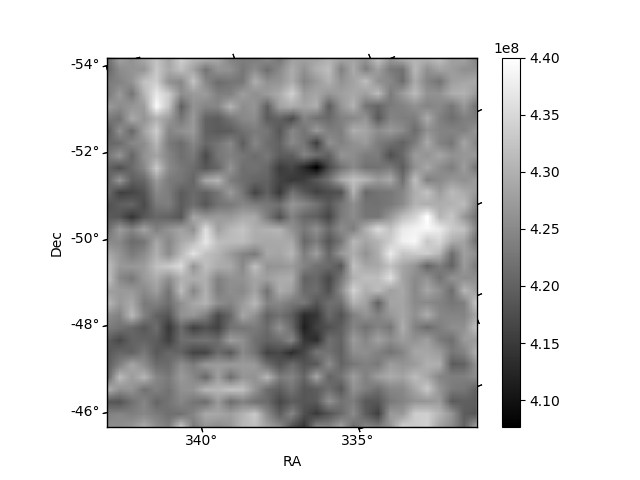
| Quadrant D | 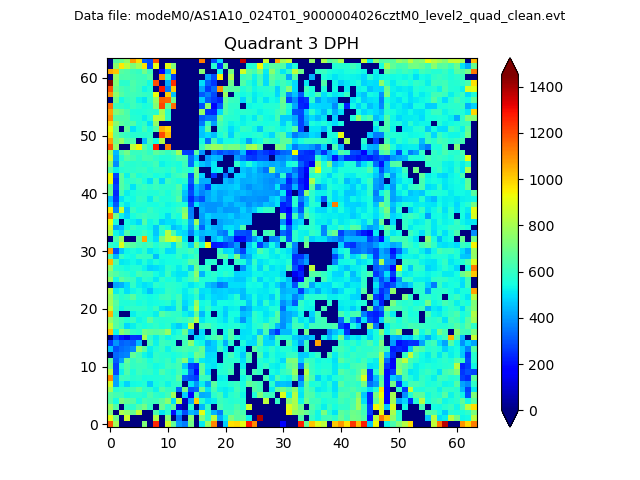 |
 |
Quadrant C |
| Plot type | Count rate plots | Images |
|---|---|---|
| Comparison with Poisson distribution Blue bars denote a histogram of data divided into 1 sec bins. Red curve is a Poisson curve with rate = median count rate of data. |
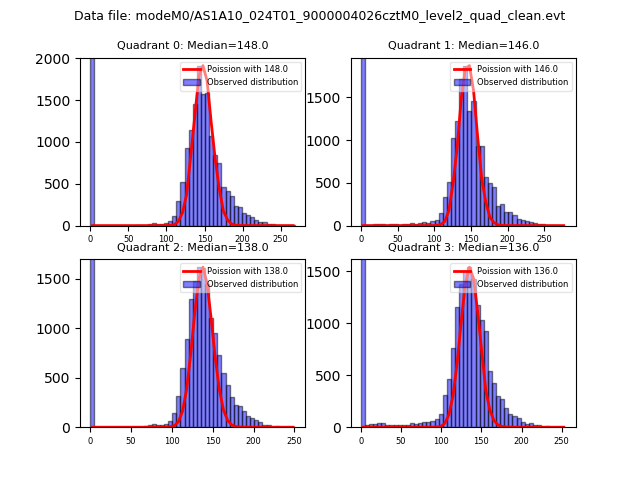 |
 |
| Quadrant-wise count rates Data is divided into 100 sec bins |
 |
|
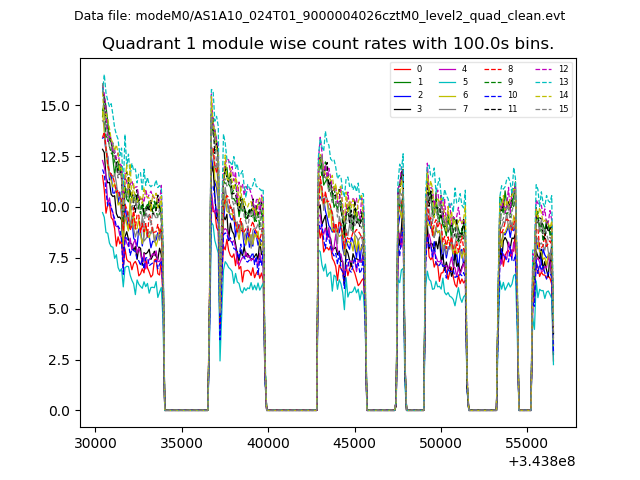
| Module-wise count rates for Quadrant A Data is divided into 100 sec bins |
 |
 |
| Module-wise count rates for Quadrant B Data is divided into 100 sec bins |
 |
 |
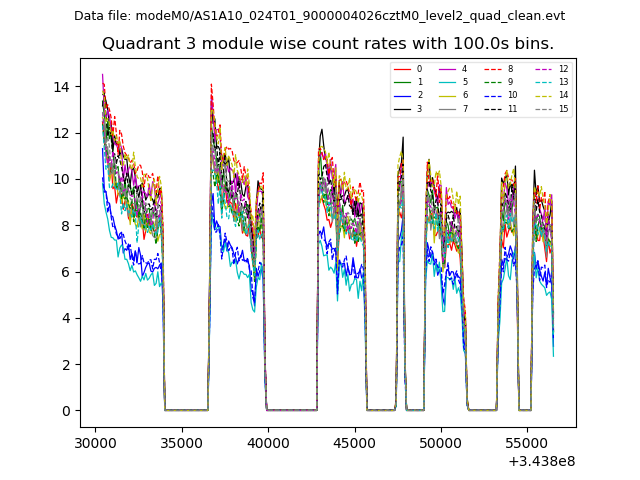
| Module-wise count rates for Quadrant C Data is divided into 100 sec bins |
 |
 |
| Module-wise count rates for Quadrant D Data is divided into 100 sec bins |
 |
 |
| Parameter | Plot |
|---|---|
| CZT HV Monitor | 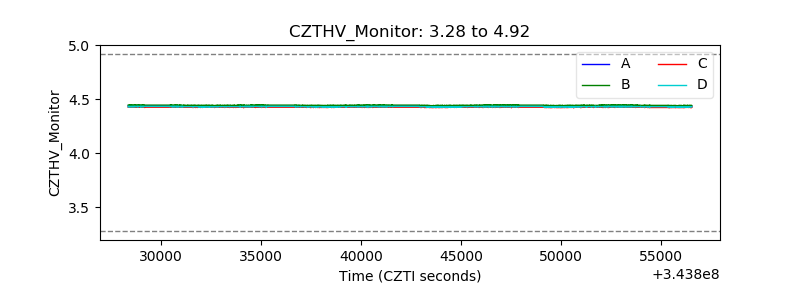 |
| D_VDD | 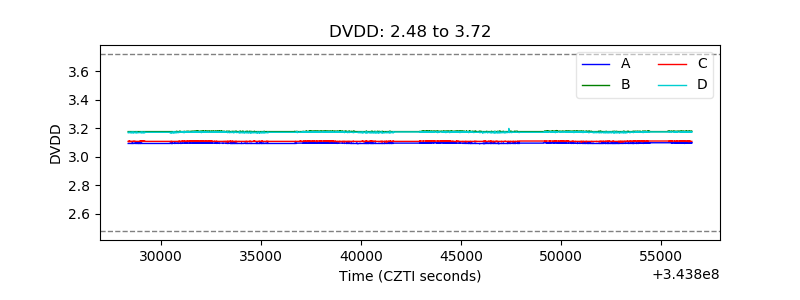 |
| Temperature 1 | 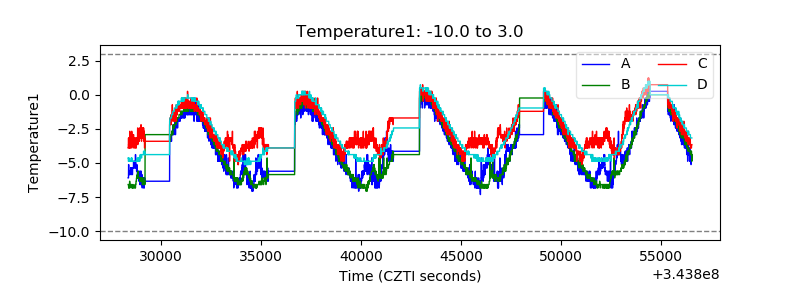 |
| Veto HV Monitor |  |
| Veto LLD | 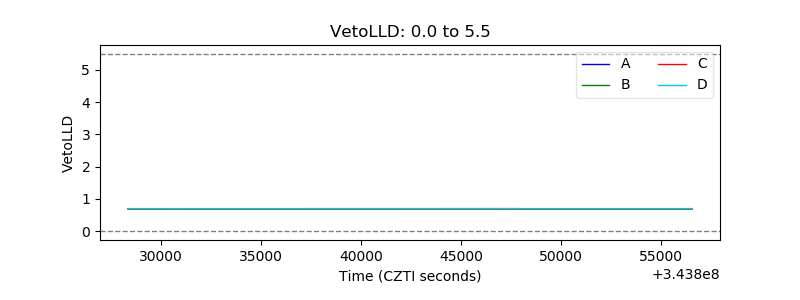 |
| Alpha Counter |  |
| _CPM_Rate | 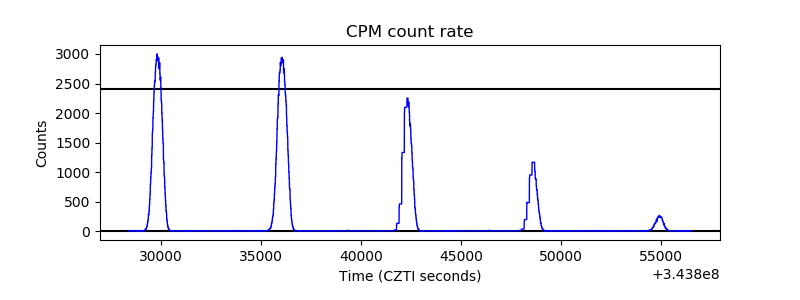 |
| CZT Counter |  |
| +2.5 Volts monitor |  |
| +5 Volts monitor |  |
| _ROLL_ROT |  |
| _Roll_DEC | 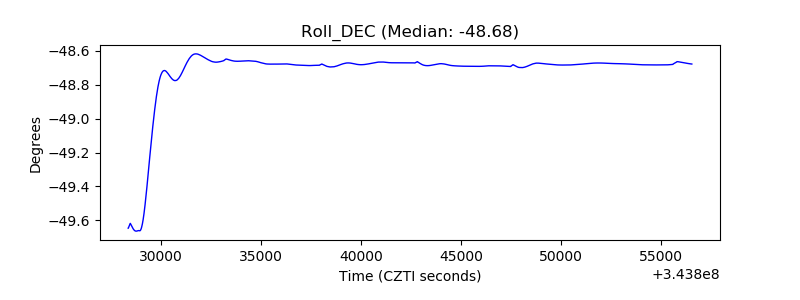 |
| _Roll_RA | 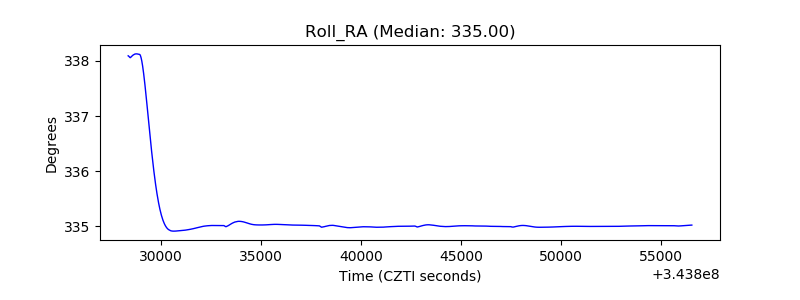 |
| Veto Counter | 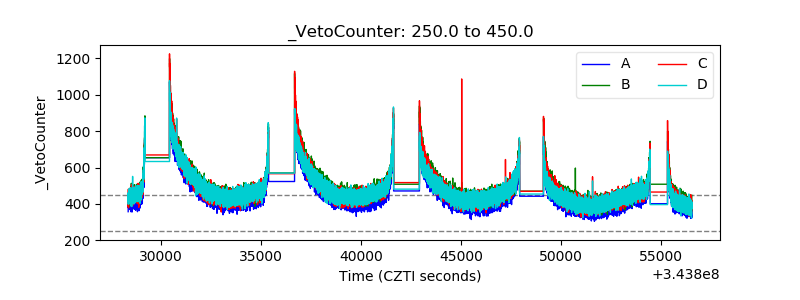 |