| Param | Original file | Final file |
|---|---|---|
| Filename | modeM0/AS1A10_024T01_9000004026_27877cztM0_level2.evt | modeM0/AS1A10_024T01_9000004026_27877cztM0_level2_quad_clean.evt |
| Size (bytes) | 201,110,400 | 41,745,600 |
| Size | 191.8 MB | 39.8 MB |
| Events in quadrant A | 1,401,762 | 283,398 |
| Events in quadrant B | 1,558,712 | 283,876 |
| Events in quadrant C | 1,473,025 | 261,619 |
| Events in quadrant D | 1,490,682 | 260,689 |
| Mode M0 | |||
|---|---|---|---|
| Quadrant | BADHDUFLAG | Total packets | Discarded packets |
| A | 0 | 5777 | 0 |
| B | 0 | 6307 | 0 |
| C | 0 | 6019 | 0 |
| D | 0 | 6018 | 0 |
| Mode M9 | |||
|---|---|---|---|
| Quadrant | BADHDUFLAG | Total packets | Discarded packets |
| A | 0 | 12 | 0 |
| B | 0 | 12 | 0 |
| C | 0 | 12 | 0 |
| D | 0 | 12 | 0 |
| Quadrant | Total seconds | Saturated seconds | Saturation percentage |
|---|---|---|---|
| A | 2416 | 82 | 3.394040% |
| B | 2416 | 114 | 4.718543% |
| C | 2416 | 82 | 3.394040% |
| D | 2416 | 58 | 2.400662% |
Noise dominated data is calculated using 1-second bins in cleaned event files. If a bin has >2000 counts, and if more than 50% of those come from <1% of pixels, then it is considered to be noise-dominated and hence unusable.
| Quadrant | # 1 sec bins | Bins with >0 counts | Bins with >2000 counts | High rate bins dominated by noise | Noise dominated (total time) | Noise dominated (detector-on time) | Marked lightcurve |
|---|---|---|---|---|---|---|---|
| A | 3641 | 2416 | 0 | 0 | 0.00% | 0.00% | 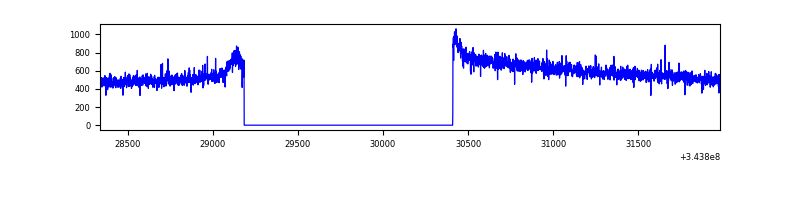 |
| B | 3641 | 2416 | 28 | 28 | 0.77% | 1.16% | 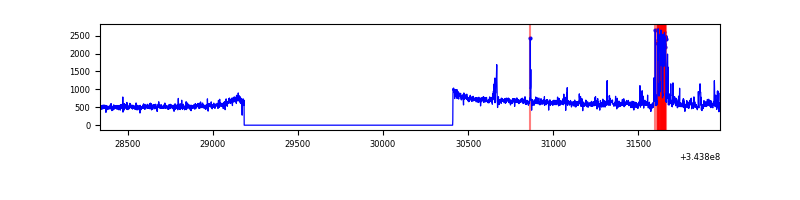 |
| C | 3641 | 2416 | 0 | 0 | 0.00% | 0.00% | 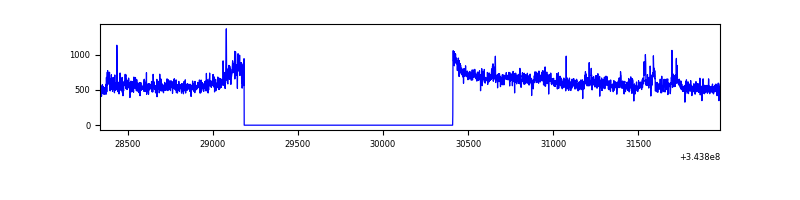 |
| D | 3641 | 2416 | 8 | 8 | 0.22% | 0.33% | 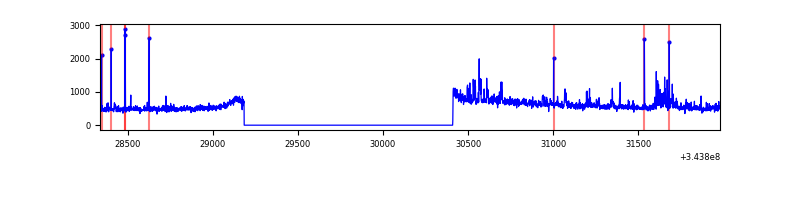 |
Top three noisy pixels from each quadrant. If the there are fewer than three noisy pixels in the level2.evt file, extra rows are filled as -1
| Pixel properties | Quadrant properties | ||||||
|---|---|---|---|---|---|---|---|
| Quadrant | DetID | PixID | Counts | Sigma | Mean | Median | Sigma |
| A | 13 | 254 | 4167 | 52.06 | 363 | 356 | 73.2 |
| A | 3 | 137 | 3295 | 40.15 | 363 | 356 | 73.2 |
| A | 0 | 226 | 3179 | 38.56 | 363 | 356 | 73.2 |
| B | 5 | 172 | 88510 | 1307.65 | 351 | 344 | 67.4 |
| B | 10 | 245 | 42293 | 622.17 | 351 | 344 | 67.4 |
| B | 0 | 190 | 30981 | 454.4 | 351 | 344 | 67.4 |
| C | 3 | 233 | 114787 | 1470.96 | 334 | 336 | 77.8 |
| C | 14 | 238 | 54433 | 695.27 | 334 | 336 | 77.8 |
| C | 13 | 61 | 2302 | 25.27 | 334 | 336 | 77.8 |
| D | 1 | 52 | 78885 | 932.03 | 347 | 337 | 84.3 |
| D | 2 | 250 | 45860 | 540.16 | 347 | 337 | 84.3 |
| D | 8 | 195 | 26255 | 307.54 | 347 | 337 | 84.3 |
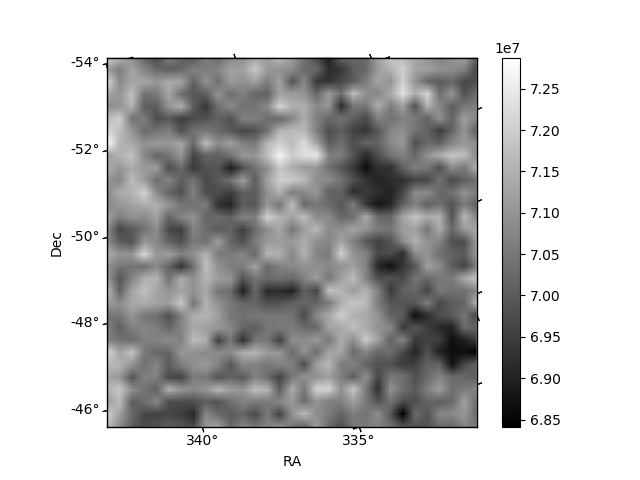
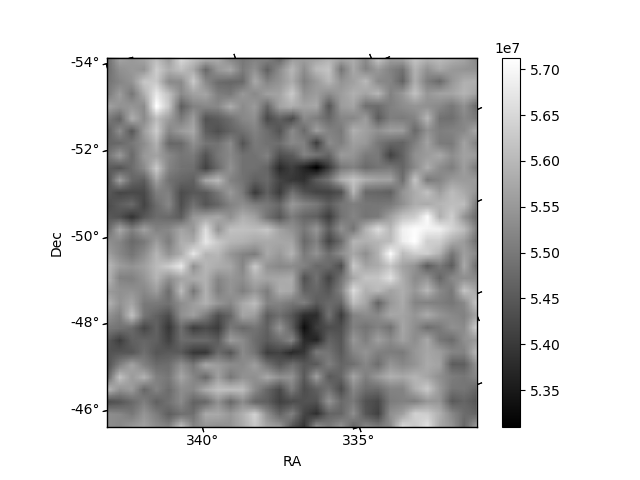
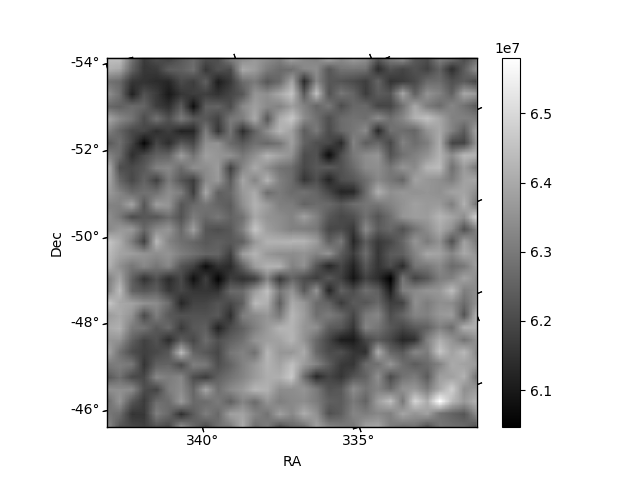
Histogram calculated using DETX and DETY for each event in the final _common_clean file
| Quadrant A | 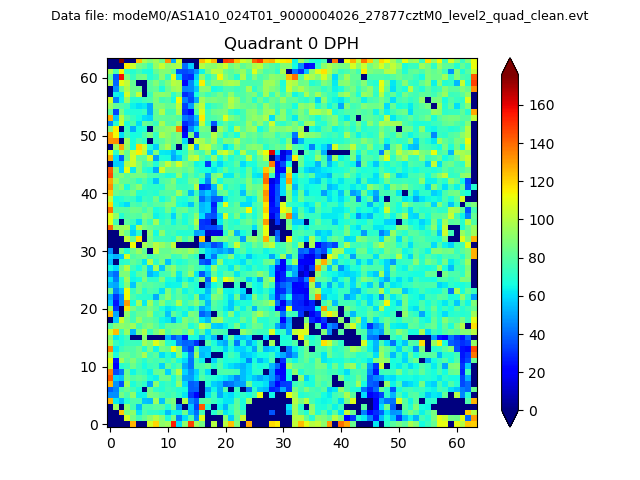 |
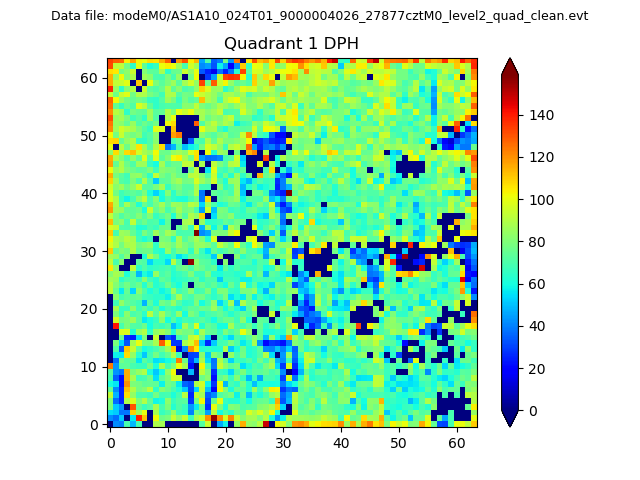 |
Quadrant B |
|---|---|---|---|
| Quadrant D | 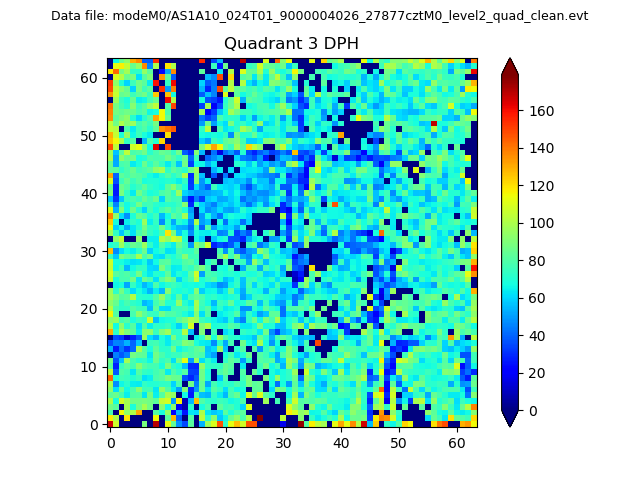 |
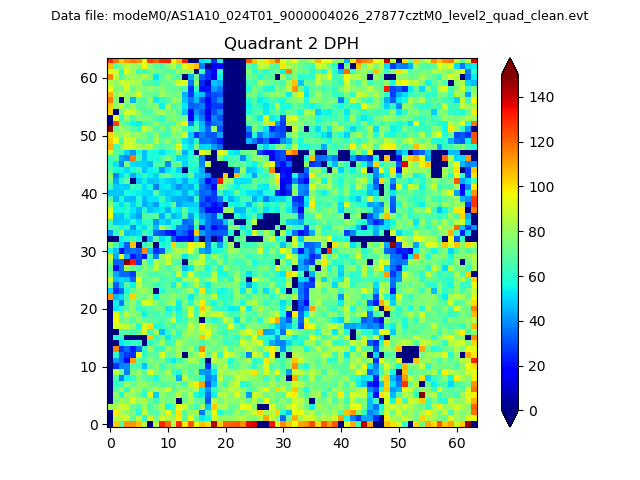 |
Quadrant C |
| Plot type | Count rate plots | Images |
|---|---|---|
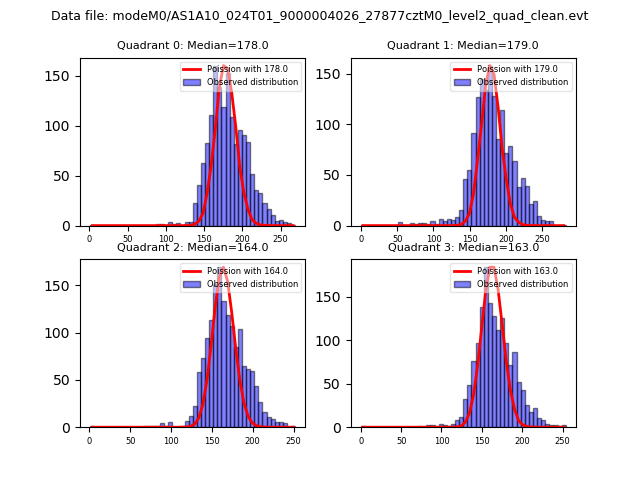
| Comparison with Poisson distribution Blue bars denote a histogram of data divided into 1 sec bins. Red curve is a Poisson curve with rate = median count rate of data. |
 |
 |
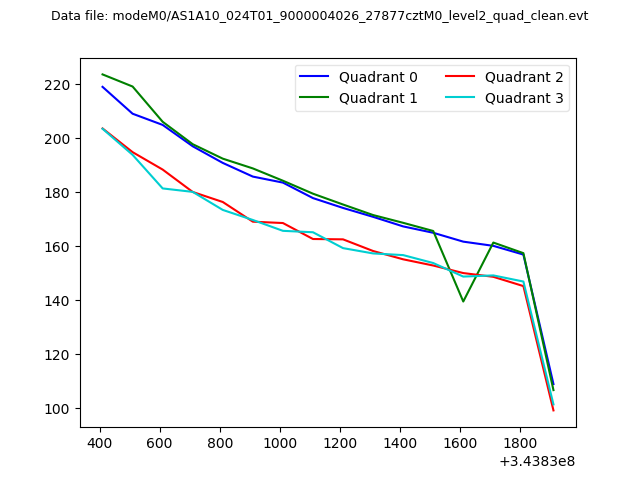
| Quadrant-wise count rates Data is divided into 100 sec bins |
 |
|
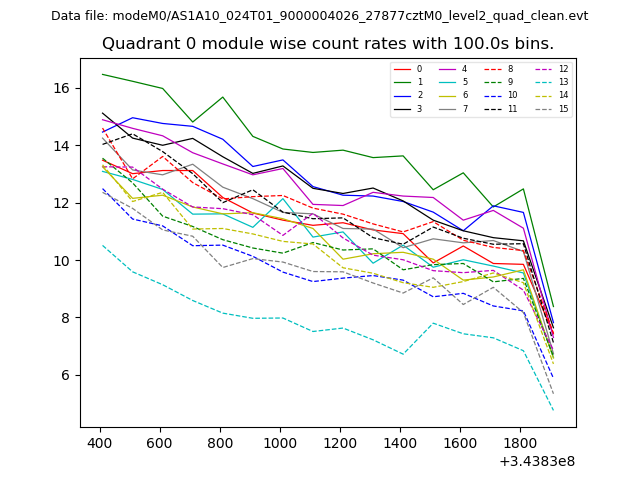
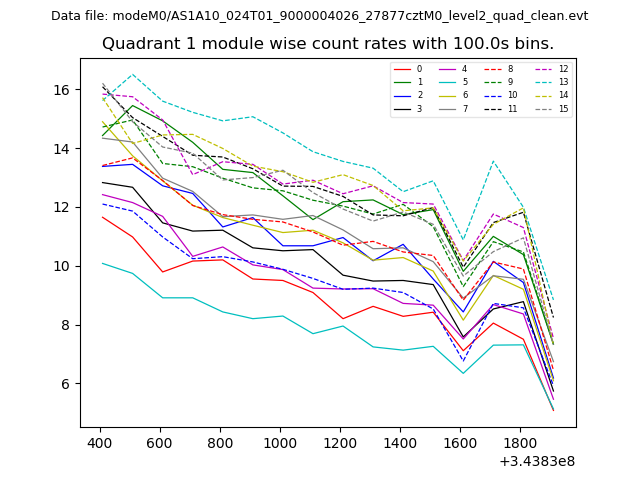
| Module-wise count rates for Quadrant A Data is divided into 100 sec bins |
 |
 |
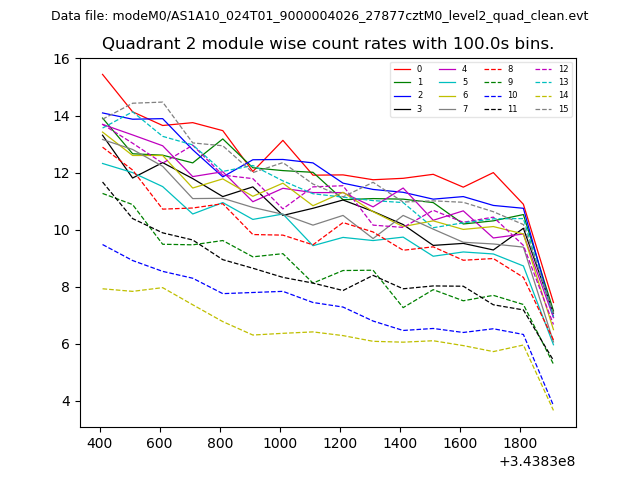
| Module-wise count rates for Quadrant B Data is divided into 100 sec bins |
 |
 |
| Module-wise count rates for Quadrant C Data is divided into 100 sec bins |
 |
 |
| Module-wise count rates for Quadrant D Data is divided into 100 sec bins |
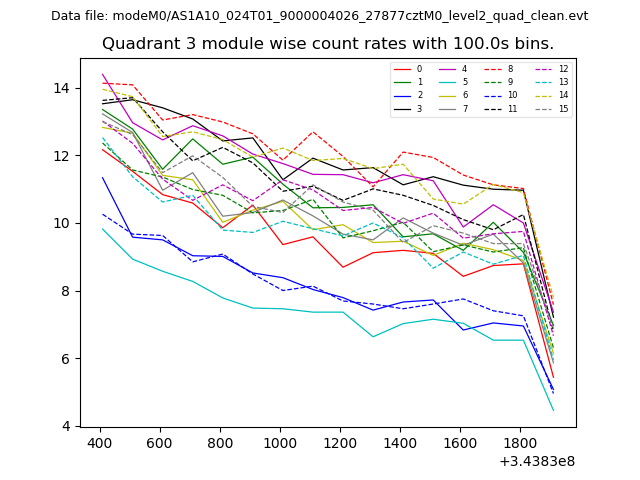 |
 |
| Parameter | Plot |
|---|---|
| CZT HV Monitor | 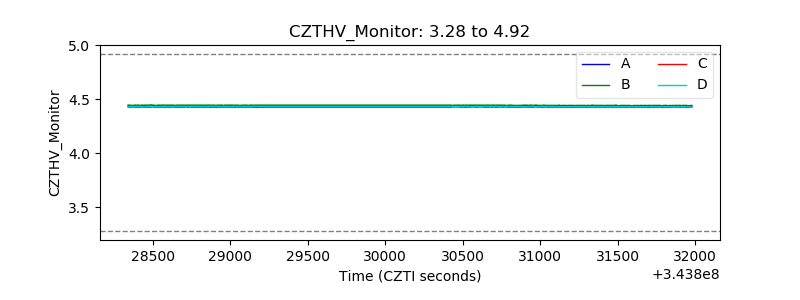 |
| D_VDD | 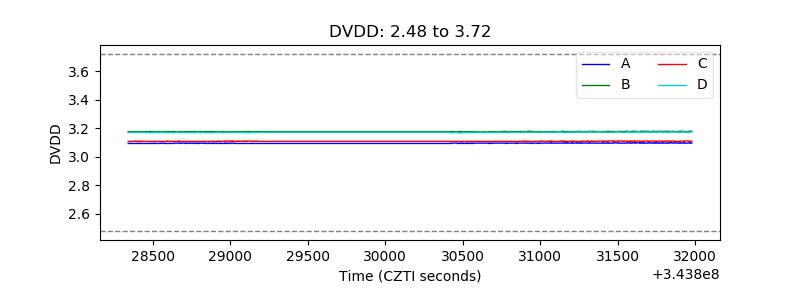 |
| Temperature 1 | 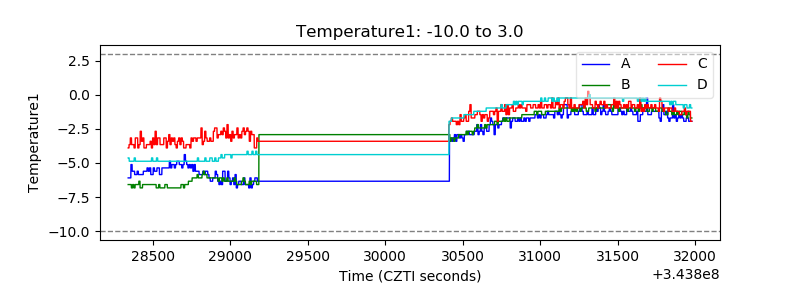 |
| Veto HV Monitor | 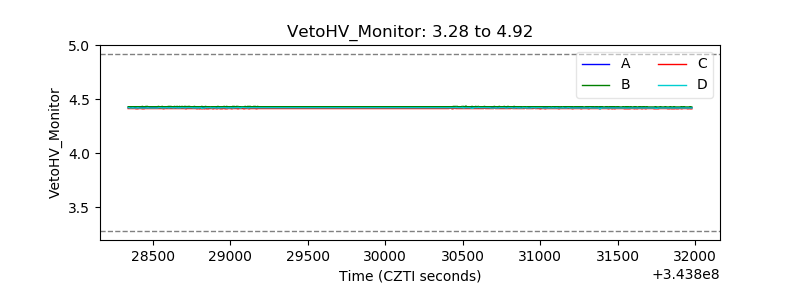 |
| Veto LLD | 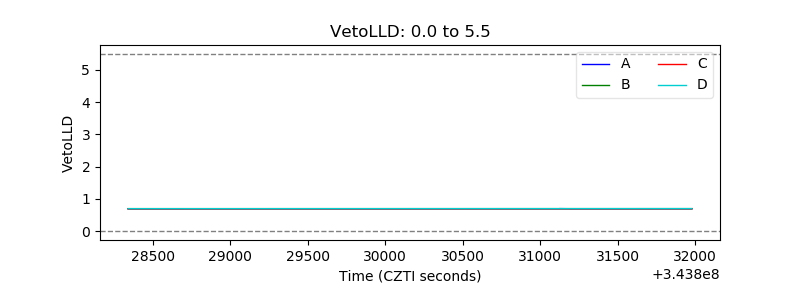 |
| Alpha Counter | 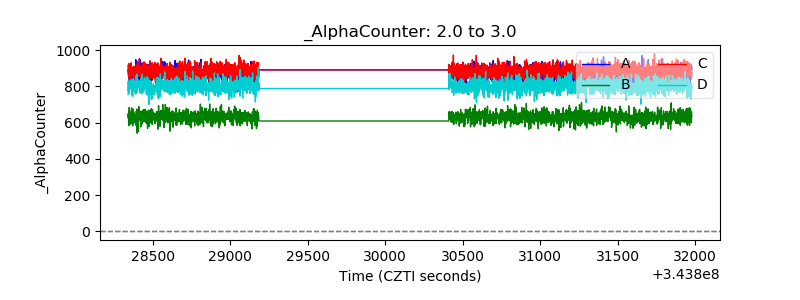 |
| _CPM_Rate | 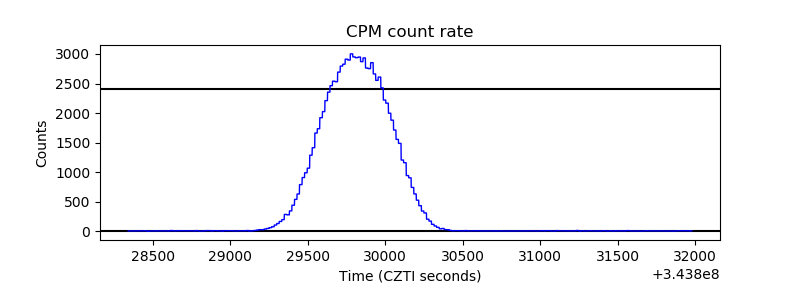 |
| CZT Counter | 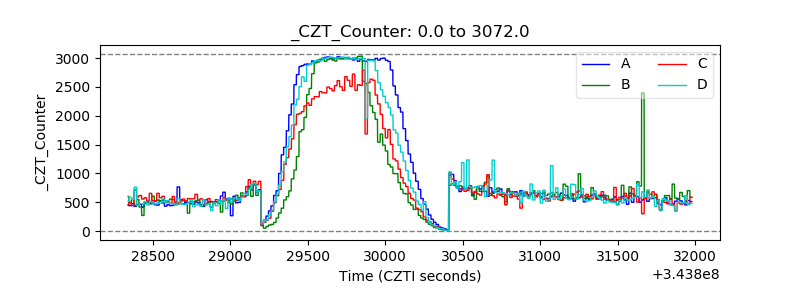 |
| +2.5 Volts monitor |  |
| +5 Volts monitor |  |
| _ROLL_ROT | 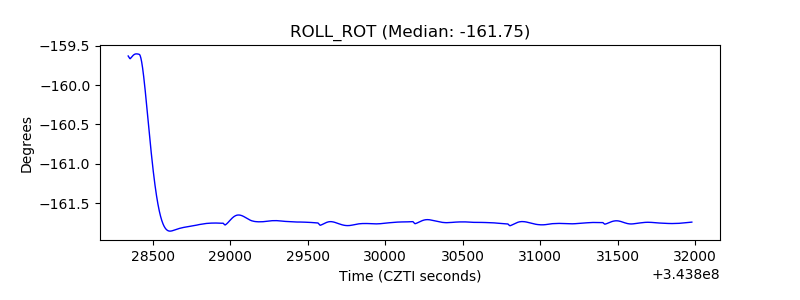 |
| _Roll_DEC | 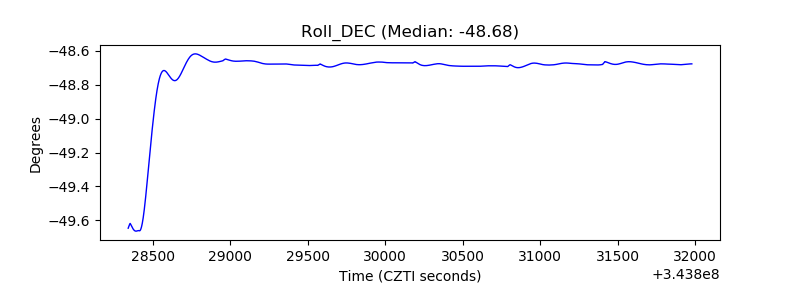 |
| _Roll_RA |  |
| Veto Counter | 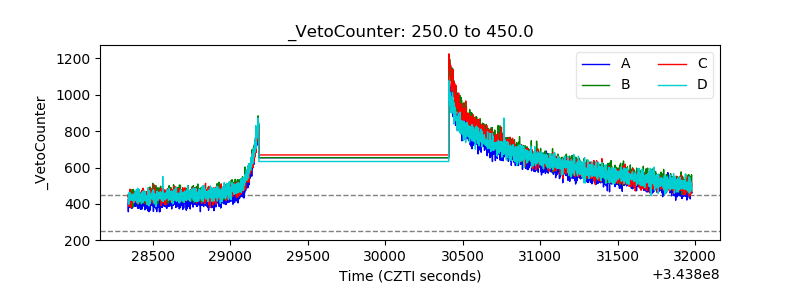 |