| Param | Original file | Final file |
|---|---|---|
| Filename | modeM0/AS1A10_024T01_9000004026_27878cztM0_level2.evt | modeM0/AS1A10_024T01_9000004026_27878cztM0_level2_quad_clean.evt |
| Size (bytes) | 463,754,880 | 103,066,560 |
| Size | 442.3 MB | 98.3 MB |
| Events in quadrant A | 3,236,922 | 712,266 |
| Events in quadrant B | 3,611,051 | 693,132 |
| Events in quadrant C | 3,238,781 | 655,457 |
| Events in quadrant D | 3,562,813 | 653,455 |
| Mode M0 | |||
|---|---|---|---|
| Quadrant | BADHDUFLAG | Total packets | Discarded packets |
| A | 0 | 13309 | 0 |
| B | 0 | 14490 | 0 |
| C | 0 | 13346 | 0 |
| D | 0 | 14347 | 0 |
| Mode M9 | |||
|---|---|---|---|
| Quadrant | BADHDUFLAG | Total packets | Discarded packets |
| A | 0 | 13 | 0 |
| B | 0 | 13 | 0 |
| C | 0 | 13 | 0 |
| D | 0 | 13 | 0 |
| Quadrant | Total seconds | Saturated seconds | Saturation percentage |
|---|---|---|---|
| A | 5826 | 72 | 1.235839% |
| B | 5826 | 247 | 4.239616% |
| C | 5827 | 97 | 1.664664% |
| D | 5827 | 80 | 1.372919% |
Noise dominated data is calculated using 1-second bins in cleaned event files. If a bin has >2000 counts, and if more than 50% of those come from <1% of pixels, then it is considered to be noise-dominated and hence unusable.
| Quadrant | # 1 sec bins | Bins with >0 counts | Bins with >2000 counts | High rate bins dominated by noise | Noise dominated (total time) | Noise dominated (detector-on time) | Marked lightcurve |
|---|---|---|---|---|---|---|---|
| A | 7131 | 5826 | 0 | 0 | 0.00% | 0.00% | 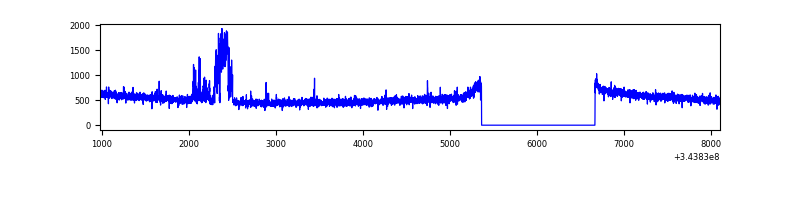 |
| B | 7131 | 5826 | 155 | 155 | 2.17% | 2.66% | 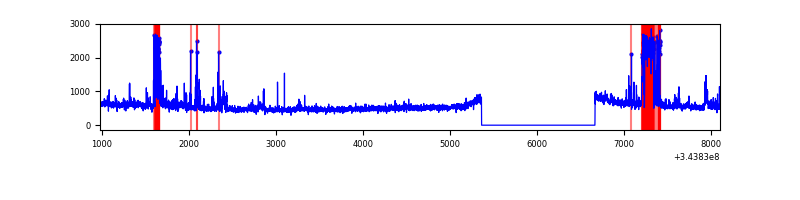 |
| C | 7132 | 5827 | 2 | 2 | 0.03% | 0.03% | 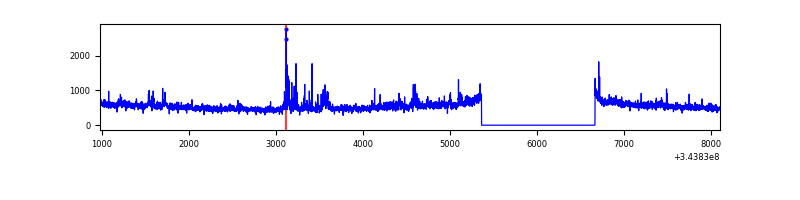 |
| D | 7132 | 5827 | 54 | 54 | 0.76% | 0.93% | 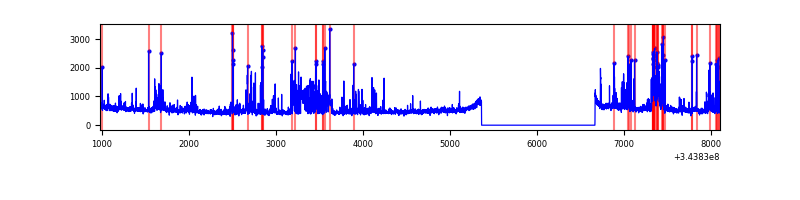 |
Top three noisy pixels from each quadrant. If the there are fewer than three noisy pixels in the level2.evt file, extra rows are filled as -1
| Pixel properties | Quadrant properties | ||||||
|---|---|---|---|---|---|---|---|
| Quadrant | DetID | PixID | Counts | Sigma | Mean | Median | Sigma |
| A | 6 | 16 | 198916 | 1258.81 | 786 | 773 | 157.4 |
| A | 13 | 254 | 10469 | 61.6 | 786 | 773 | 157.4 |
| A | 0 | 226 | 7109 | 40.25 | 786 | 773 | 157.4 |
| B | 5 | 172 | 412346 | 2897.83 | 758 | 741 | 142.0 |
| B | 10 | 245 | 116933 | 818.03 | 758 | 741 | 142.0 |
| B | 4 | 200 | 30191 | 207.34 | 758 | 741 | 142.0 |
| C | 3 | 233 | 300737 | 1817.4 | 721 | 727 | 165.1 |
| C | 14 | 238 | 119187 | 717.61 | 721 | 727 | 165.1 |
| C | 13 | 61 | 5117 | 26.59 | 721 | 727 | 165.1 |
| D | 1 | 52 | 403583 | 2311.64 | 740 | 721 | 174.3 |
| D | 2 | 250 | 266513 | 1525.13 | 740 | 721 | 174.3 |
| D | 2 | 234 | 25757 | 143.66 | 740 | 721 | 174.3 |
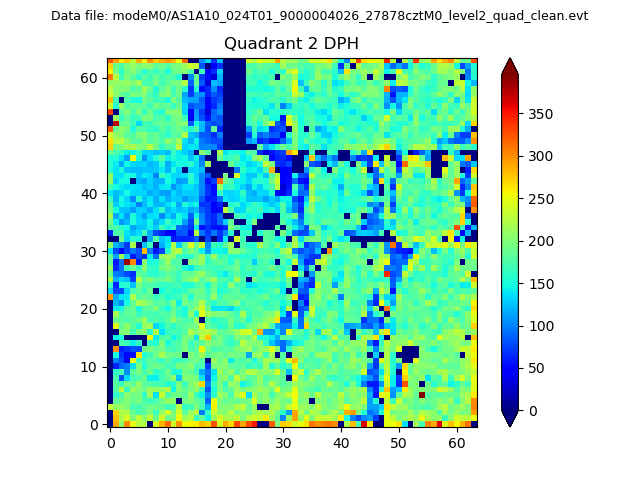
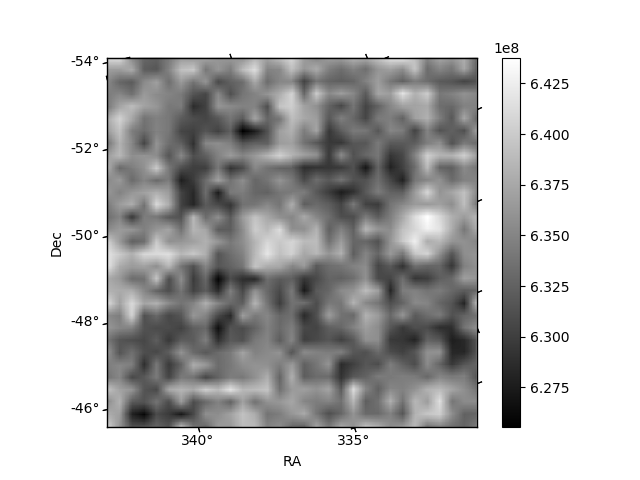
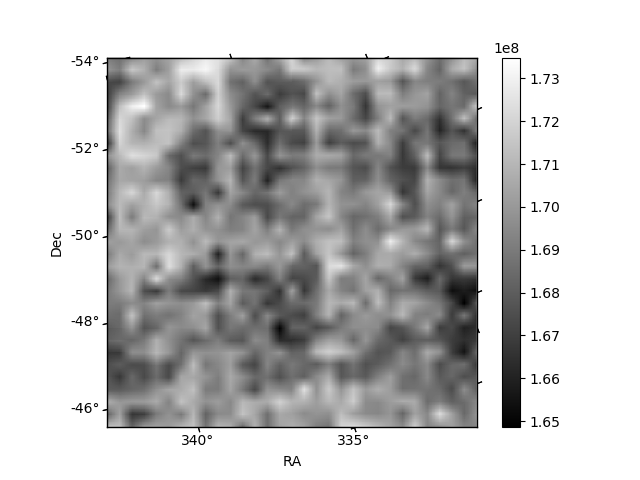
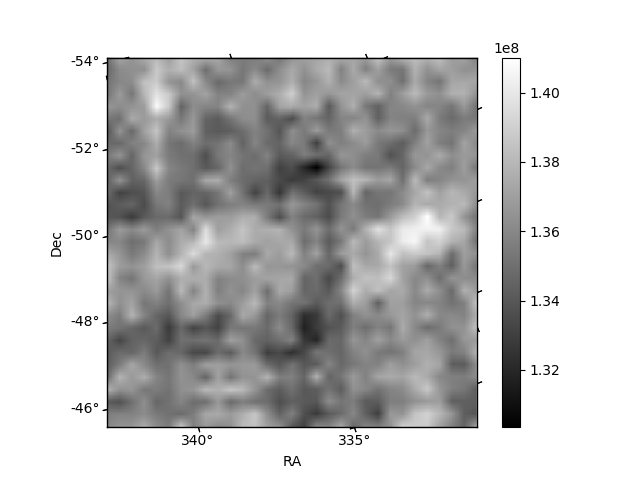
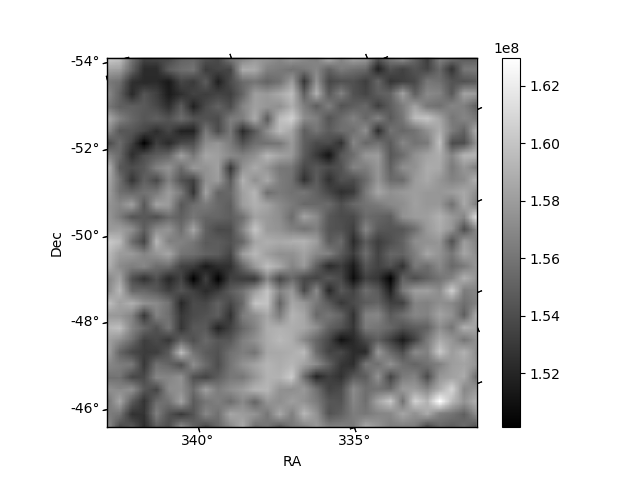
Histogram calculated using DETX and DETY for each event in the final _common_clean file
| Quadrant A | 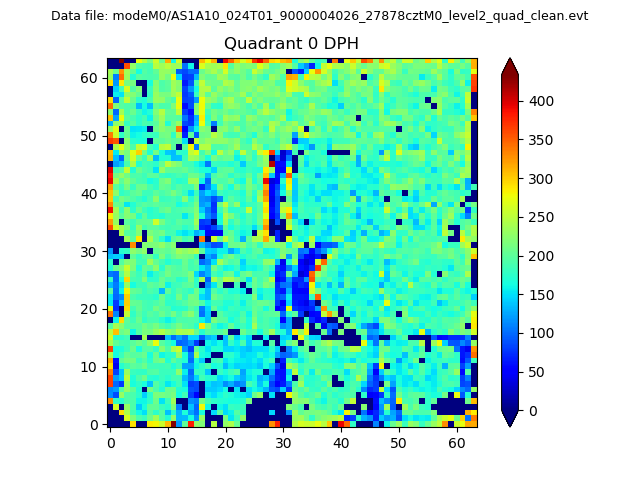 |
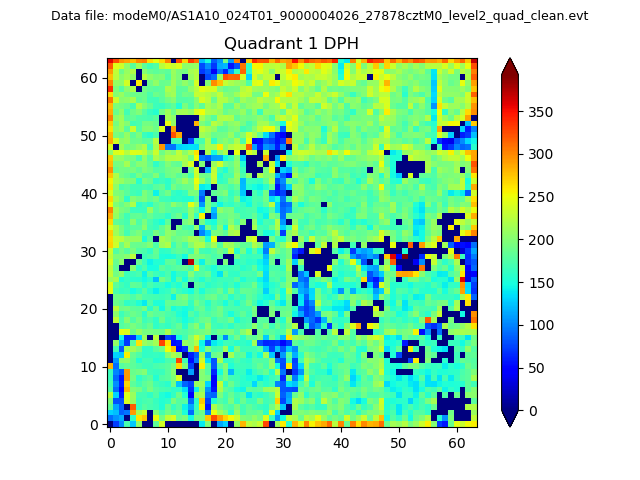 |
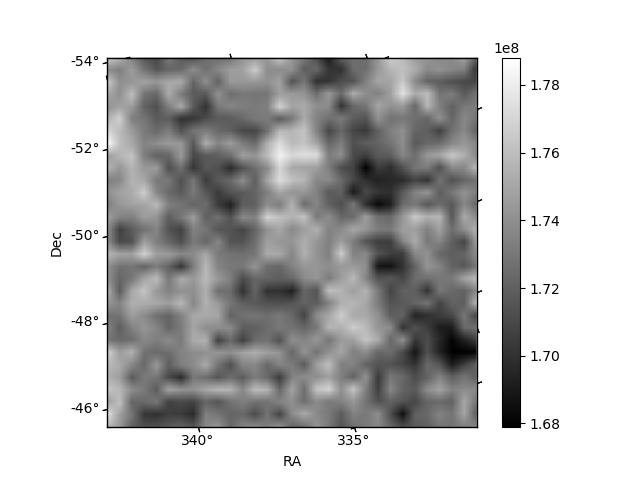
Quadrant B |
|---|---|---|---|
| Quadrant D | 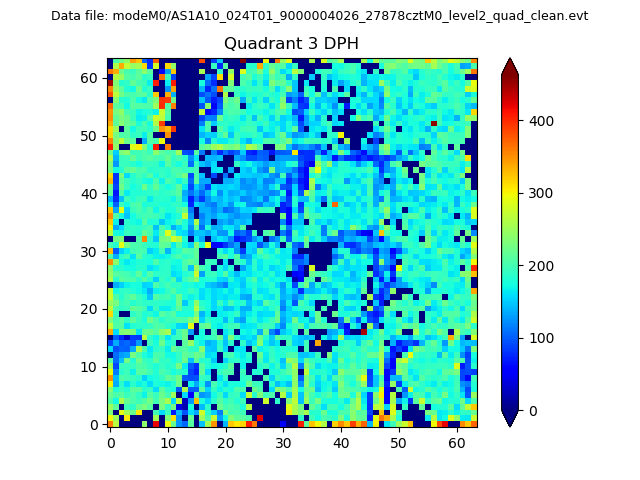 |
 |
Quadrant C |
| Plot type | Count rate plots | Images |
|---|---|---|
| Comparison with Poisson distribution Blue bars denote a histogram of data divided into 1 sec bins. Red curve is a Poisson curve with rate = median count rate of data. |
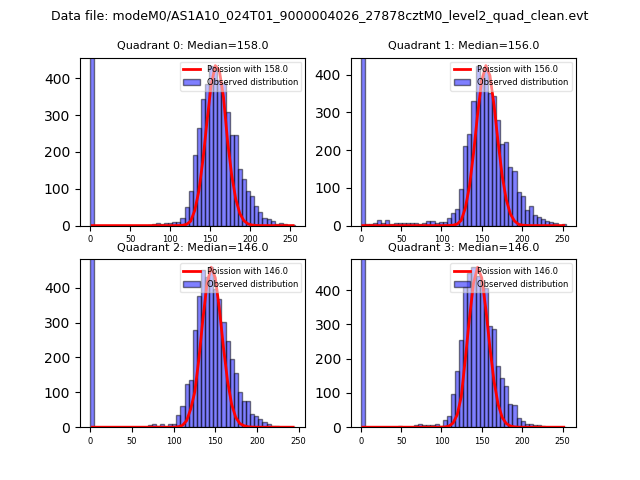 |
 |
| Quadrant-wise count rates Data is divided into 100 sec bins |
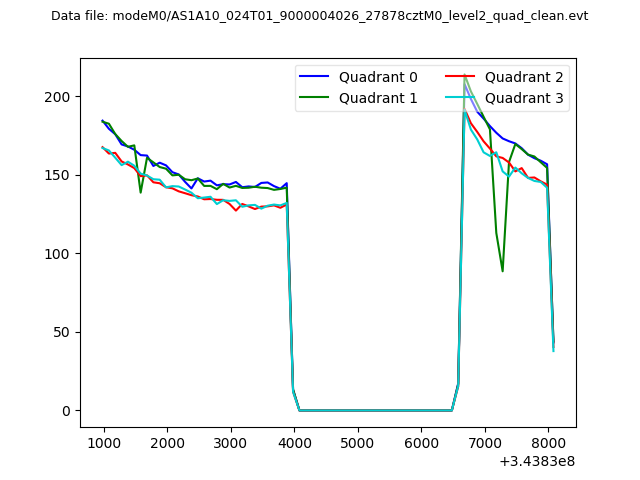 |
|
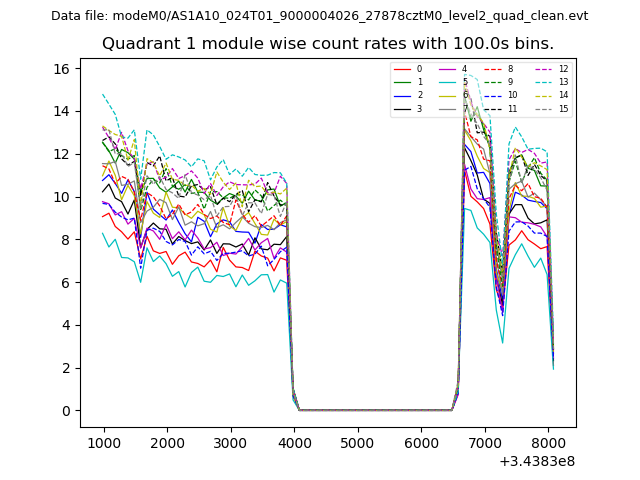
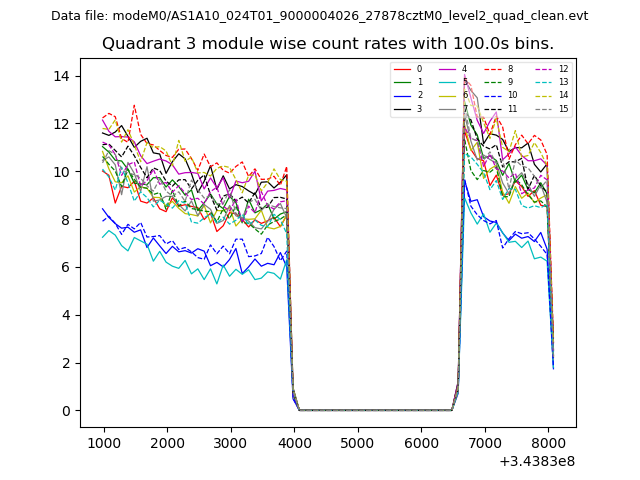
| Module-wise count rates for Quadrant A Data is divided into 100 sec bins |
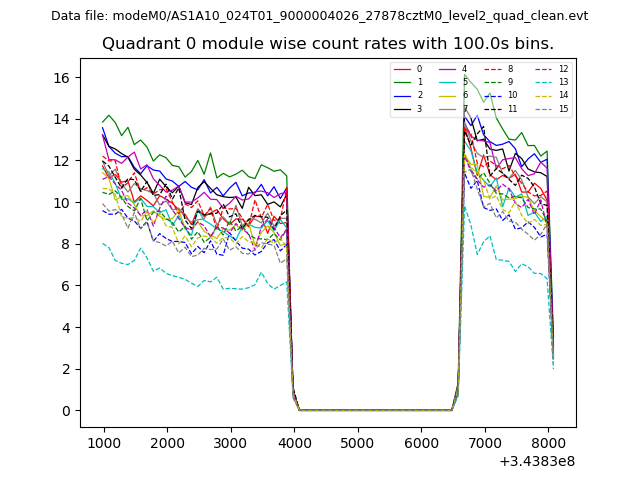 |
 |
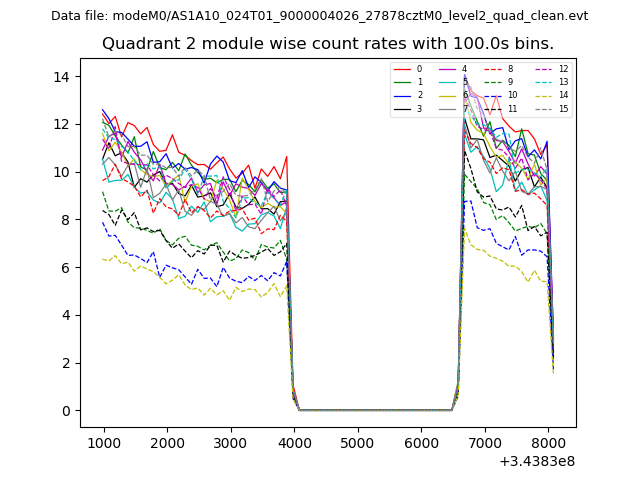
| Module-wise count rates for Quadrant B Data is divided into 100 sec bins |
 |
 |
| Module-wise count rates for Quadrant C Data is divided into 100 sec bins |
 |
 |
| Module-wise count rates for Quadrant D Data is divided into 100 sec bins |
 |
 |
| Parameter | Plot |
|---|---|
| CZT HV Monitor | 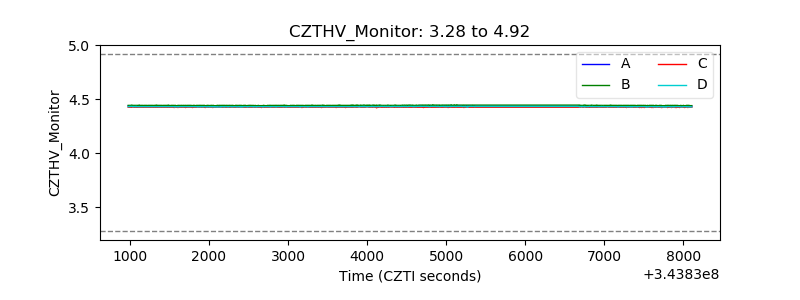 |
| D_VDD |  |
| Temperature 1 | 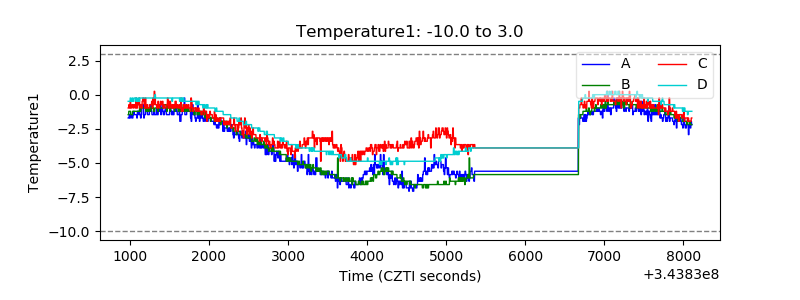 |
| Veto HV Monitor | 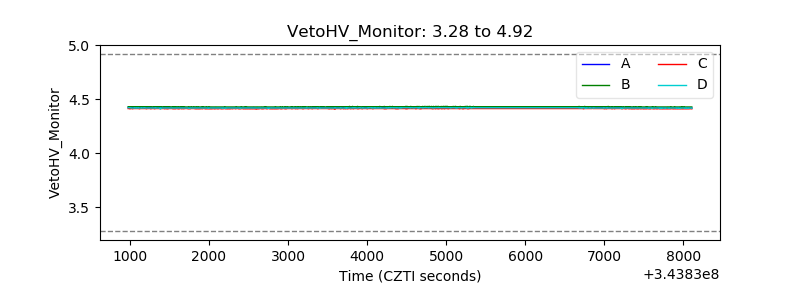 |
| Veto LLD | 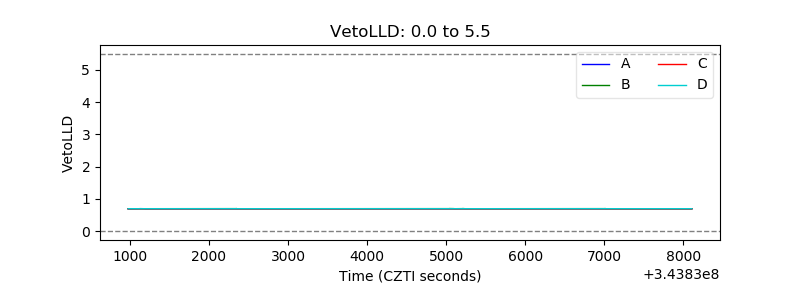 |
| Alpha Counter | 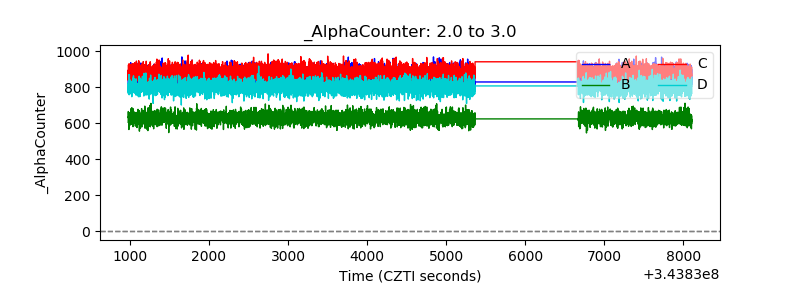 |
| _CPM_Rate | 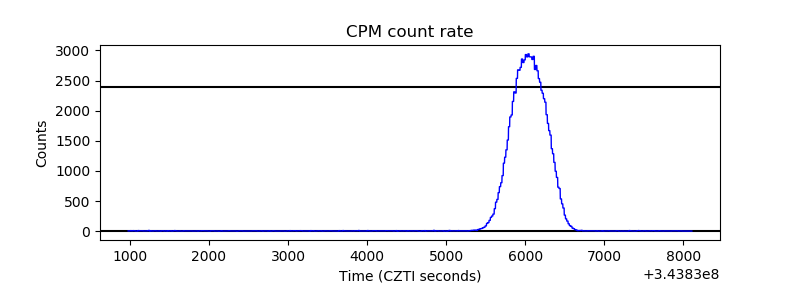 |
| CZT Counter | 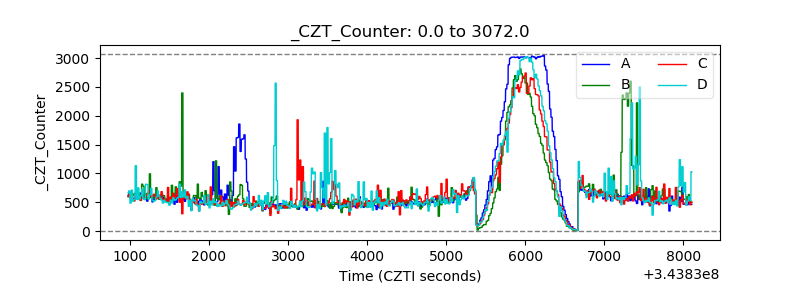 |
| +2.5 Volts monitor |  |
| +5 Volts monitor |  |
| _ROLL_ROT | 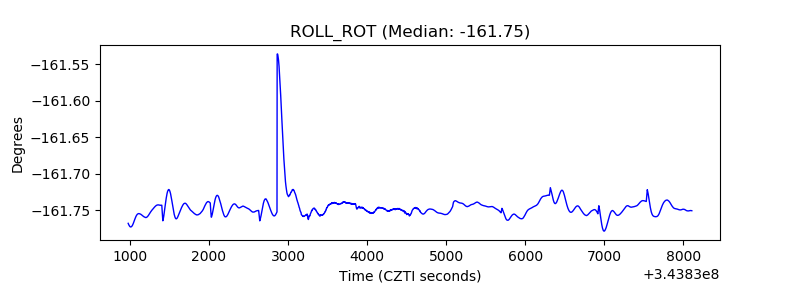 |
| _Roll_DEC | 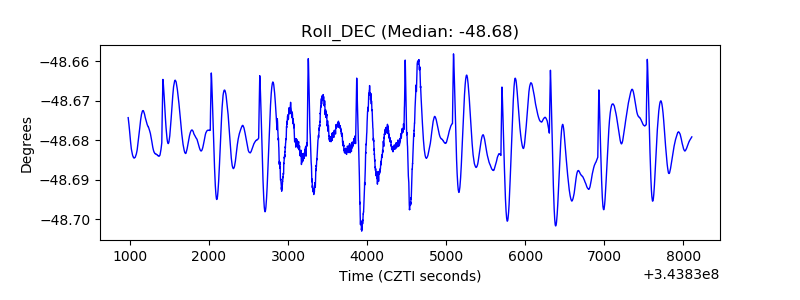 |
| _Roll_RA | 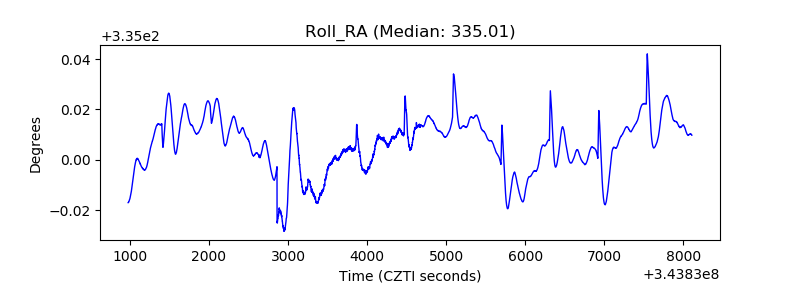 |
| Veto Counter | 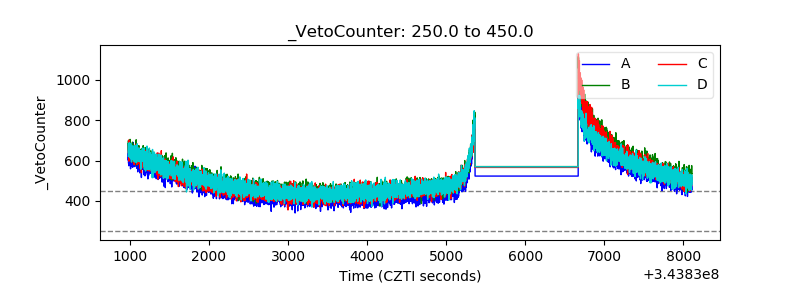 |