| Param | Original file | Final file |
|---|---|---|
| Filename | modeM0/AS1A10_024T01_9000004026_27879cztM0_level2.evt | modeM0/AS1A10_024T01_9000004026_27879cztM0_level2_quad_clean.evt |
| Size (bytes) | 456,670,080 | 89,645,760 |
| Size | 435.5 MB | 85.5 MB |
| Events in quadrant A | 2,913,493 | 611,141 |
| Events in quadrant B | 3,596,961 | 596,490 |
| Events in quadrant C | 2,963,696 | 561,877 |
| Events in quadrant D | 3,966,250 | 543,819 |
| Mode M0 | |||
|---|---|---|---|
| Quadrant | BADHDUFLAG | Total packets | Discarded packets |
| A | 0 | 12192 | 0 |
| B | 0 | 14382 | 0 |
| C | 0 | 12278 | 0 |
| D | 0 | 15559 | 0 |
| Mode M9 | |||
|---|---|---|---|
| Quadrant | BADHDUFLAG | Total packets | Discarded packets |
| A | 0 | 13 | 0 |
| B | 0 | 13 | 0 |
| C | 0 | 13 | 0 |
| D | 0 | 13 | 0 |
| Quadrant | Total seconds | Saturated seconds | Saturation percentage |
|---|---|---|---|
| A | 5742 | 82 | 1.428074% |
| B | 5743 | 222 | 3.865575% |
| C | 5743 | 112 | 1.950200% |
| D | 5742 | 265 | 4.615117% |
Noise dominated data is calculated using 1-second bins in cleaned event files. If a bin has >2000 counts, and if more than 50% of those come from <1% of pixels, then it is considered to be noise-dominated and hence unusable.
| Quadrant | # 1 sec bins | Bins with >0 counts | Bins with >2000 counts | High rate bins dominated by noise | Noise dominated (total time) | Noise dominated (detector-on time) | Marked lightcurve |
|---|---|---|---|---|---|---|---|
| A | 7037 | 5742 | 0 | 0 | 0.00% | 0.00% | 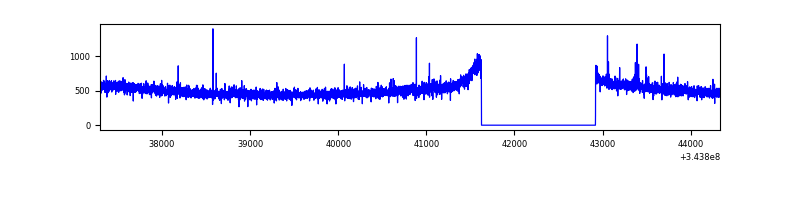 |
| B | 7038 | 5743 | 100 | 100 | 1.42% | 1.74% | 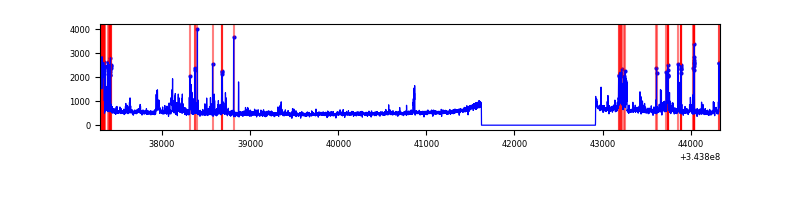 |
| C | 7038 | 5743 | 3 | 3 | 0.04% | 0.05% | 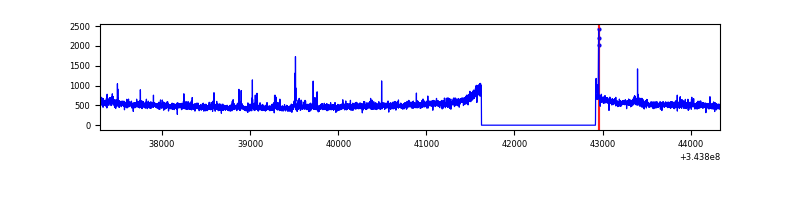 |
| D | 7037 | 5742 | 239 | 239 | 3.40% | 4.16% | 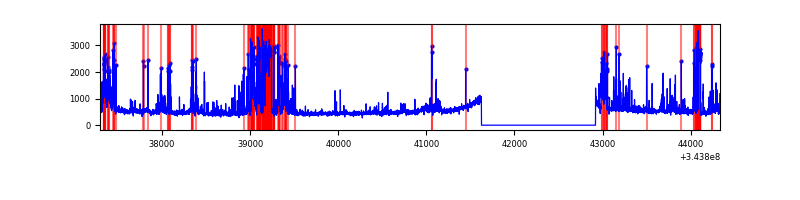 |
Top three noisy pixels from each quadrant. If the there are fewer than three noisy pixels in the level2.evt file, extra rows are filled as -1
| Pixel properties | Quadrant properties | ||||||
|---|---|---|---|---|---|---|---|
| Quadrant | DetID | PixID | Counts | Sigma | Mean | Median | Sigma |
| A | 13 | 254 | 10980 | 68.21 | 752 | 738 | 150.1 |
| A | 13 | 248 | 9226 | 56.53 | 752 | 738 | 150.1 |
| A | 0 | 226 | 6672 | 39.52 | 752 | 738 | 150.1 |
| B | 5 | 172 | 302197 | 2191.68 | 738 | 722 | 137.6 |
| B | 10 | 245 | 122023 | 881.84 | 738 | 722 | 137.6 |
| B | 0 | 190 | 112338 | 811.43 | 738 | 722 | 137.6 |
| C | 3 | 233 | 119462 | 738.09 | 697 | 701 | 160.9 |
| C | 14 | 238 | 115773 | 715.16 | 697 | 701 | 160.9 |
| C | 0 | 207 | 11343 | 66.14 | 697 | 701 | 160.9 |
| D | 1 | 52 | 812318 | 4815.07 | 703 | 685 | 168.6 |
| D | 2 | 250 | 188593 | 1114.78 | 703 | 685 | 168.6 |
| D | 7 | 38 | 110449 | 651.18 | 703 | 685 | 168.6 |
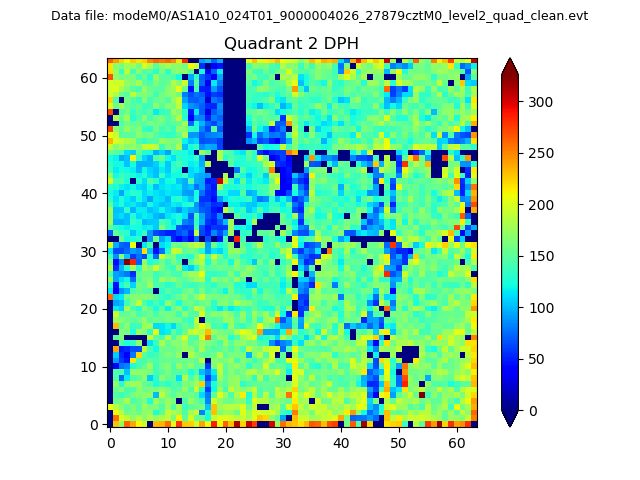
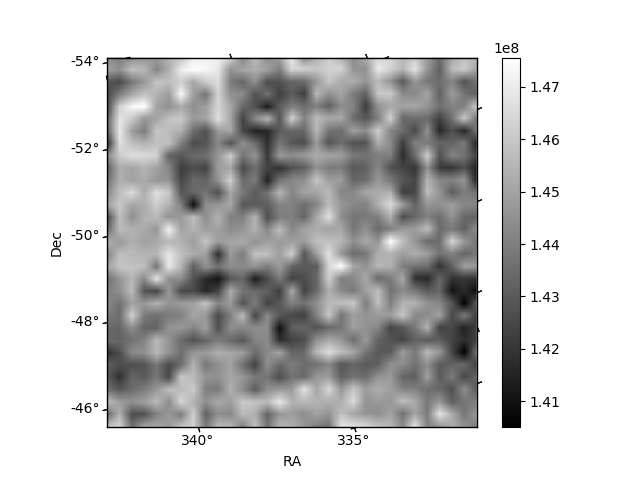
Histogram calculated using DETX and DETY for each event in the final _common_clean file
| Quadrant A |  |
 |
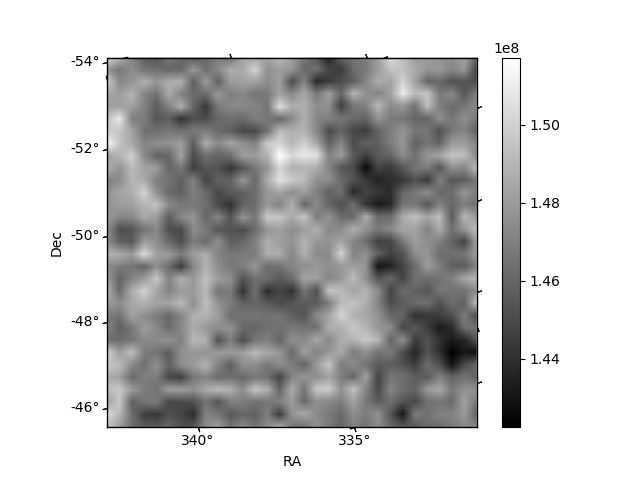
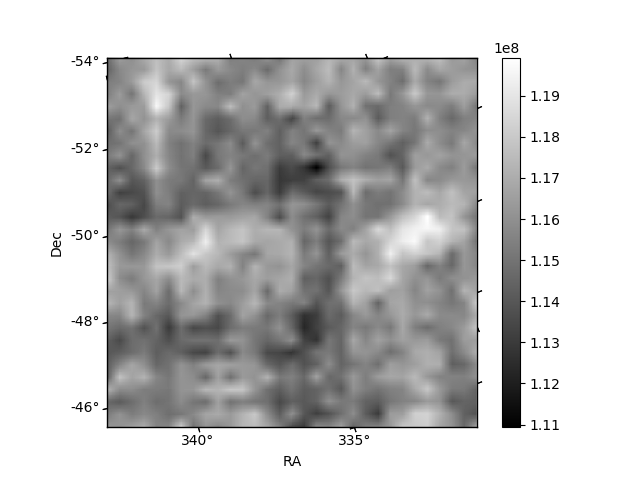
Quadrant B |
|---|---|---|---|
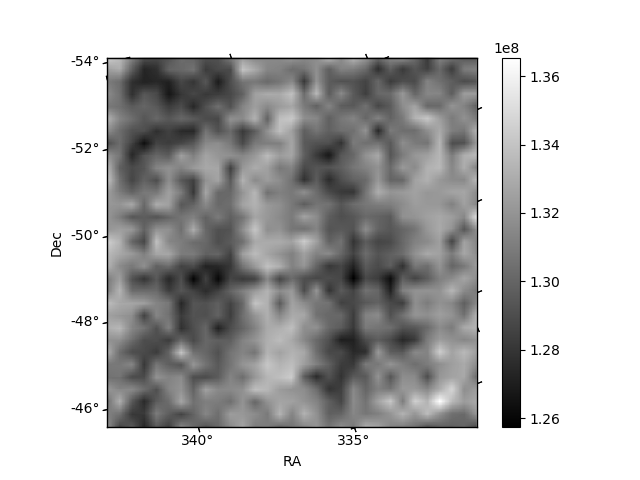
| Quadrant D | 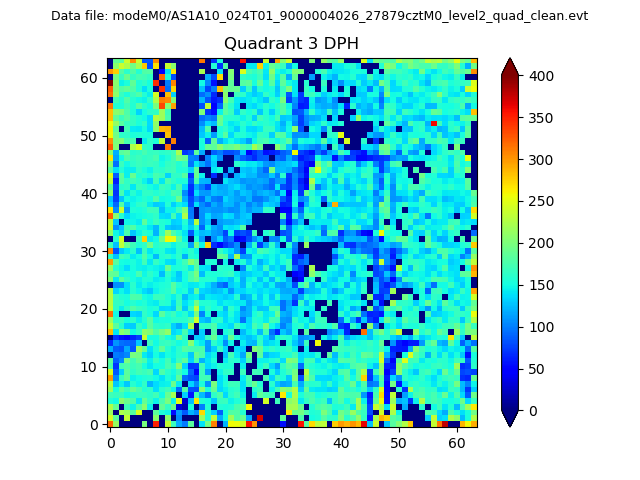 |
 |
Quadrant C |
| Plot type | Count rate plots | Images |
|---|---|---|
| Comparison with Poisson distribution Blue bars denote a histogram of data divided into 1 sec bins. Red curve is a Poisson curve with rate = median count rate of data. |
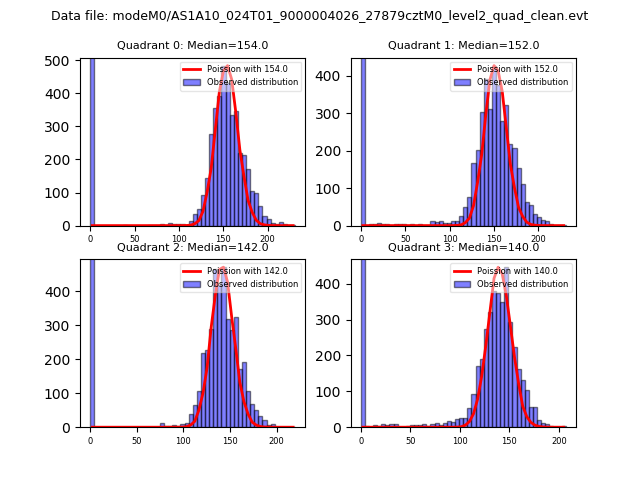 |
 |
| Quadrant-wise count rates Data is divided into 100 sec bins |
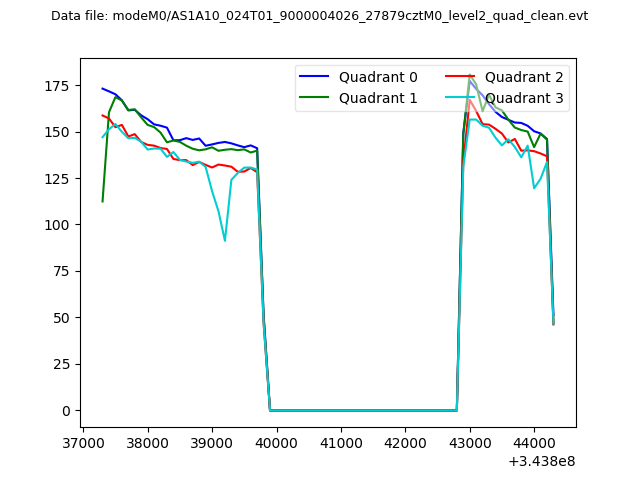 |
|
| Module-wise count rates for Quadrant A Data is divided into 100 sec bins |
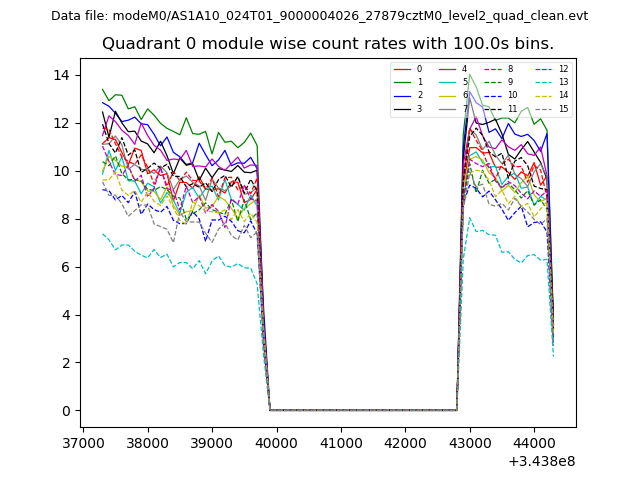 |
 |
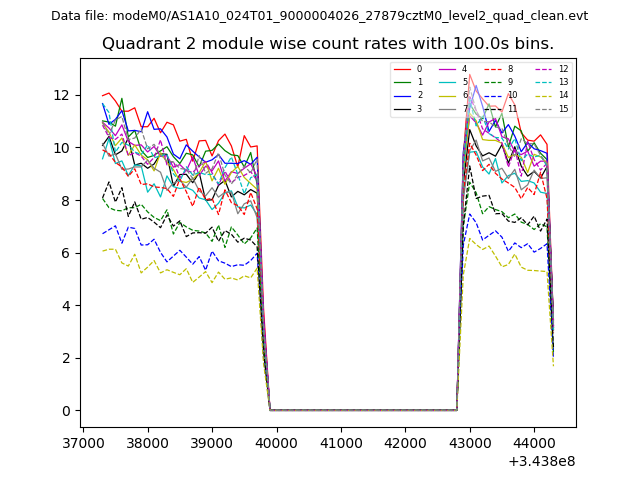
| Module-wise count rates for Quadrant B Data is divided into 100 sec bins |
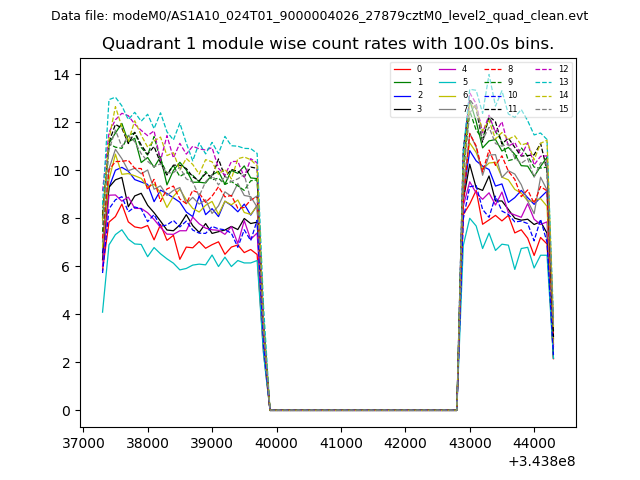 |
 |
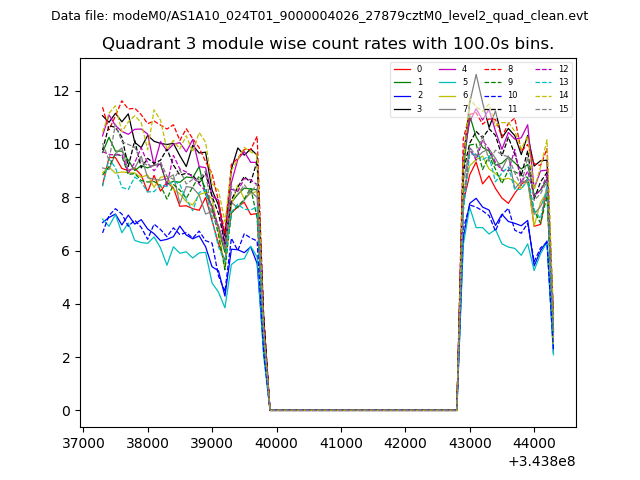
| Module-wise count rates for Quadrant C Data is divided into 100 sec bins |
 |
 |
| Module-wise count rates for Quadrant D Data is divided into 100 sec bins |
 |
 |
| Parameter | Plot |
|---|---|
| CZT HV Monitor | 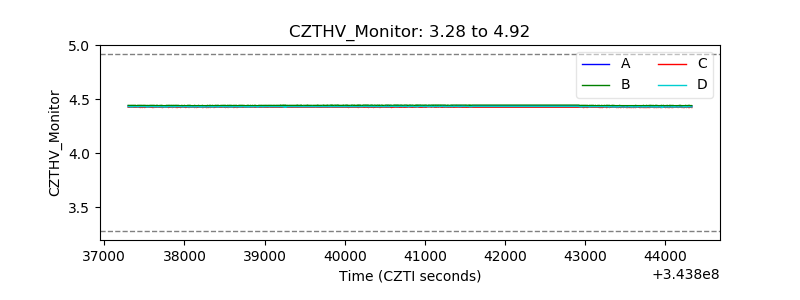 |
| D_VDD | 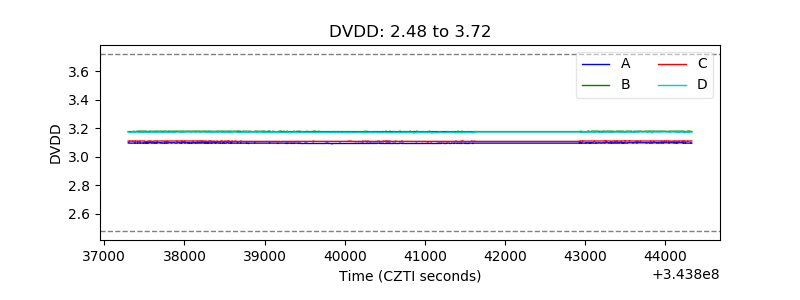 |
| Temperature 1 | 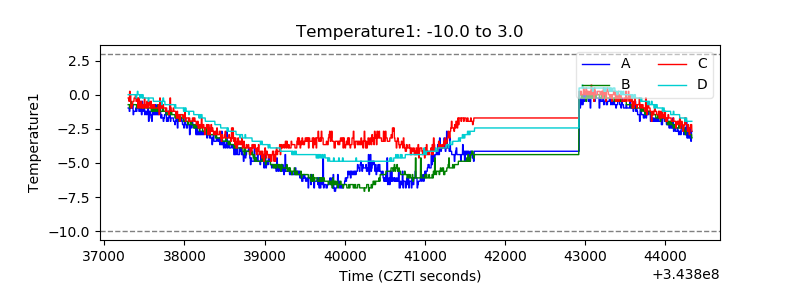 |
| Veto HV Monitor | 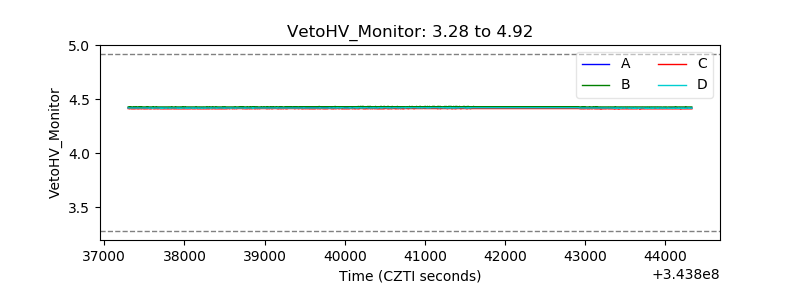 |
| Veto LLD | 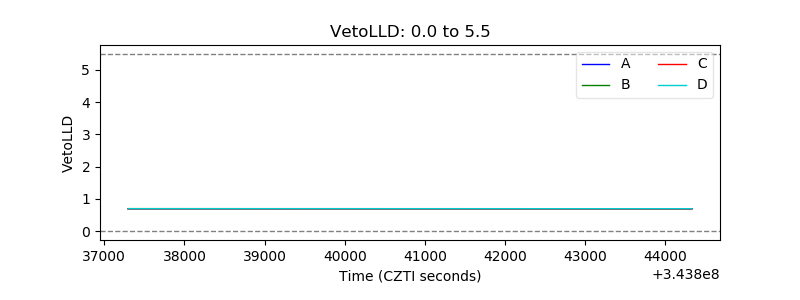 |
| Alpha Counter | 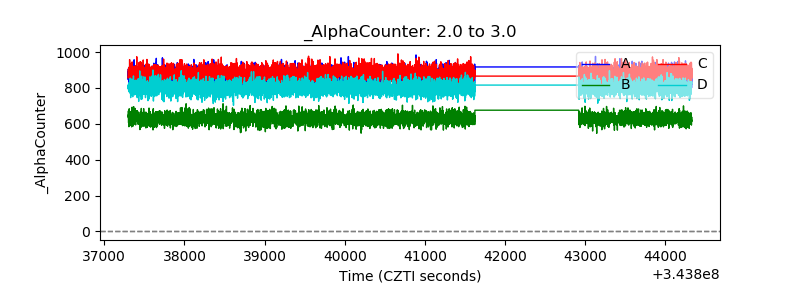 |
| _CPM_Rate | 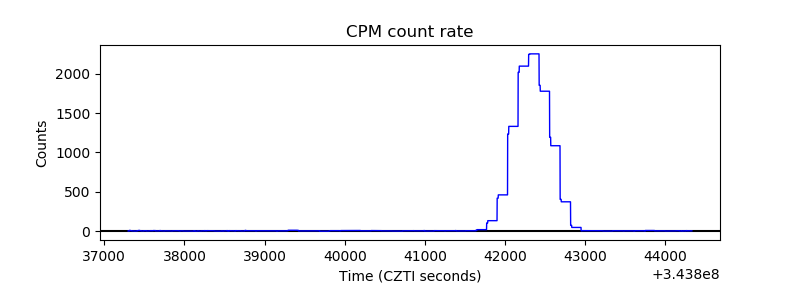 |
| CZT Counter |  |
| +2.5 Volts monitor |  |
| +5 Volts monitor | 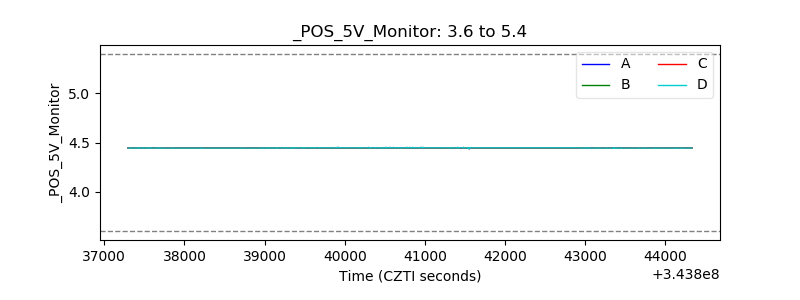 |
| _ROLL_ROT | 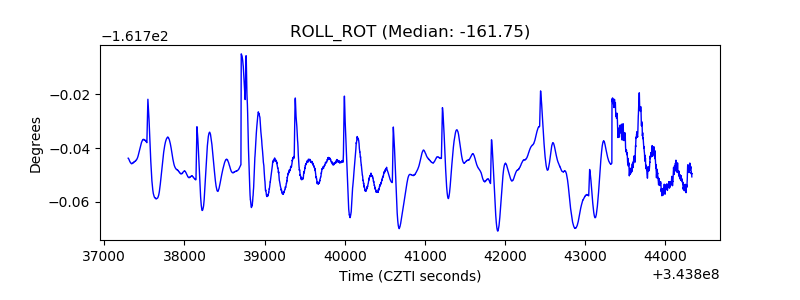 |
| _Roll_DEC | 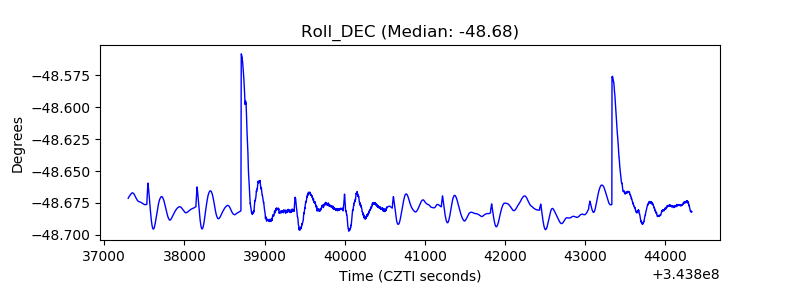 |
| _Roll_RA |  |
| Veto Counter | 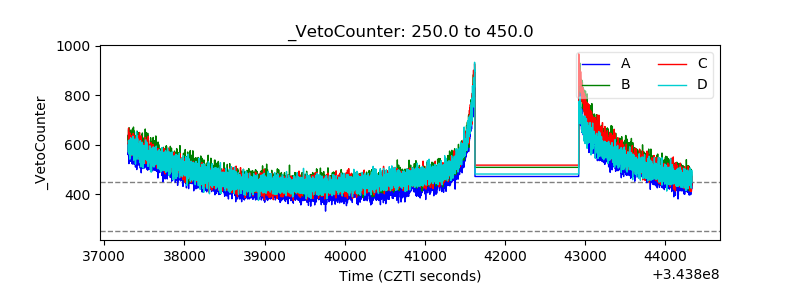 |