| Param | Original file | Final file |
|---|---|---|
| Filename | modeM0/AS1A10_024T01_9000004026_27880cztM0_level2.evt | modeM0/AS1A10_024T01_9000004026_27880cztM0_level2_quad_clean.evt |
| Size (bytes) | 482,019,840 | 98,616,960 |
| Size | 459.7 MB | 94.0 MB |
| Events in quadrant A | 3,228,702 | 664,211 |
| Events in quadrant B | 3,775,511 | 659,526 |
| Events in quadrant C | 3,249,223 | 621,433 |
| Events in quadrant D | 3,917,009 | 601,825 |
| Mode M0 | |||
|---|---|---|---|
| Quadrant | BADHDUFLAG | Total packets | Discarded packets |
| A | 0 | 13615 | 0 |
| B | 0 | 15363 | 0 |
| C | 0 | 13583 | 0 |
| D | 0 | 15814 | 0 |
| Mode M9 | |||
|---|---|---|---|
| Quadrant | BADHDUFLAG | Total packets | Discarded packets |
| A | 0 | 12 | 0 |
| B | 0 | 12 | 0 |
| C | 0 | 12 | 0 |
| D | 0 | 12 | 0 |
| Quadrant | Total seconds | Saturated seconds | Saturation percentage |
|---|---|---|---|
| A | 6297 | 39 | 0.619343% |
| B | 6297 | 160 | 2.540892% |
| C | 6297 | 86 | 1.365730% |
| D | 6297 | 186 | 2.953788% |
Noise dominated data is calculated using 1-second bins in cleaned event files. If a bin has >2000 counts, and if more than 50% of those come from <1% of pixels, then it is considered to be noise-dominated and hence unusable.
| Quadrant | # 1 sec bins | Bins with >0 counts | Bins with >2000 counts | High rate bins dominated by noise | Noise dominated (total time) | Noise dominated (detector-on time) | Marked lightcurve |
|---|---|---|---|---|---|---|---|
| A | 7497 | 6298 | 1 | 1 | 0.01% | 0.02% | 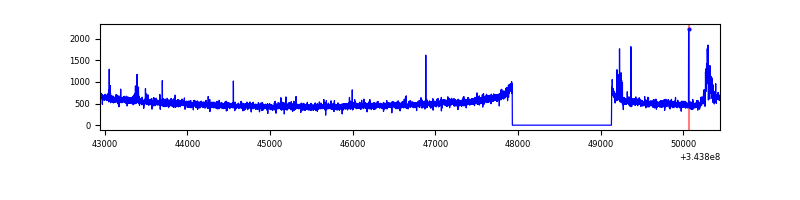 |
| B | 7497 | 6298 | 73 | 73 | 0.97% | 1.16% | 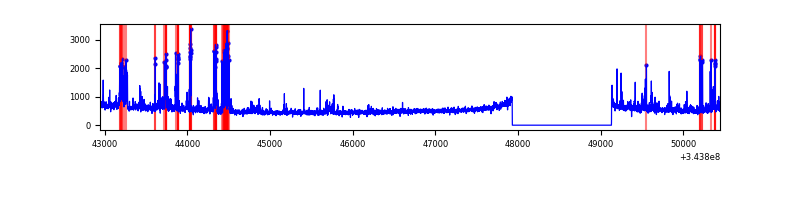 |
| C | 7497 | 6298 | 3 | 3 | 0.04% | 0.05% | 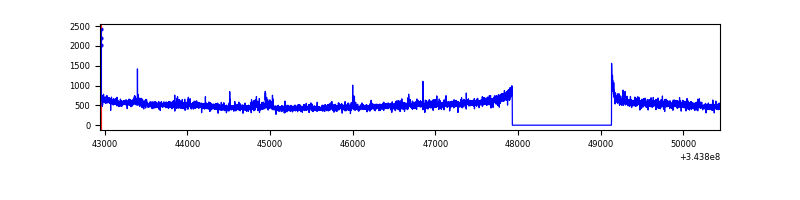 |
| D | 7497 | 6298 | 167 | 167 | 2.23% | 2.65% | 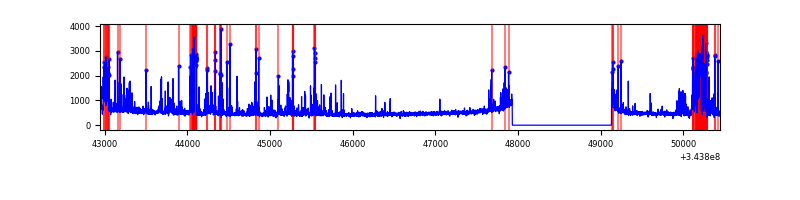 |
Top three noisy pixels from each quadrant. If the there are fewer than three noisy pixels in the level2.evt file, extra rows are filled as -1
| Pixel properties | Quadrant properties | ||||||
|---|---|---|---|---|---|---|---|
| Quadrant | DetID | PixID | Counts | Sigma | Mean | Median | Sigma |
| A | 15 | 174 | 78005 | 476.43 | 808 | 794 | 162.1 |
| A | 13 | 248 | 26699 | 159.85 | 808 | 794 | 162.1 |
| A | 13 | 254 | 11612 | 66.75 | 808 | 794 | 162.1 |
| B | 5 | 172 | 238858 | 1585.66 | 800 | 783 | 150.1 |
| B | 0 | 190 | 160882 | 1066.31 | 800 | 783 | 150.1 |
| B | 0 | 229 | 66791 | 439.64 | 800 | 783 | 150.1 |
| C | 3 | 233 | 168457 | 961.2 | 754 | 757 | 174.5 |
| C | 14 | 238 | 123485 | 703.43 | 754 | 757 | 174.5 |
| C | 0 | 207 | 11696 | 62.7 | 754 | 757 | 174.5 |
| D | 1 | 52 | 506279 | 2831.12 | 755 | 734 | 178.6 |
| D | 2 | 250 | 133101 | 741.27 | 755 | 734 | 178.6 |
| D | 7 | 69 | 128940 | 717.97 | 755 | 734 | 178.6 |
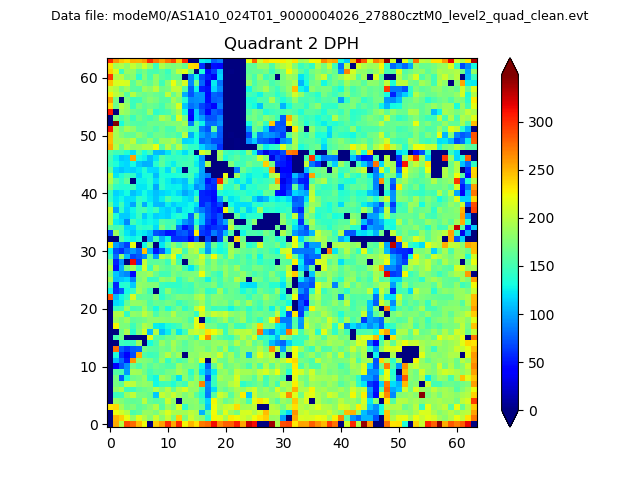
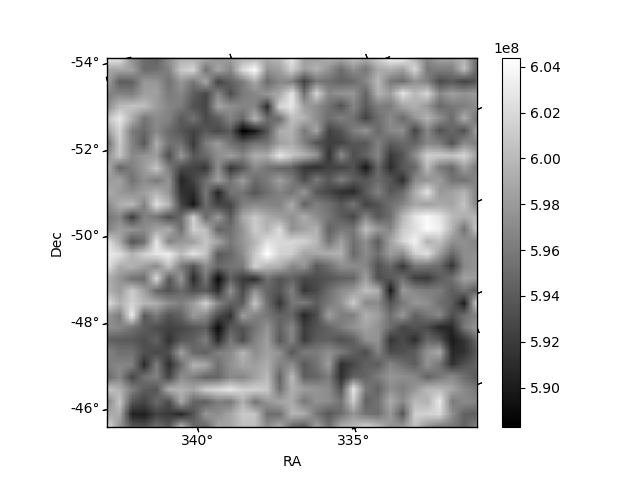
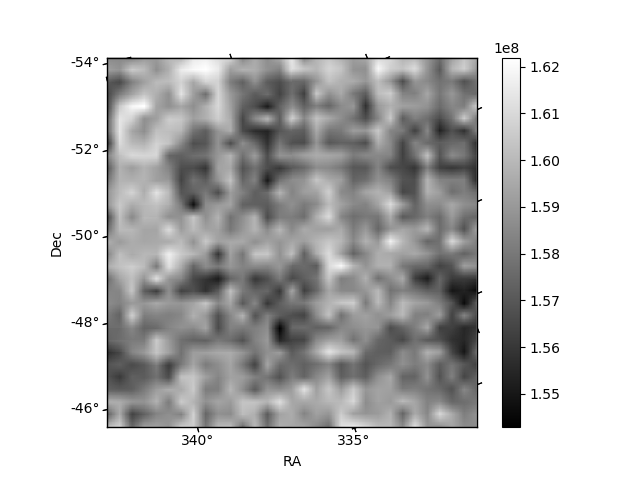
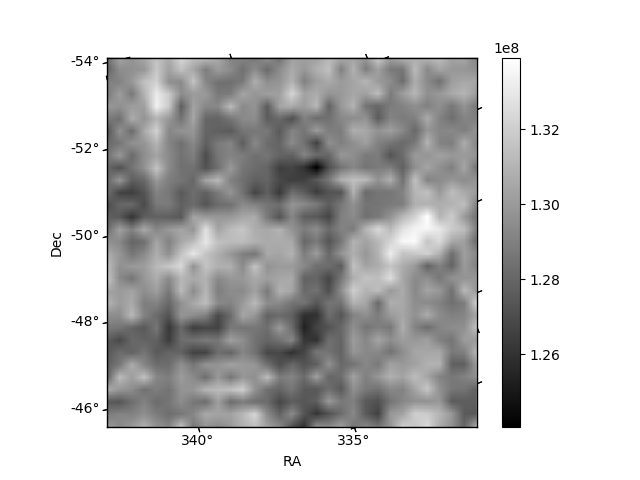
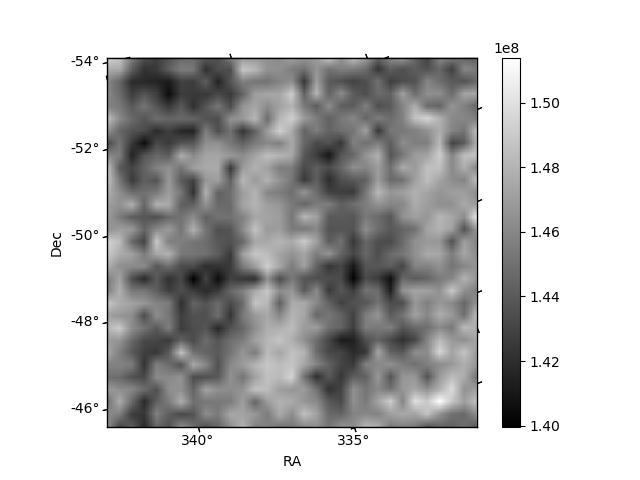
Histogram calculated using DETX and DETY for each event in the final _common_clean file
| Quadrant A | 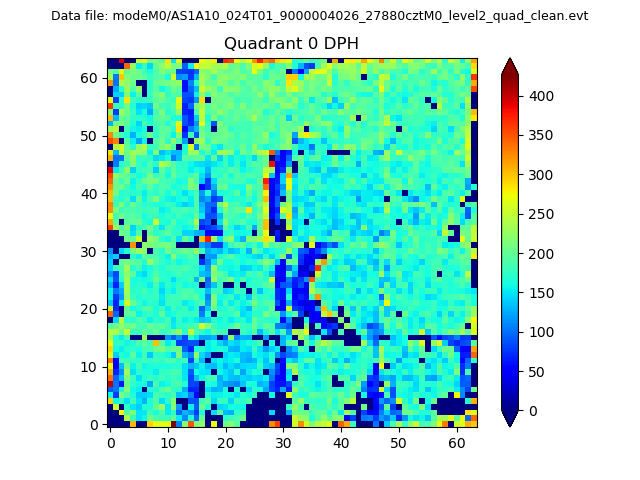 |
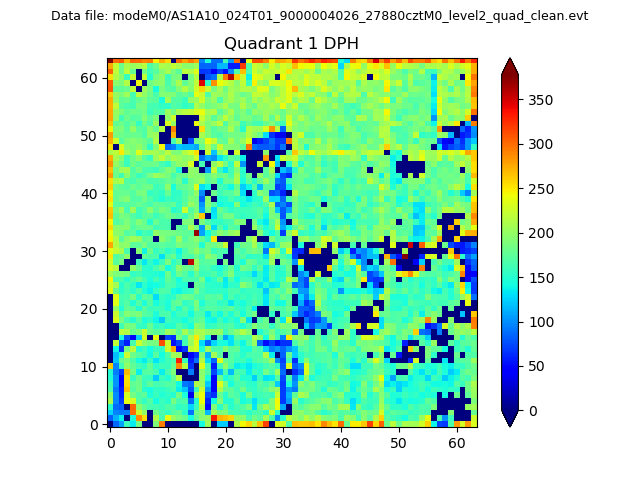 |
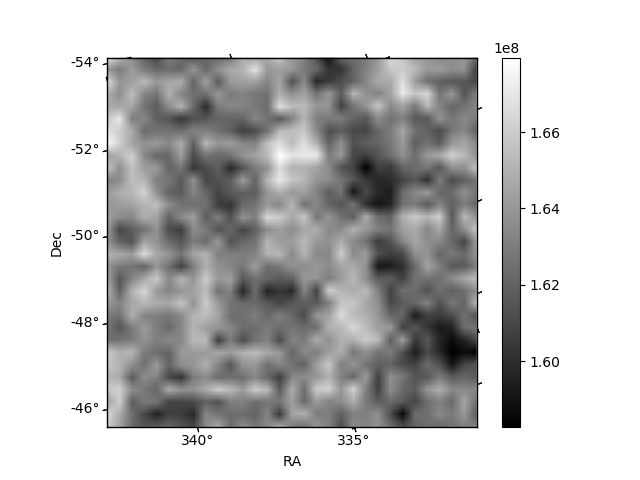
Quadrant B |
|---|---|---|---|
| Quadrant D | 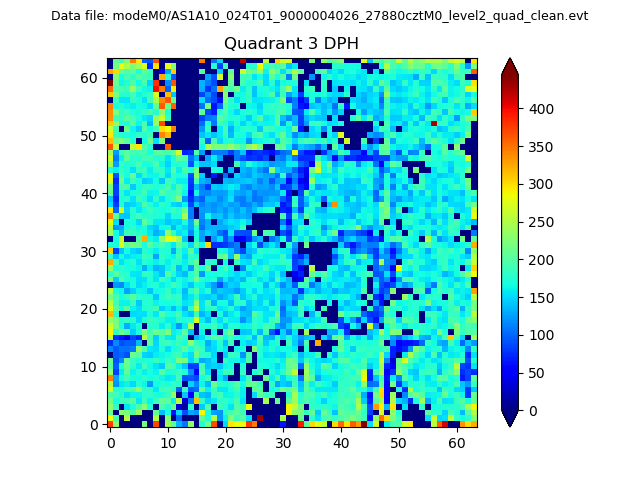 |
 |
Quadrant C |
| Plot type | Count rate plots | Images |
|---|---|---|
| Comparison with Poisson distribution Blue bars denote a histogram of data divided into 1 sec bins. Red curve is a Poisson curve with rate = median count rate of data. |
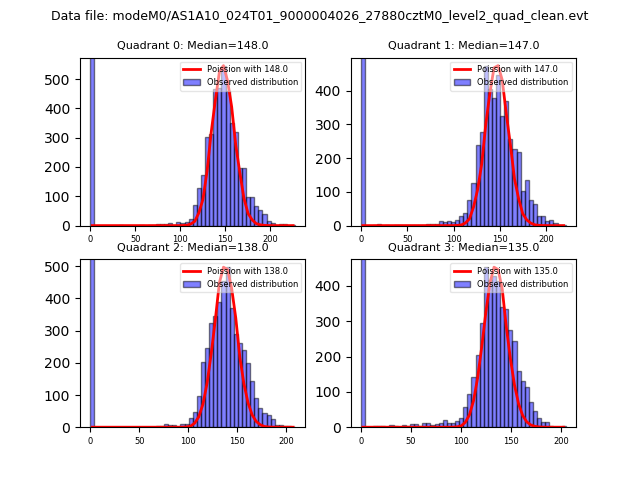 |
 |
| Quadrant-wise count rates Data is divided into 100 sec bins |
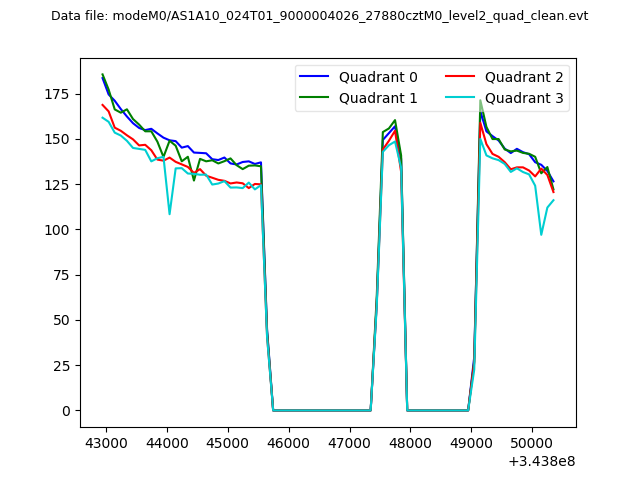 |
|
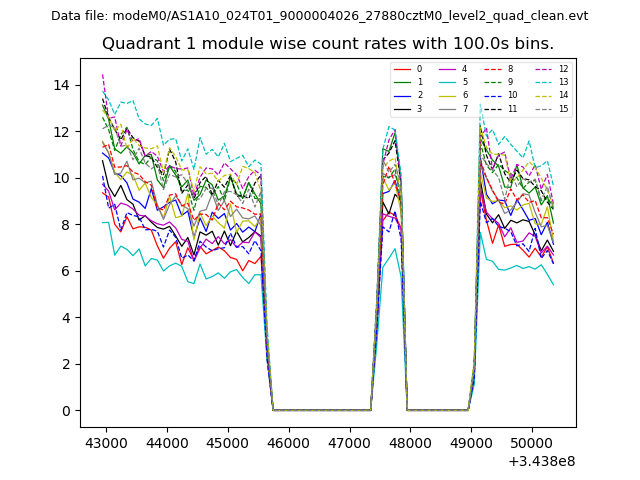
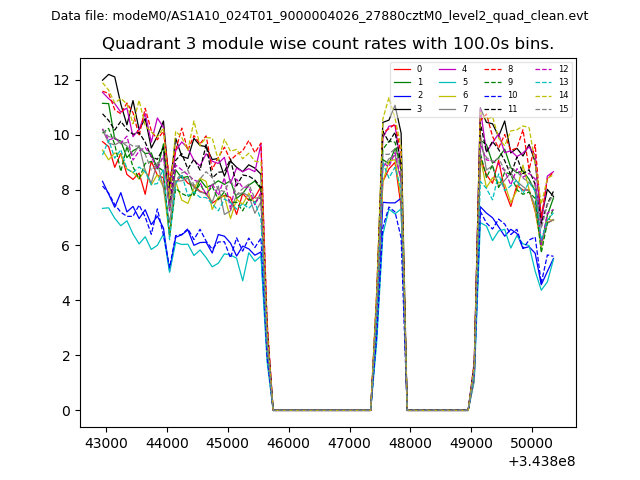
| Module-wise count rates for Quadrant A Data is divided into 100 sec bins |
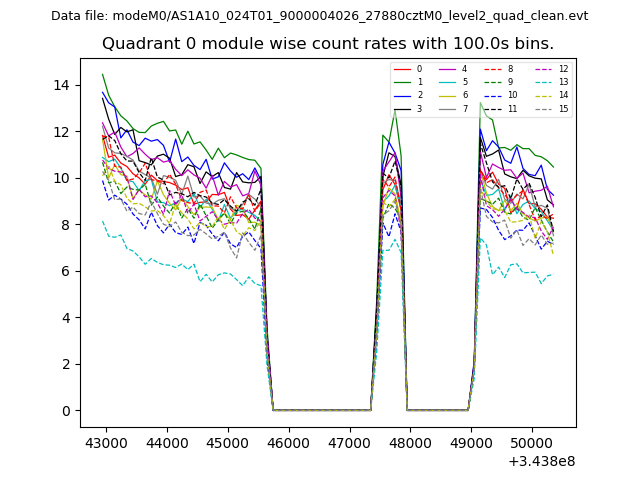 |
 |
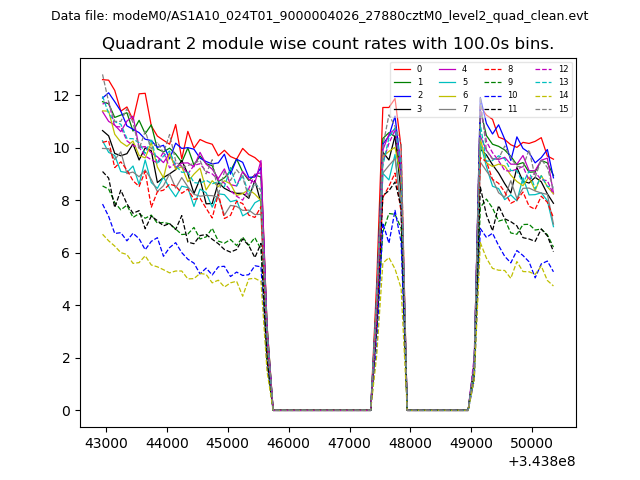
| Module-wise count rates for Quadrant B Data is divided into 100 sec bins |
 |
 |
| Module-wise count rates for Quadrant C Data is divided into 100 sec bins |
 |
 |
| Module-wise count rates for Quadrant D Data is divided into 100 sec bins |
 |
 |
| Parameter | Plot |
|---|---|
| CZT HV Monitor | 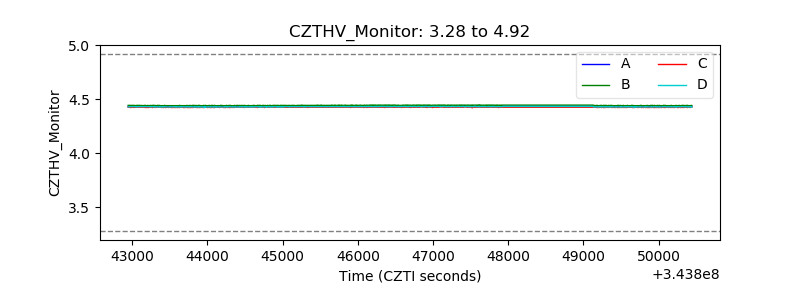 |
| D_VDD | 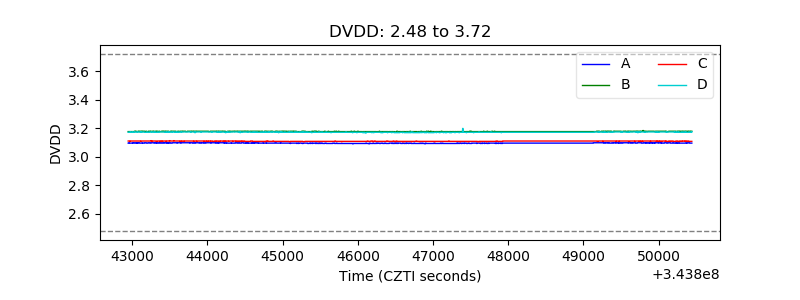 |
| Temperature 1 | 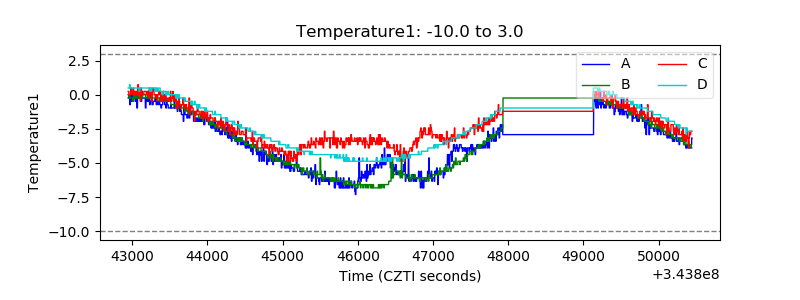 |
| Veto HV Monitor | 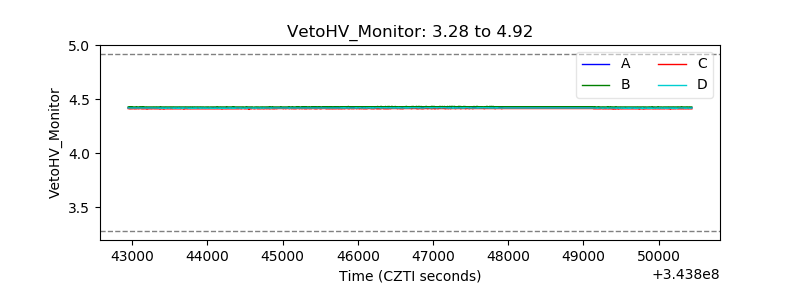 |
| Veto LLD | 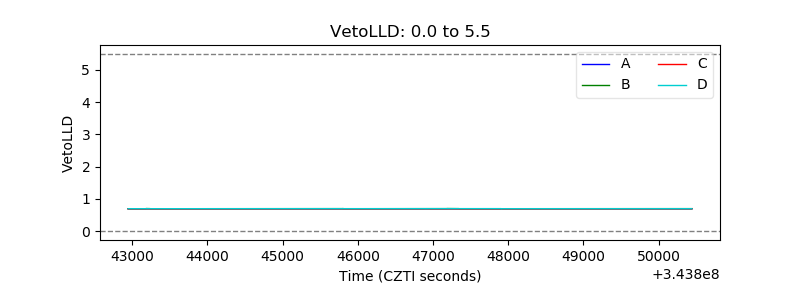 |
| Alpha Counter | 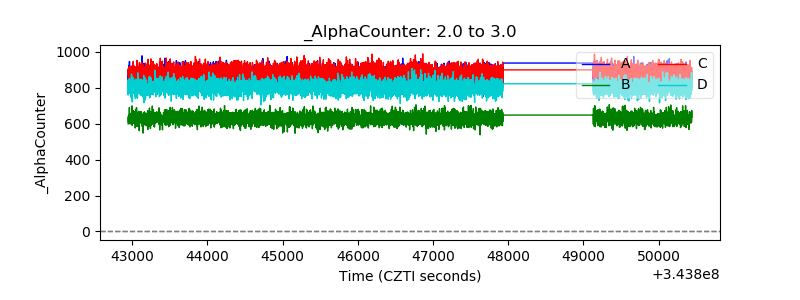 |
| _CPM_Rate | 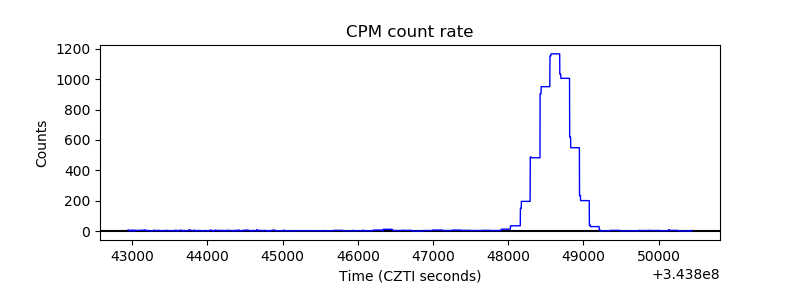 |
| CZT Counter | 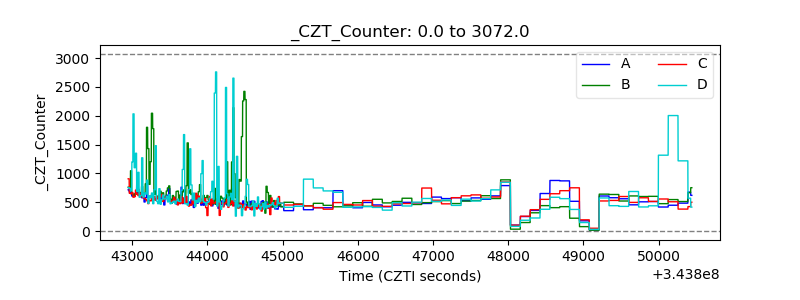 |
| +2.5 Volts monitor |  |
| +5 Volts monitor |  |
| _ROLL_ROT |  |
| _Roll_DEC | 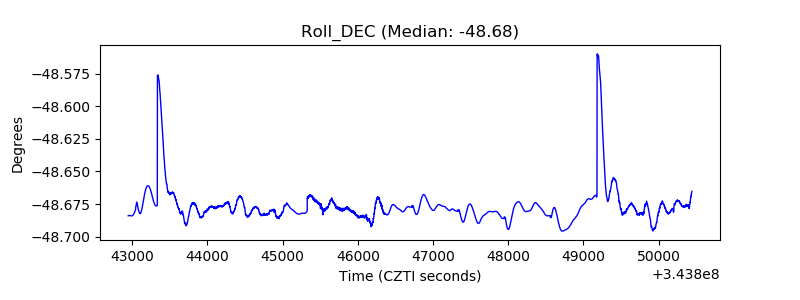 |
| _Roll_RA | 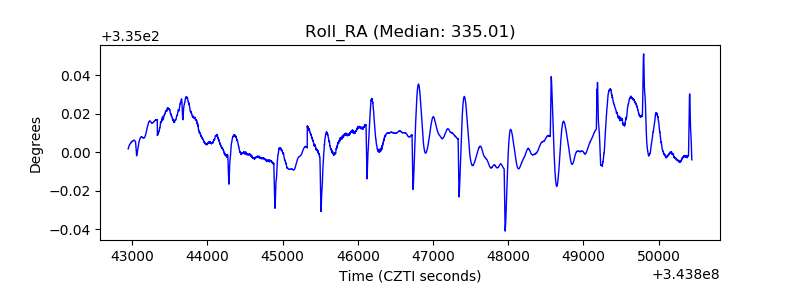 |
| Veto Counter | 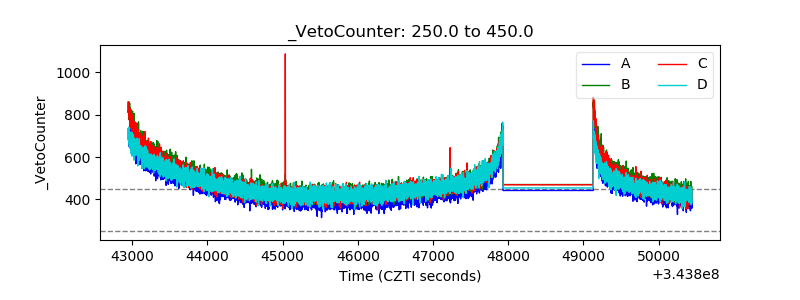 |