| Param | Original file | Final file |
|---|---|---|
| Filename | modeM0/AS1A10_024T01_9000004026_27881cztM0_level2.evt | modeM0/AS1A10_024T01_9000004026_27881cztM0_level2_quad_clean.evt |
| Size (bytes) | 541,952,640 | 94,417,920 |
| Size | 516.8 MB | 90.0 MB |
| Events in quadrant A | 3,222,573 | 630,933 |
| Events in quadrant B | 3,703,231 | 625,162 |
| Events in quadrant C | 3,265,904 | 597,589 |
| Events in quadrant D | 5,787,537 | 559,171 |
| Mode M0 | |||
|---|---|---|---|
| Quadrant | BADHDUFLAG | Total packets | Discarded packets |
| A | 0 | 13751 | 0 |
| B | 0 | 15148 | 0 |
| C | 0 | 13691 | 0 |
| D | 0 | 21397 | 0 |
| Mode M9 | |||
|---|---|---|---|
| Quadrant | BADHDUFLAG | Total packets | Discarded packets |
| A | 0 | 9 | 0 |
| B | 0 | 9 | 0 |
| C | 0 | 9 | 0 |
| D | 0 | 9 | 0 |
| Quadrant | Total seconds | Saturated seconds | Saturation percentage |
|---|---|---|---|
| A | 6401 | 64 | 0.999844% |
| B | 6402 | 172 | 2.686660% |
| C | 6402 | 93 | 1.452671% |
| D | 6402 | 969 | 15.135895% |
Noise dominated data is calculated using 1-second bins in cleaned event files. If a bin has >2000 counts, and if more than 50% of those come from <1% of pixels, then it is considered to be noise-dominated and hence unusable.
| Quadrant | # 1 sec bins | Bins with >0 counts | Bins with >2000 counts | High rate bins dominated by noise | Noise dominated (total time) | Noise dominated (detector-on time) | Marked lightcurve |
|---|---|---|---|---|---|---|---|
| A | 7271 | 6402 | 20 | 20 | 0.28% | 0.31% | 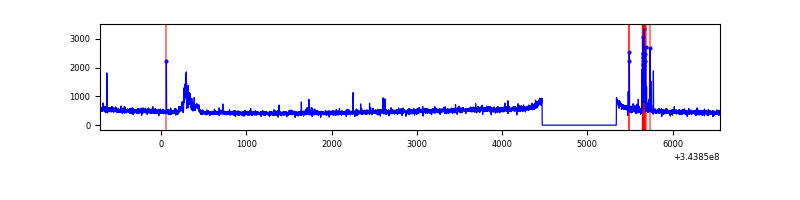 |
| B | 7272 | 6403 | 64 | 64 | 0.88% | 1.00% | 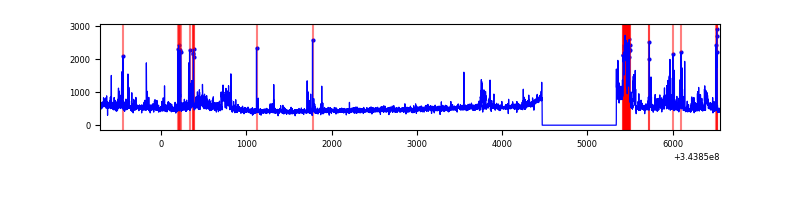 |
| C | 7272 | 6402 | 1 | 1 | 0.01% | 0.02% | 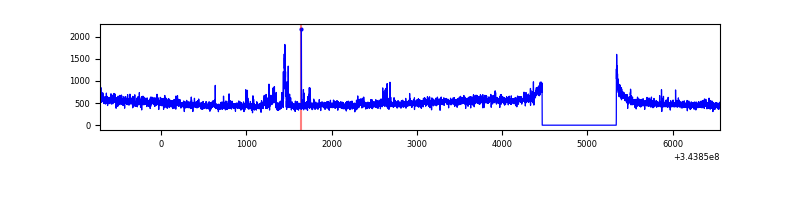 |
| D | 7272 | 6403 | 940 | 940 | 12.93% | 14.68% | 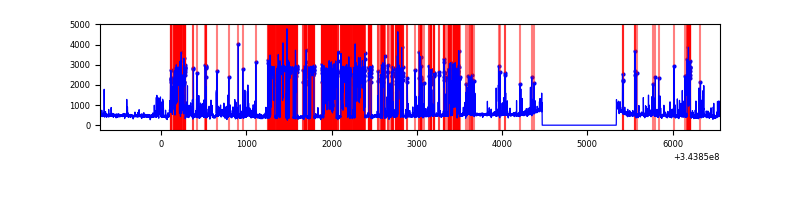 |
Top three noisy pixels from each quadrant. If the there are fewer than three noisy pixels in the level2.evt file, extra rows are filled as -1
| Pixel properties | Quadrant properties | ||||||
|---|---|---|---|---|---|---|---|
| Quadrant | DetID | PixID | Counts | Sigma | Mean | Median | Sigma |
| A | 15 | 174 | 82184 | 513.52 | 788 | 775 | 158.5 |
| A | 0 | 13 | 80303 | 501.66 | 788 | 775 | 158.5 |
| A | 13 | 254 | 12266 | 72.48 | 788 | 775 | 158.5 |
| B | 5 | 172 | 173374 | 1169.13 | 780 | 762 | 147.6 |
| B | 0 | 190 | 117506 | 790.73 | 780 | 762 | 147.6 |
| B | 0 | 230 | 91545 | 614.89 | 780 | 762 | 147.6 |
| C | 3 | 233 | 188893 | 1091.4 | 741 | 747 | 172.4 |
| C | 14 | 238 | 121229 | 698.9 | 741 | 747 | 172.4 |
| C | 15 | 208 | 55924 | 320.07 | 741 | 747 | 172.4 |
| D | 1 | 52 | 2826686 | 16724.13 | 700 | 680 | 169.0 |
| D | 7 | 69 | 82581 | 484.69 | 700 | 680 | 169.0 |
| D | 2 | 250 | 74713 | 438.12 | 700 | 680 | 169.0 |
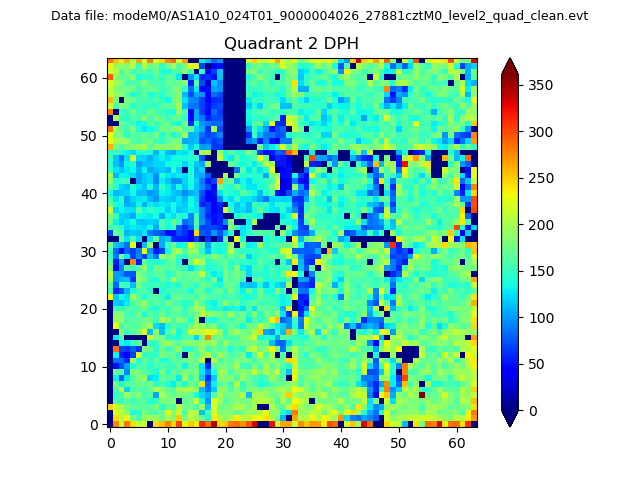
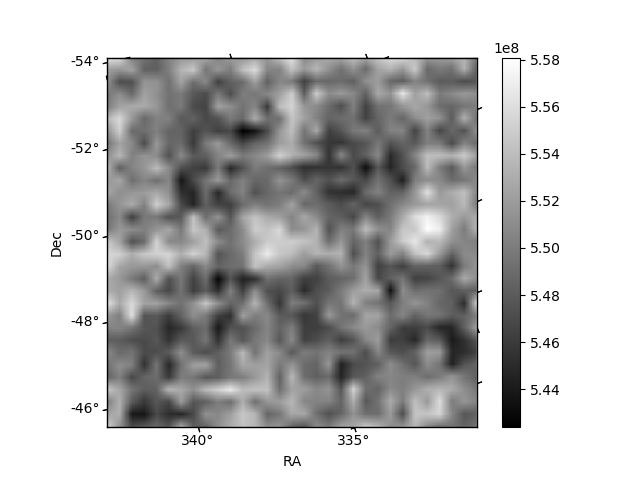
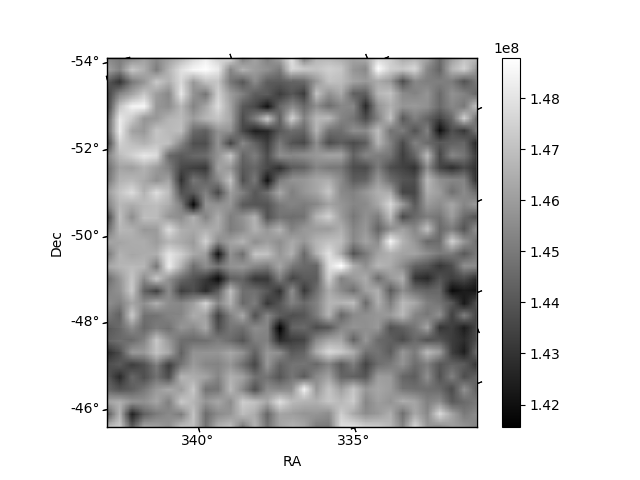
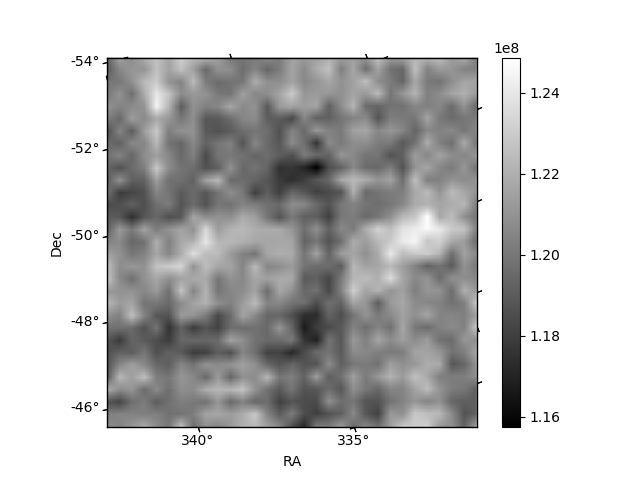
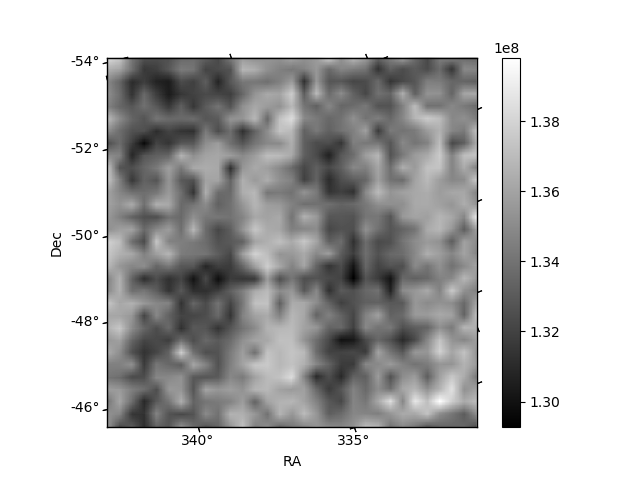
Histogram calculated using DETX and DETY for each event in the final _common_clean file
| Quadrant A | 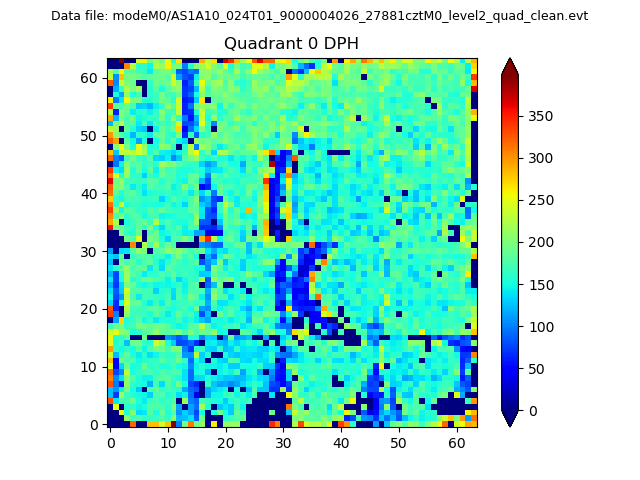 |
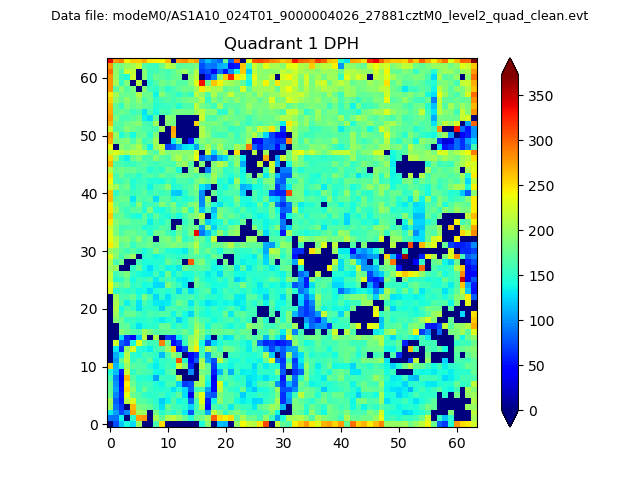 |
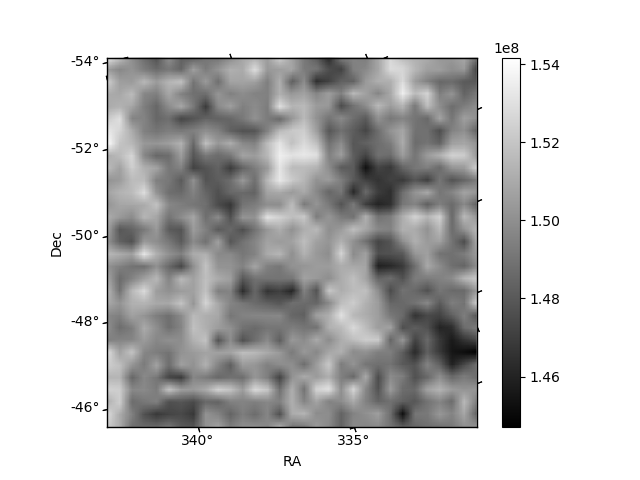
Quadrant B |
|---|---|---|---|
| Quadrant D | 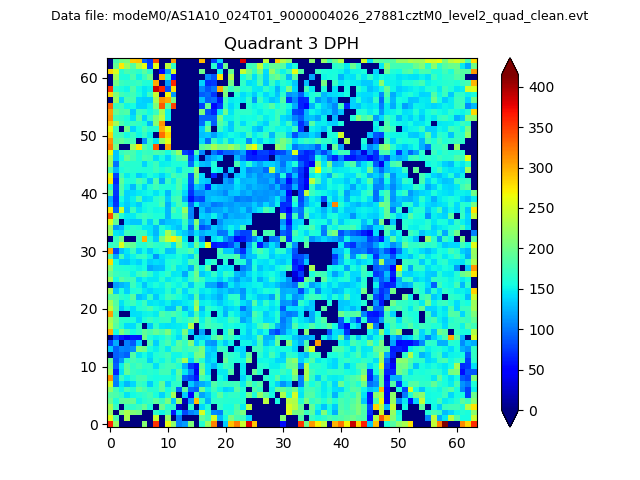 |
 |
Quadrant C |
| Plot type | Count rate plots | Images |
|---|---|---|
| Comparison with Poisson distribution Blue bars denote a histogram of data divided into 1 sec bins. Red curve is a Poisson curve with rate = median count rate of data. |
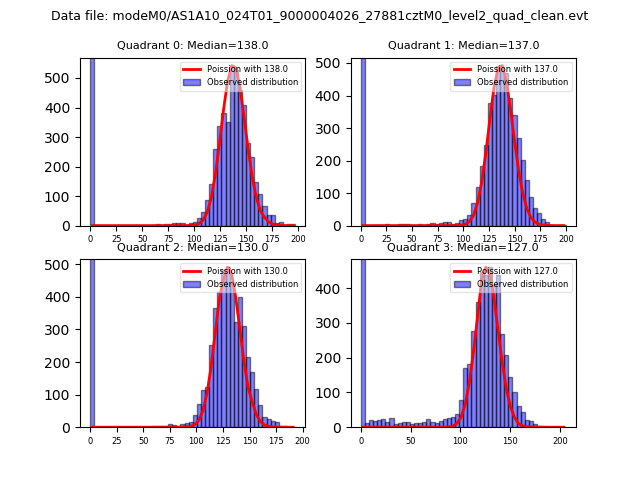 |
 |
| Quadrant-wise count rates Data is divided into 100 sec bins |
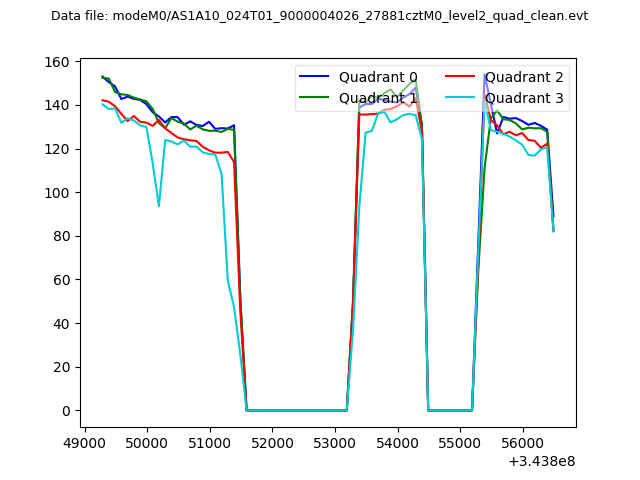 |
|
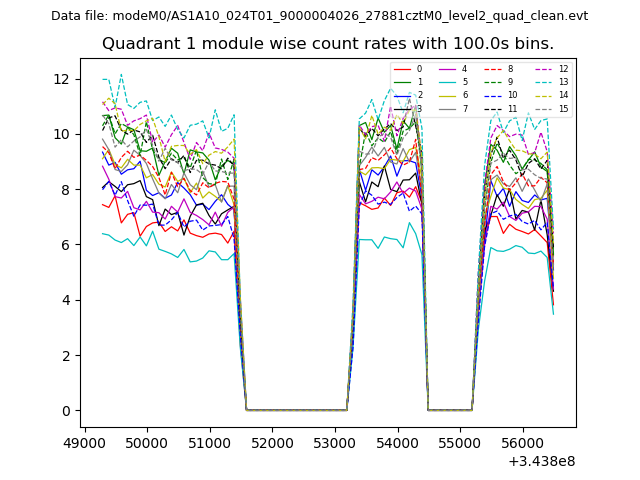
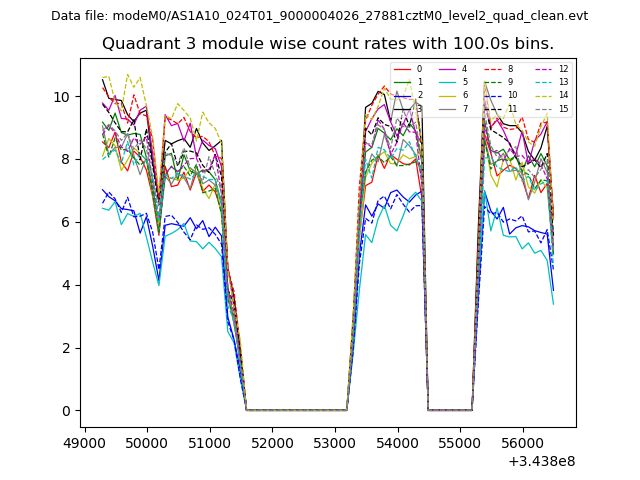
| Module-wise count rates for Quadrant A Data is divided into 100 sec bins |
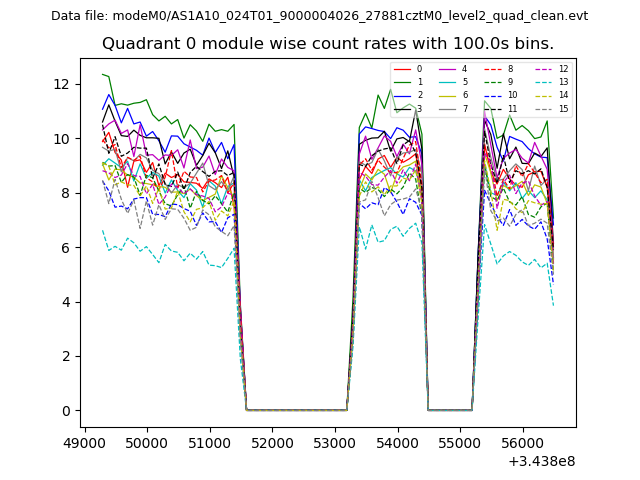 |
 |
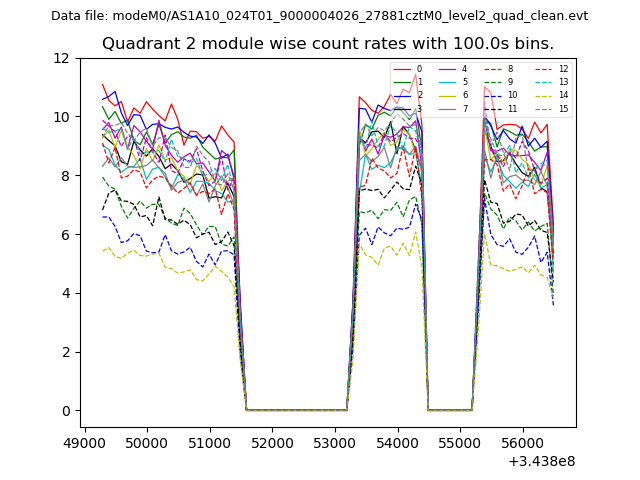
| Module-wise count rates for Quadrant B Data is divided into 100 sec bins |
 |
 |
| Module-wise count rates for Quadrant C Data is divided into 100 sec bins |
 |
 |
| Module-wise count rates for Quadrant D Data is divided into 100 sec bins |
 |
 |
| Parameter | Plot |
|---|---|
| CZT HV Monitor | 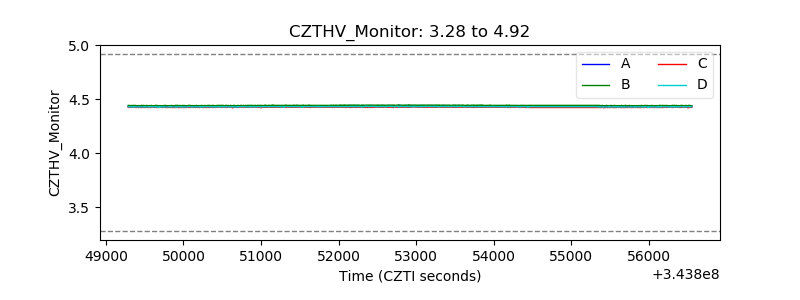 |
| D_VDD | 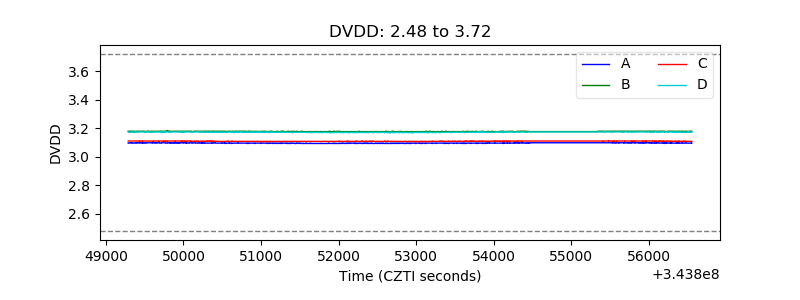 |
| Temperature 1 |  |
| Veto HV Monitor | 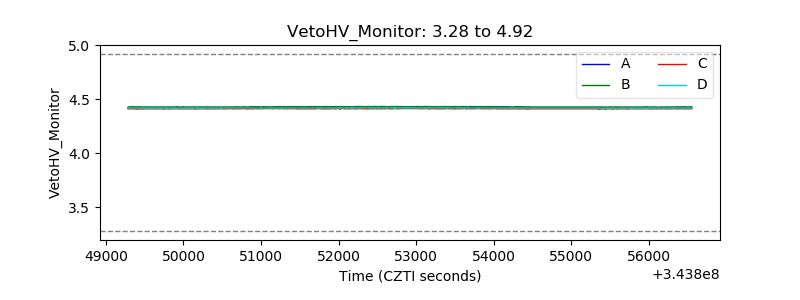 |
| Veto LLD | 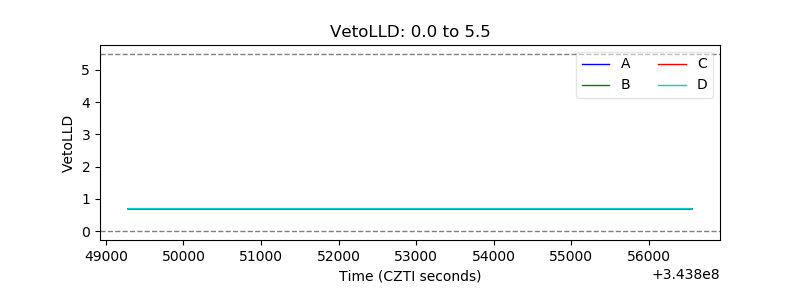 |
| Alpha Counter | 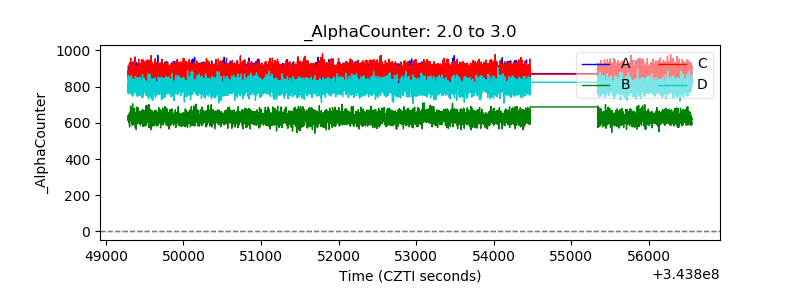 |
| _CPM_Rate | 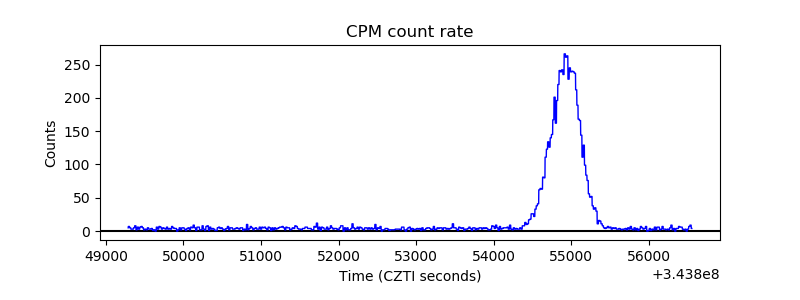 |
| CZT Counter | 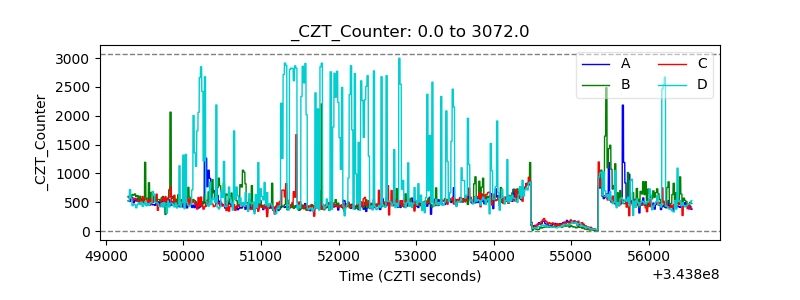 |
| +2.5 Volts monitor |  |
| +5 Volts monitor |  |
| _ROLL_ROT | 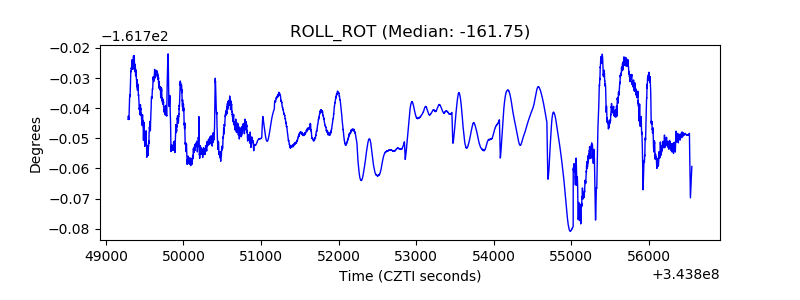 |
| _Roll_DEC | 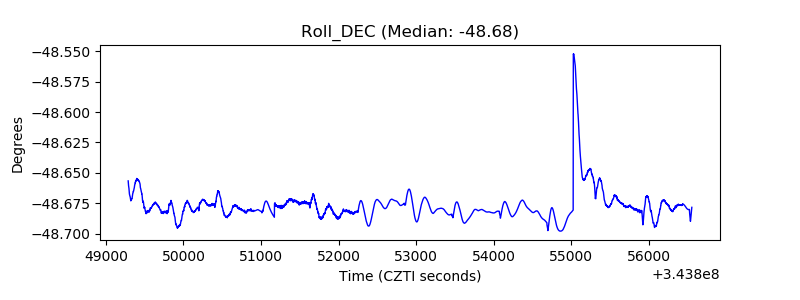 |
| _Roll_RA | 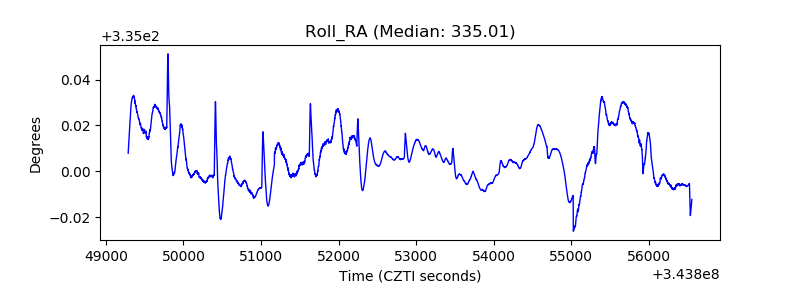 |
| Veto Counter | 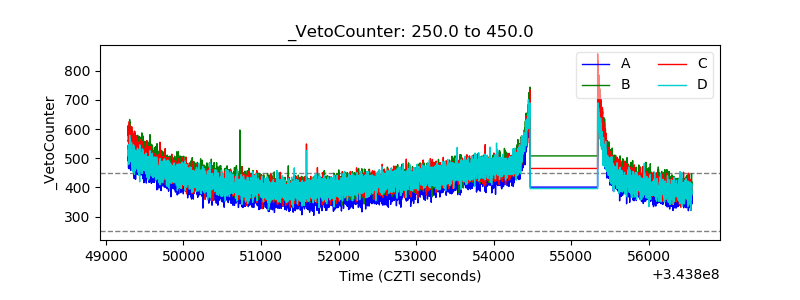 |