| Param | Original file | Final file |
|---|---|---|
| Filename | modeM0/AS1A10_024T01_9000004026_27882cztM0_level2.evt | modeM0/AS1A10_024T01_9000004026_27882cztM0_level2_quad_clean.evt |
| Size (bytes) | 95,376,960 | 22,613,760 |
| Size | 91.0 MB | 21.6 MB |
| Events in quadrant A | 628,394 | 155,208 |
| Events in quadrant B | 865,136 | 149,618 |
| Events in quadrant C | 568,614 | 147,418 |
| Events in quadrant D | 744,652 | 144,235 |
| Mode M0 | |||
|---|---|---|---|
| Quadrant | BADHDUFLAG | Total packets | Discarded packets |
| A | 0 | 2643 | 0 |
| B | 0 | 3354 | 0 |
| C | 0 | 2418 | 0 |
| D | 0 | 2975 | 0 |
| Quadrant | Total seconds | Saturated seconds | Saturation percentage |
|---|---|---|---|
| A | 1162 | 24 | 2.065404% |
| B | 1162 | 79 | 6.798623% |
| C | 1162 | 6 | 0.516351% |
| D | 1163 | 36 | 3.095443% |
Noise dominated data is calculated using 1-second bins in cleaned event files. If a bin has >2000 counts, and if more than 50% of those come from <1% of pixels, then it is considered to be noise-dominated and hence unusable.
| Quadrant | # 1 sec bins | Bins with >0 counts | Bins with >2000 counts | High rate bins dominated by noise | Noise dominated (total time) | Noise dominated (detector-on time) | Marked lightcurve |
|---|---|---|---|---|---|---|---|
| A | 1162 | 1162 | 19 | 19 | 1.64% | 1.64% | 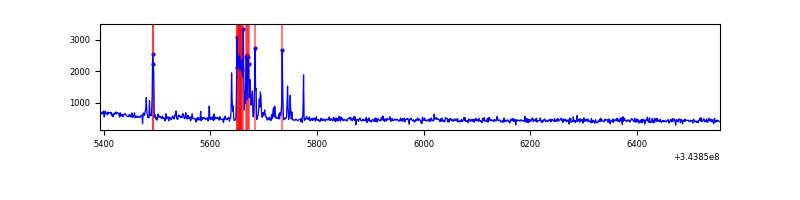 |
| B | 1162 | 1162 | 51 | 51 | 4.39% | 4.39% | 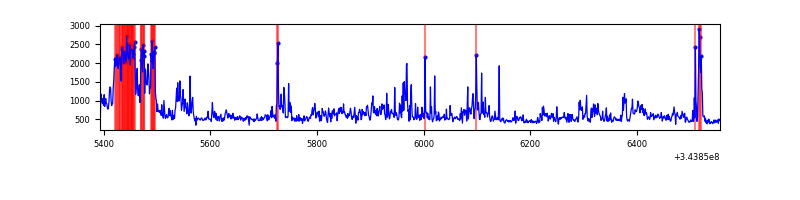 |
| C | 1162 | 1162 | 0 | 0 | 0.00% | 0.00% | 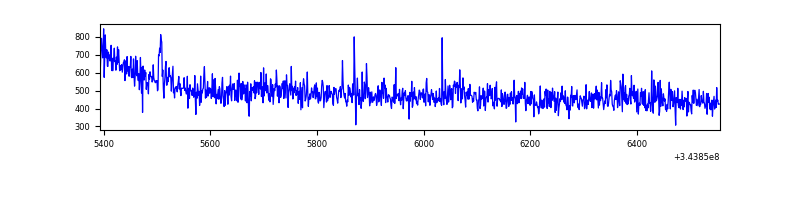 |
| D | 1163 | 1163 | 31 | 31 | 2.67% | 2.67% | 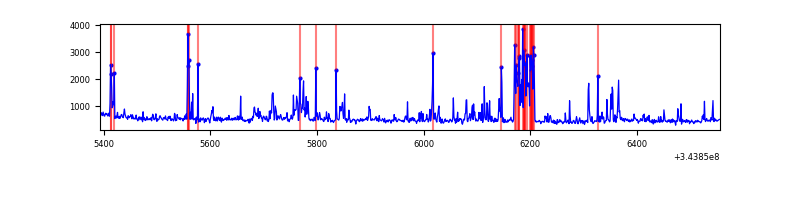 |
Top three noisy pixels from each quadrant. If the there are fewer than three noisy pixels in the level2.evt file, extra rows are filled as -1
| Pixel properties | Quadrant properties | ||||||
|---|---|---|---|---|---|---|---|
| Quadrant | DetID | PixID | Counts | Sigma | Mean | Median | Sigma |
| A | 0 | 13 | 79234 | 2609.8 | 141 | 138 | 30.3 |
| A | 13 | 254 | 2597 | 81.14 | 141 | 138 | 30.3 |
| A | 15 | 174 | 2351 | 73.02 | 141 | 138 | 30.3 |
| B | 5 | 172 | 132879 | 4664.6 | 136 | 133 | 28.5 |
| B | 0 | 230 | 56403 | 1977.29 | 136 | 133 | 28.5 |
| B | 0 | 190 | 40125 | 1405.29 | 136 | 133 | 28.5 |
| C | 3 | 233 | 28967 | 883.84 | 131 | 131 | 32.6 |
| C | 14 | 238 | 20990 | 639.34 | 131 | 131 | 32.6 |
| C | 8 | 208 | 3566 | 105.28 | 131 | 131 | 32.6 |
| D | 1 | 52 | 83294 | 2423.81 | 132 | 127 | 34.3 |
| D | 7 | 69 | 44359 | 1289.09 | 132 | 127 | 34.3 |
| D | 13 | 104 | 31633 | 918.21 | 132 | 127 | 34.3 |
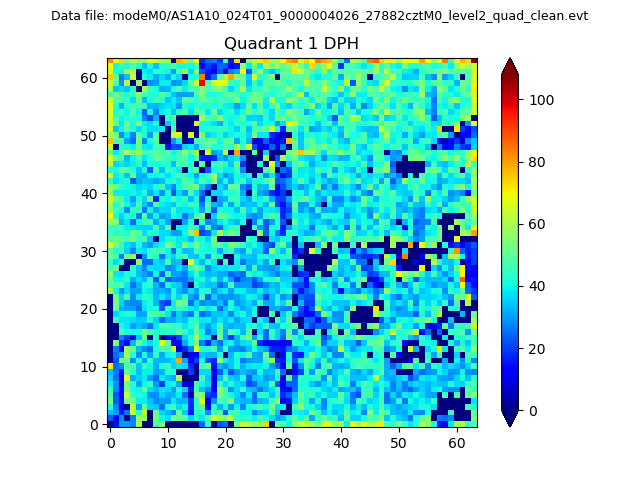
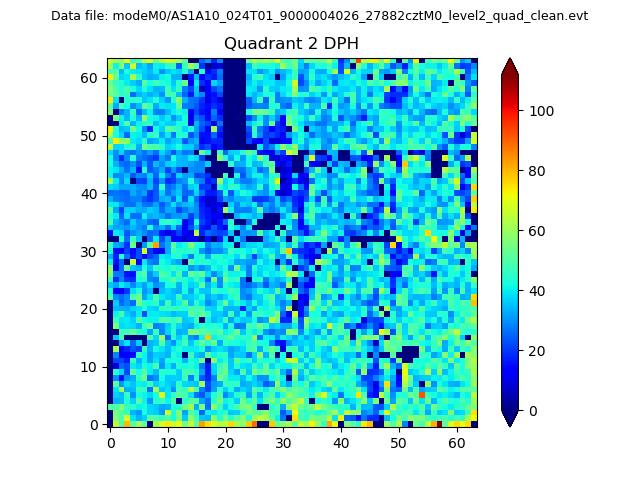
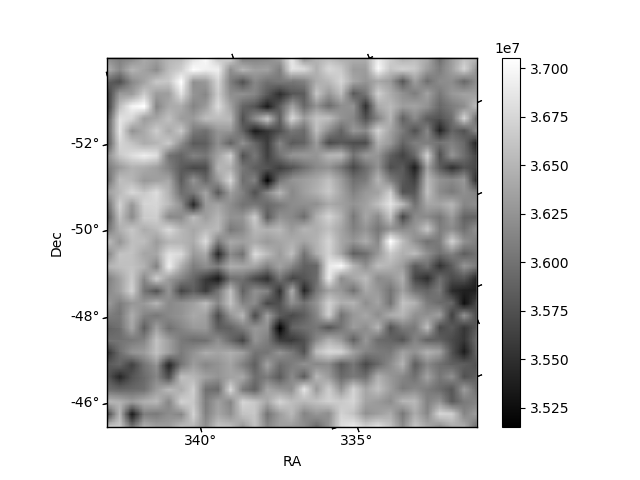
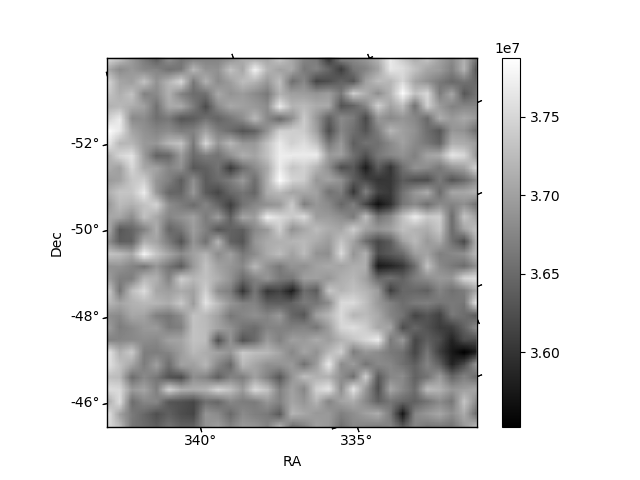
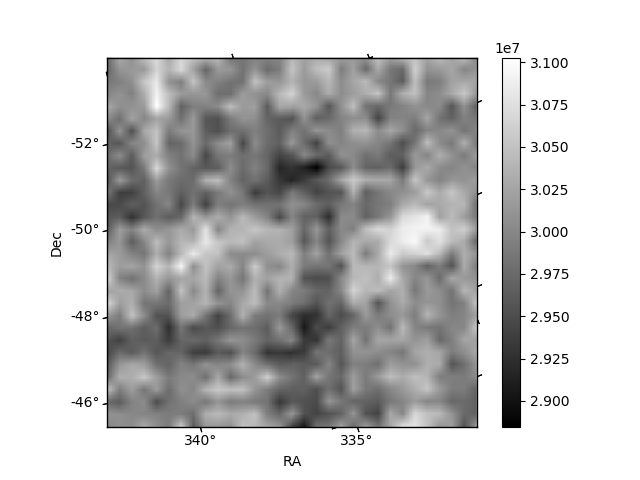
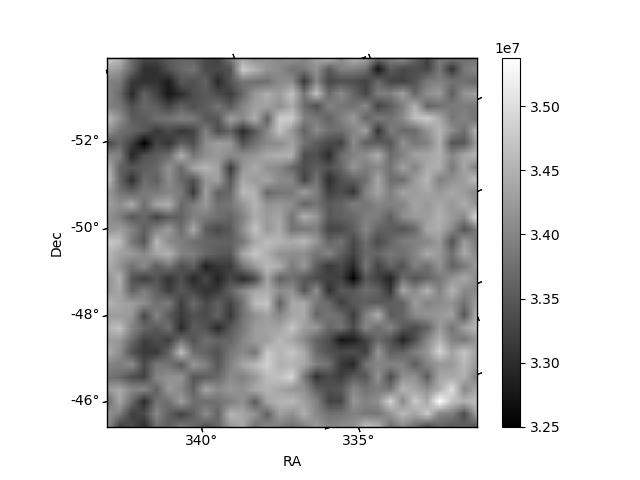
Histogram calculated using DETX and DETY for each event in the final _common_clean file
| Quadrant A |  |
 |
Quadrant B |
|---|---|---|---|
| Quadrant D |  |
 |
Quadrant C |
| Plot type | Count rate plots | Images |
|---|---|---|
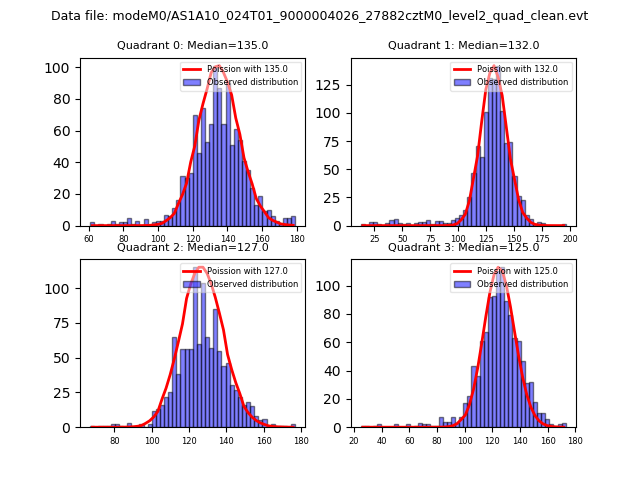
| Comparison with Poisson distribution Blue bars denote a histogram of data divided into 1 sec bins. Red curve is a Poisson curve with rate = median count rate of data. |
 |
 |
| Quadrant-wise count rates Data is divided into 100 sec bins |
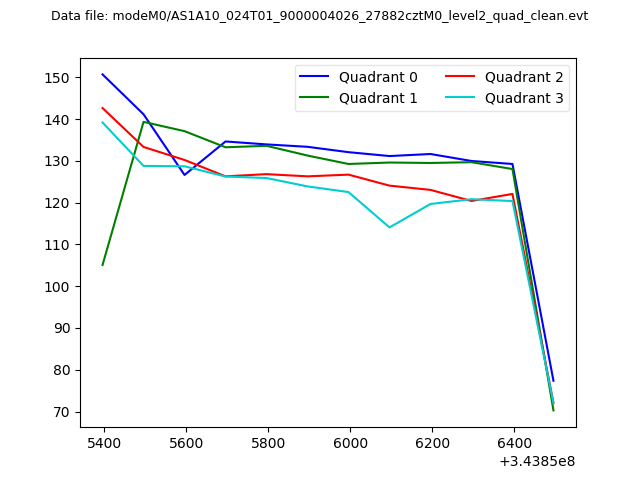 |
|
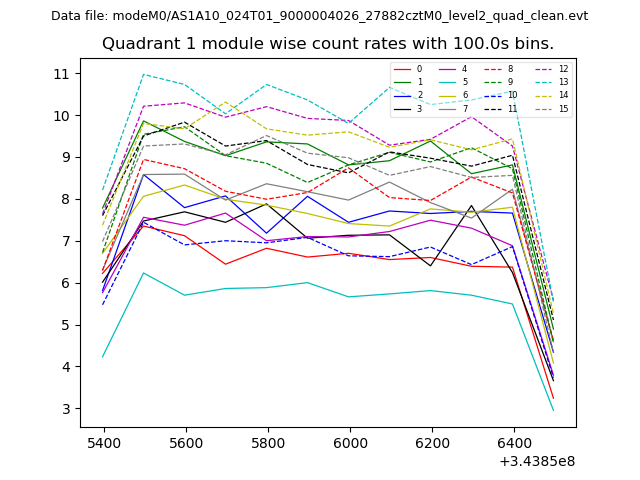
| Module-wise count rates for Quadrant A Data is divided into 100 sec bins |
 |
 |
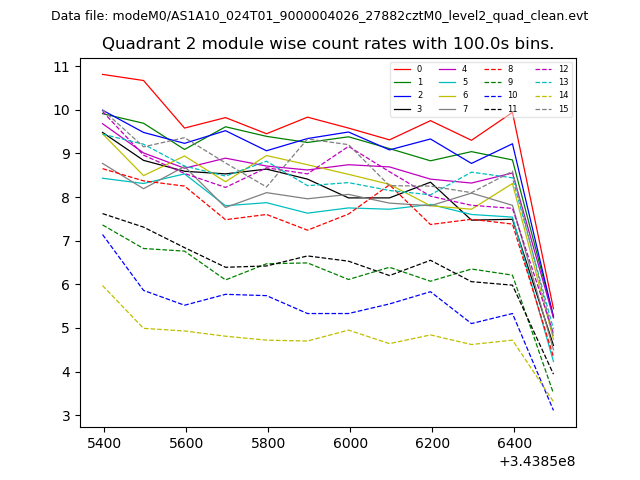
| Module-wise count rates for Quadrant B Data is divided into 100 sec bins |
 |
 |
| Module-wise count rates for Quadrant C Data is divided into 100 sec bins |
 |
 |
| Module-wise count rates for Quadrant D Data is divided into 100 sec bins |
 |
 |
| Parameter | Plot |
|---|---|
| CZT HV Monitor |  |
| D_VDD | 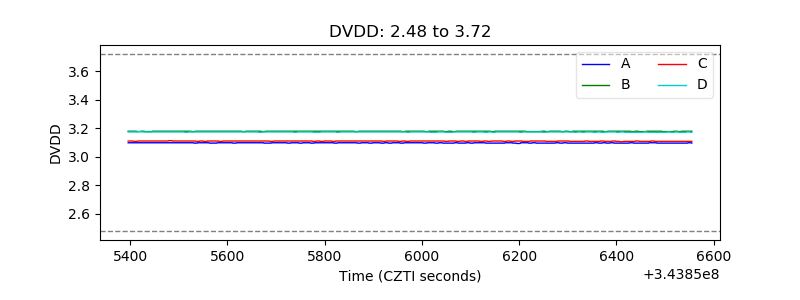 |
| Temperature 1 | 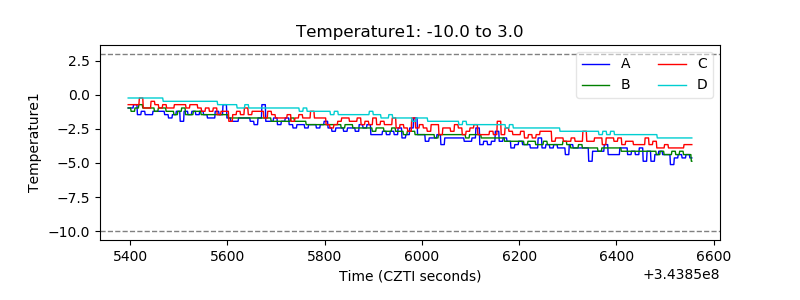 |
| Veto HV Monitor | 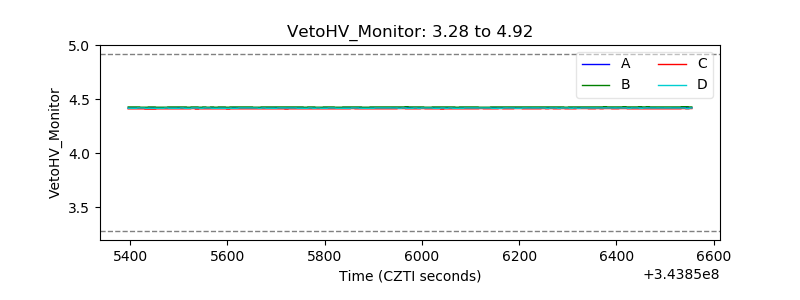 |
| Veto LLD | 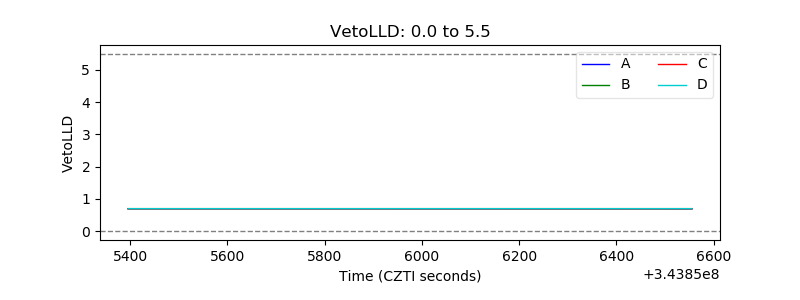 |
| Alpha Counter | 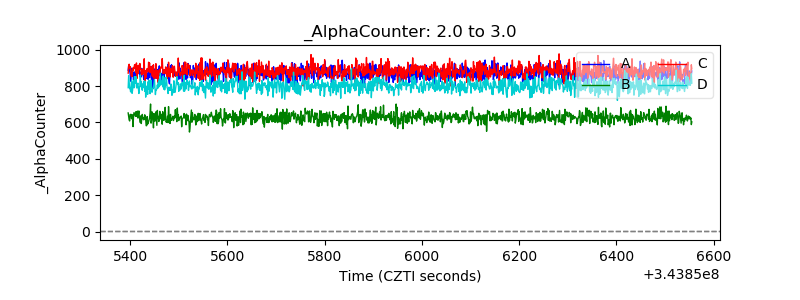 |
| _CPM_Rate | 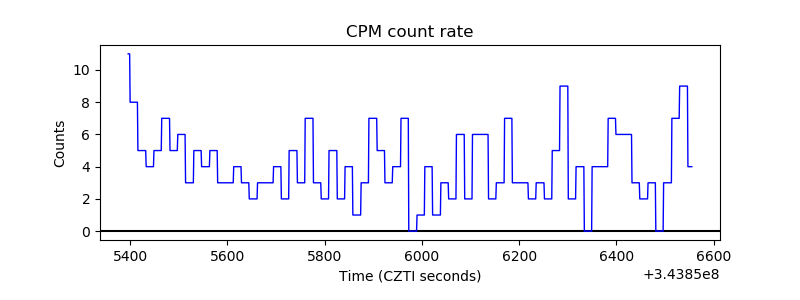 |
| CZT Counter |  |
| +2.5 Volts monitor |  |
| +5 Volts monitor |  |
| _ROLL_ROT | 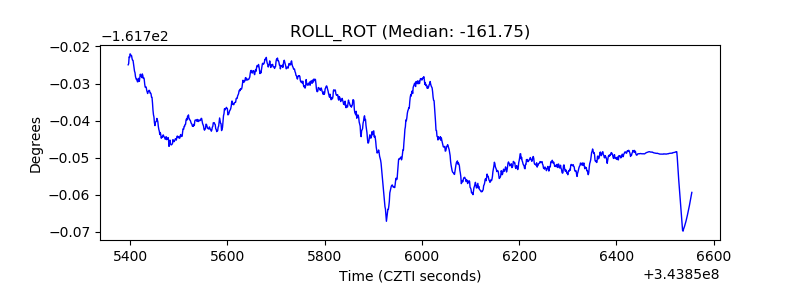 |
| _Roll_DEC | 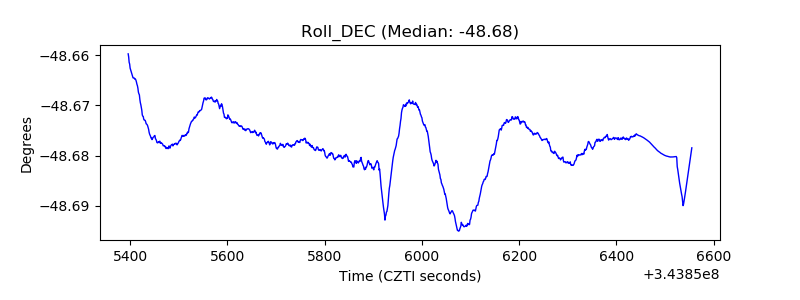 |
| _Roll_RA | 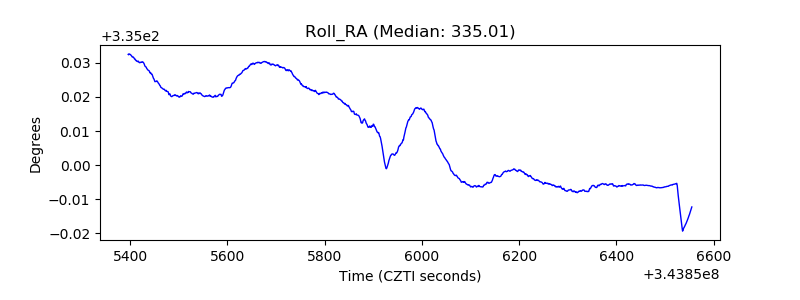 |
| Veto Counter | 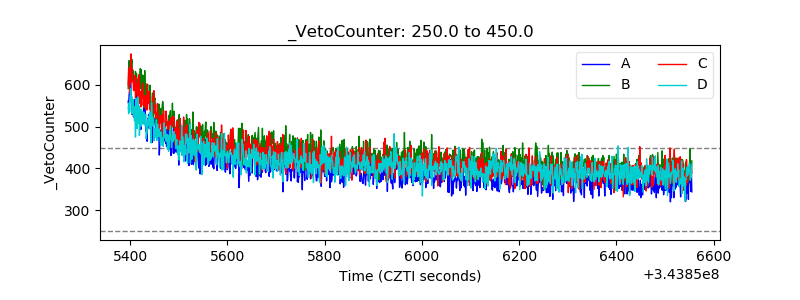 |