| Param | Original file | Final file |
|---|---|---|
| Filename | modeM0/AS1A10_048T01_9000004028cztM0_level2.fits | modeM0/AS1A10_048T01_9000004028cztM0_level2_quad_clean.evt |
| Size (bytes) | 670,034,880 | 593,933,760 |
| Size | 639.0 MB | 566.4 MB |
| Events in quadrant A | 4,211,160 | 3,610,837 |
| Events in quadrant B | 4,025,958 | 3,580,896 |
| Events in quadrant C | 4,009,562 | 3,321,791 |
| Events in quadrant D | 3,392,822 | 2,821,898 |
| Mode M0 | |||
|---|---|---|---|
| Quadrant | BADHDUFLAG | Total packets | Discarded packets |
| A | 0 | 144667 | 0 |
| B | 0 | 144837 | 0 |
| C | 0 | 144715 | 0 |
| D | 0 | 207006 | 0 |
| Mode M9 | |||
|---|---|---|---|
| Quadrant | BADHDUFLAG | Total packets | Discarded packets |
| A | 0 | 94 | 0 |
| B | 0 | 94 | 0 |
| C | 0 | 94 | 0 |
| D | 0 | 94 | 0 |
| Mode SS | |||
|---|---|---|---|
| Quadrant | BADHDUFLAG | Total packets | Discarded packets |
| A | 0 | 1378 | 0 |
| B | 0 | 1378 | 0 |
| C | 0 | 1378 | 0 |
| D | 0 | 1378 | 0 |
| Quadrant | Total seconds | Saturated seconds | Saturation percentage |
|---|---|---|---|
| A | 67818 | 662 | 0.976142% |
| B | 67818 | 837 | 1.234186% |
| C | 67818 | 1075 | 1.585125% |
| D | 67818 | 6679 | 9.848418% |
Noise dominated data is calculated using 1-second bins in cleaned event files. If a bin has >2000 counts, and if more than 50% of those come from <1% of pixels, then it is considered to be noise-dominated and hence unusable.
| Quadrant | # 1 sec bins | Bins with >0 counts | Bins with >2000 counts | High rate bins dominated by noise | Noise dominated (total time) | Noise dominated (detector-on time) | Marked lightcurve |
|---|---|---|---|---|---|---|---|
| A | 86777 | 67810 | 0 | 0 | 0.00% | 0.00% |  |
| B | 86777 | 67808 | 0 | 0 | 0.00% | 0.00% |  |
| C | 86777 | 67810 | 0 | 0 | 0.00% | 0.00% | 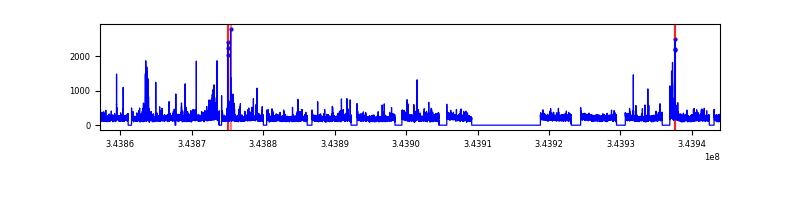 |
| D | 86777 | 67609 | 0 | 0 | 0.00% | 0.00% |  |
Top three noisy pixels from each quadrant. If the there are fewer than three noisy pixels in the level2.evt file, extra rows are filled as -1
| Pixel properties | Quadrant properties | ||||||
|---|---|---|---|---|---|---|---|
| Quadrant | DetID | PixID | Counts | Sigma | Mean | Median | Sigma |
| A | 0 | 29 | 4167 | 11.82 | 1097 | 1031 | 265.4 |
| A | 7 | 110 | 3348 | 8.73 | 1097 | 1031 | 265.4 |
| A | 0 | 30 | 3160 | 8.02 | 1097 | 1031 | 265.4 |
| B | 2 | 9 | 3146 | 10.23 | 1064 | 1020 | 207.7 |
| B | 5 | 128 | 2672 | 7.95 | 1064 | 1020 | 207.7 |
| B | 2 | 8 | 2640 | 7.8 | 1064 | 1020 | 207.7 |
| C | 12 | 241 | 2854 | 6.93 | 1060 | 992 | 268.6 |
| C | 3 | 126 | 2767 | 6.61 | 1060 | 992 | 268.6 |
| C | 7 | 111 | 2664 | 6.22 | 1060 | 992 | 268.6 |
| D | 4 | 246 | 2633 | 6.84 | 968 | 884 | 255.8 |
| D | 6 | 231 | 2483 | 6.25 | 968 | 884 | 255.8 |
| D | 15 | 46 | 2388 | 5.88 | 968 | 884 | 255.8 |
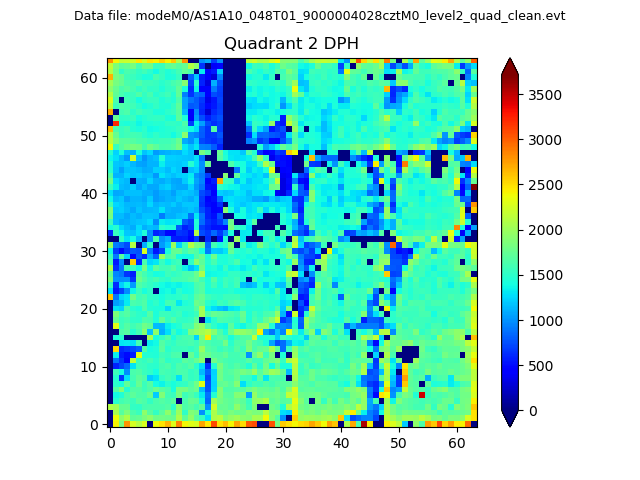
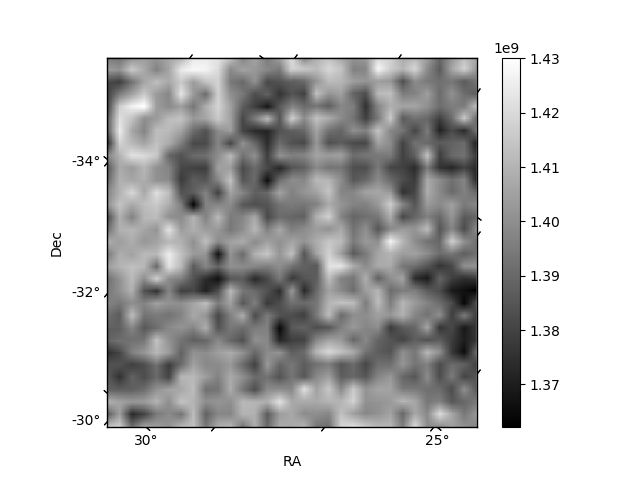
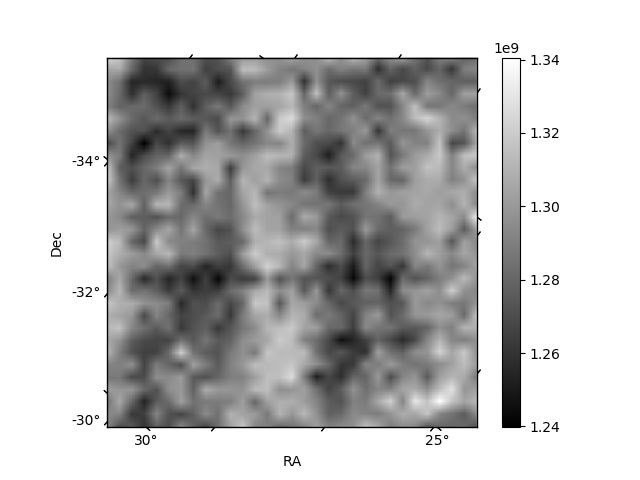
Histogram calculated using DETX and DETY for each event in the final _common_clean file
| Quadrant A | 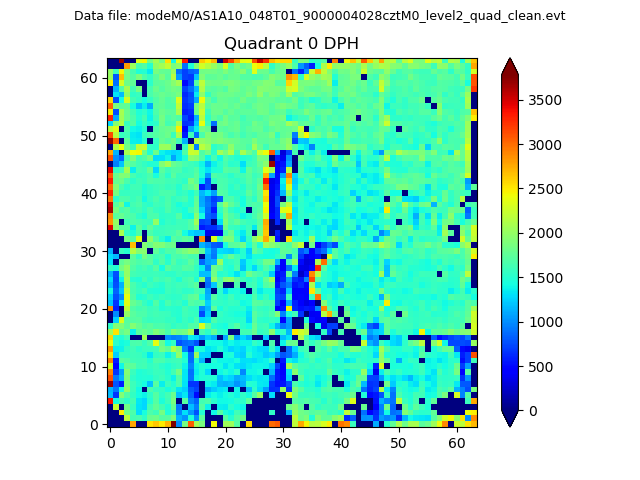 |
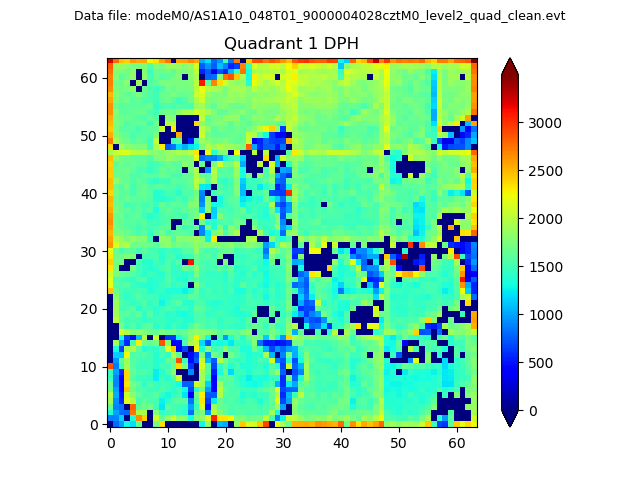 |
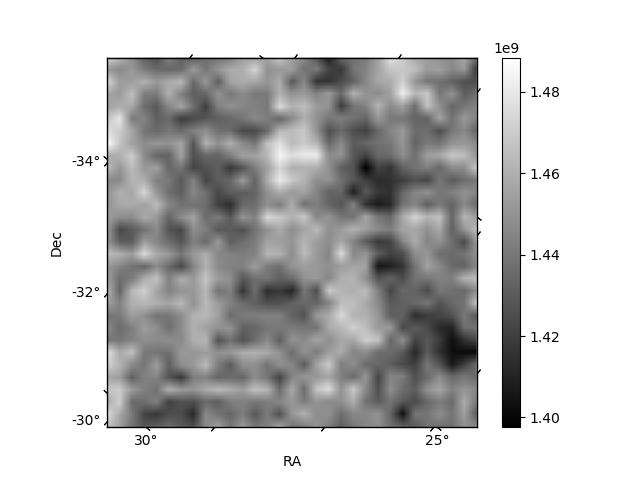
Quadrant B |
|---|---|---|---|
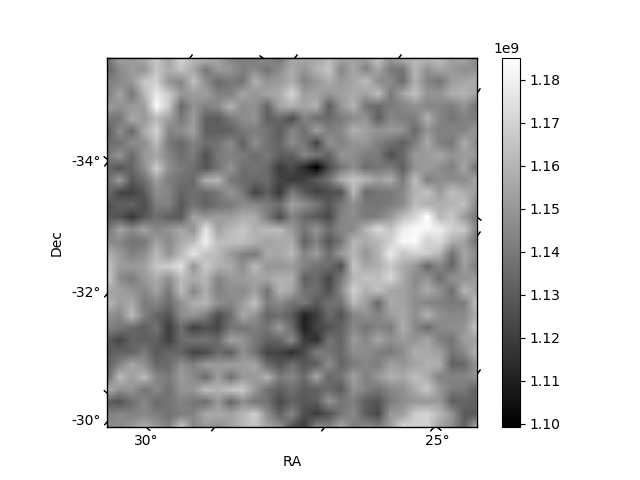
| Quadrant D | 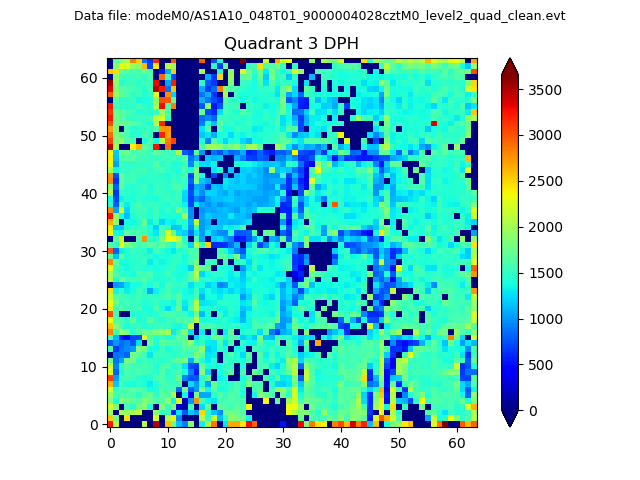 |
 |
Quadrant C |
| Plot type | Count rate plots | Images |
|---|---|---|
| Comparison with Poisson distribution Blue bars denote a histogram of data divided into 1 sec bins. Red curve is a Poisson curve with rate = median count rate of data. |
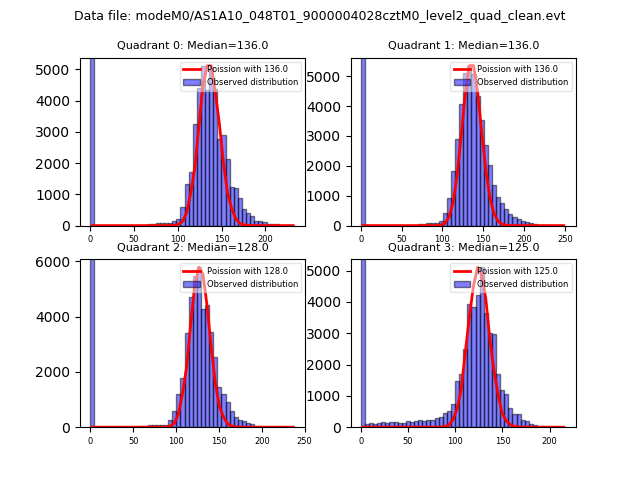 |
 |
| Quadrant-wise count rates Data is divided into 100 sec bins |
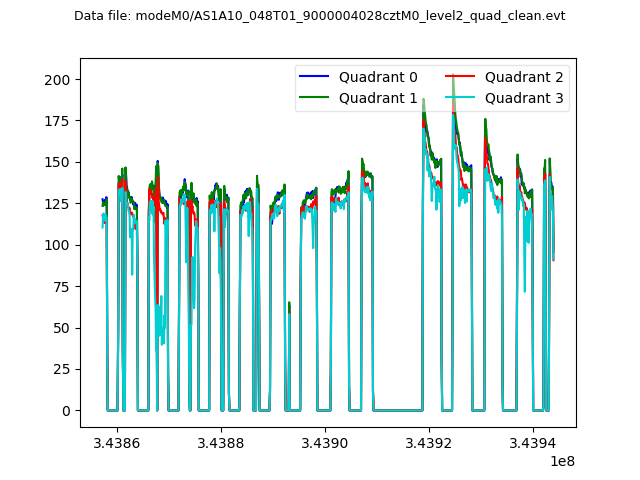 |
|
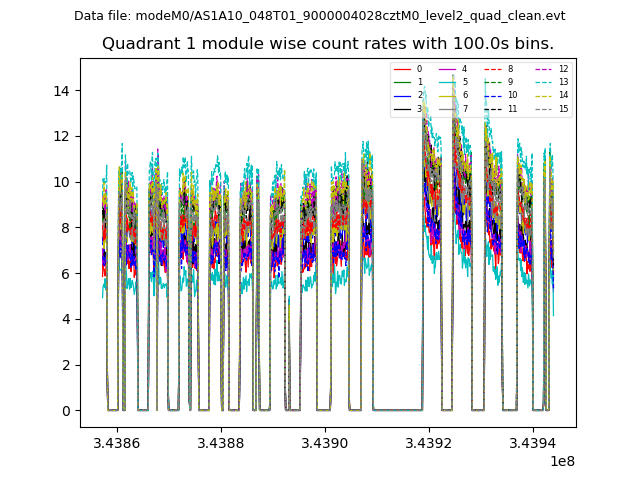
| Module-wise count rates for Quadrant A Data is divided into 100 sec bins |
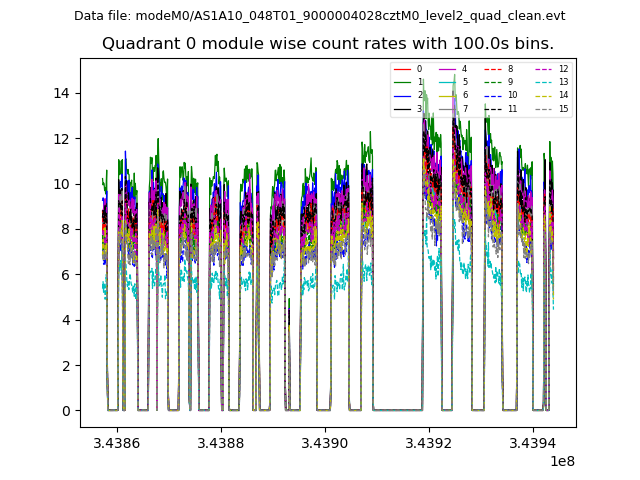 |
 |
| Module-wise count rates for Quadrant B Data is divided into 100 sec bins |
 |
 |
| Module-wise count rates for Quadrant C Data is divided into 100 sec bins |
 |
 |
| Module-wise count rates for Quadrant D Data is divided into 100 sec bins |
 |
 |
| Parameter | Plot |
|---|---|
| CZT HV Monitor | 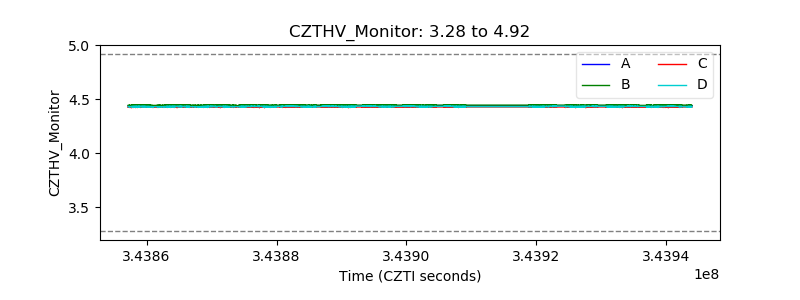 |
| D_VDD |  |
| Temperature 1 |  |
| Veto HV Monitor | 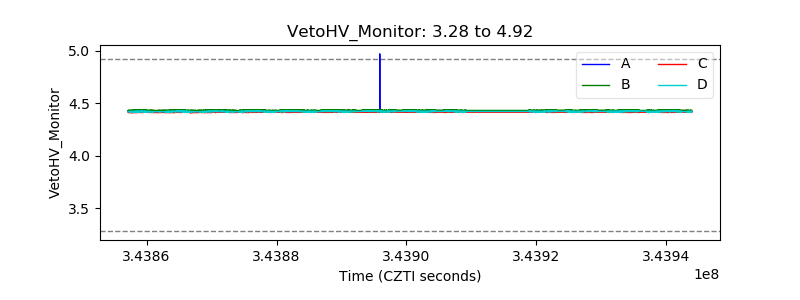 |
| Veto LLD | 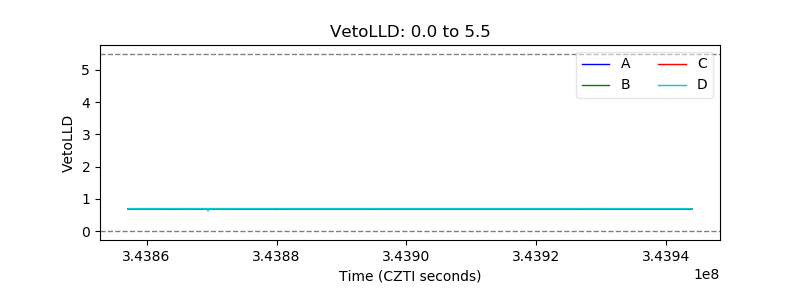 |
| Alpha Counter |  |
| _CPM_Rate | 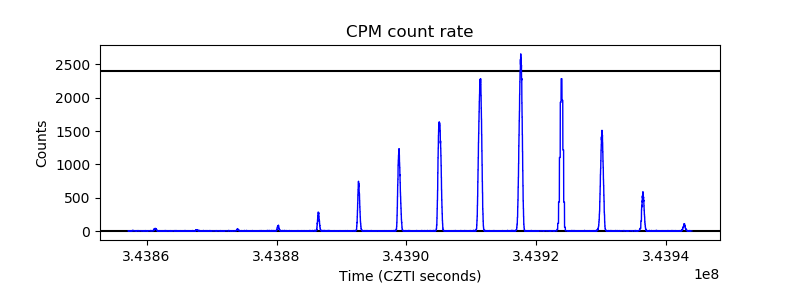 |
| CZT Counter | 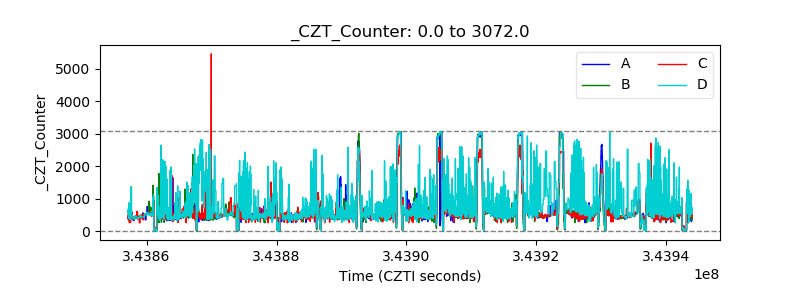 |
| +2.5 Volts monitor | 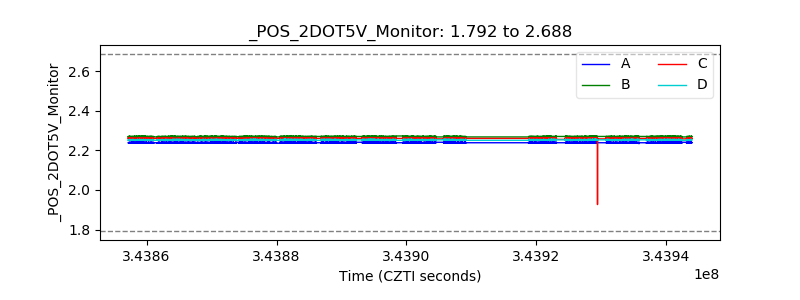 |
| +5 Volts monitor | 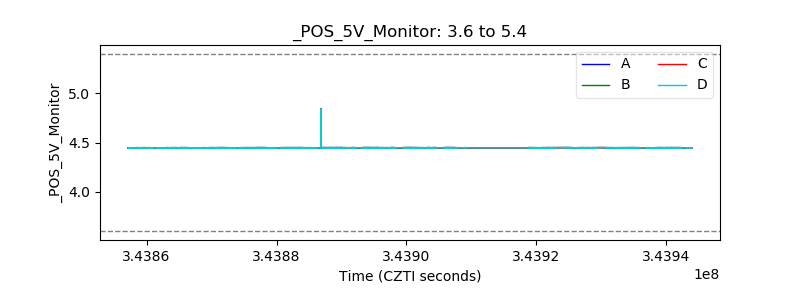 |
| _ROLL_ROT | 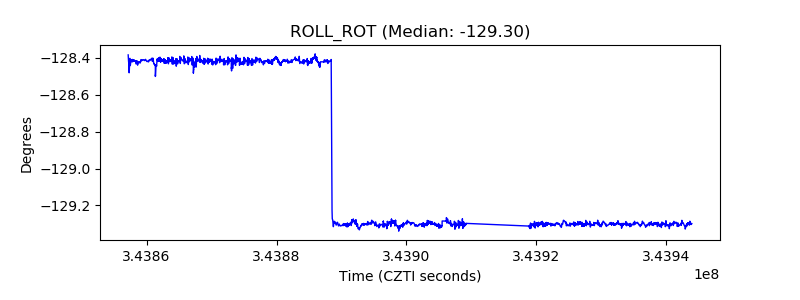 |
| _Roll_DEC | 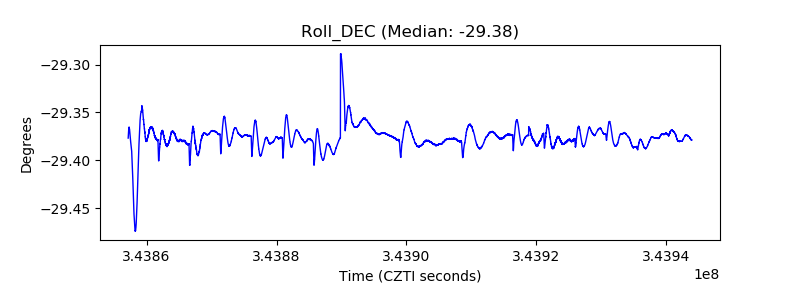 |
| _Roll_RA | 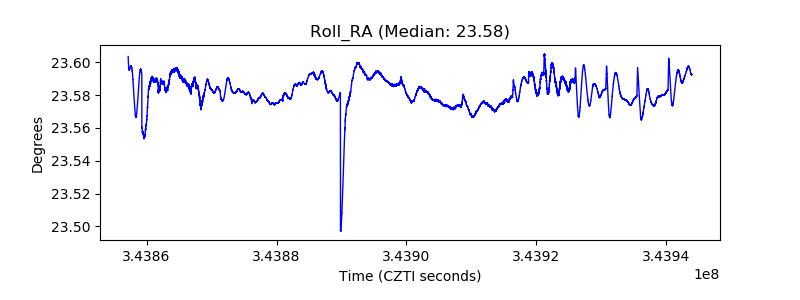 |
| Veto Counter |  |