| Param | Original file | Final file |
|---|---|---|
| Filename | modeM0/AS1A10_048T01_9000004028_27882cztM0_level2.evt | modeM0/AS1A10_048T01_9000004028_27882cztM0_level2_quad_clean.evt |
| Size (bytes) | 389,816,640 | 67,429,440 |
| Size | 371.8 MB | 64.3 MB |
| Events in quadrant A | 2,570,275 | 432,535 |
| Events in quadrant B | 2,874,704 | 430,665 |
| Events in quadrant C | 2,657,304 | 405,766 |
| Events in quadrant D | 3,334,963 | 393,826 |
| Mode M0 | |||
|---|---|---|---|
| Quadrant | BADHDUFLAG | Total packets | Discarded packets |
| A | 0 | 11175 | 0 |
| B | 0 | 12166 | 0 |
| C | 0 | 11261 | 0 |
| D | 0 | 13497 | 0 |
| Mode M9 | |||
|---|---|---|---|
| Quadrant | BADHDUFLAG | Total packets | Discarded packets |
| A | 0 | 4 | 0 |
| B | 0 | 4 | 0 |
| C | 0 | 4 | 0 |
| D | 0 | 4 | 0 |
| Quadrant | Total seconds | Saturated seconds | Saturation percentage |
|---|---|---|---|
| A | 5405 | 39 | 0.721554% |
| B | 5405 | 94 | 1.739130% |
| C | 5405 | 59 | 1.091582% |
| D | 5404 | 232 | 4.293116% |
Noise dominated data is calculated using 1-second bins in cleaned event files. If a bin has >2000 counts, and if more than 50% of those come from <1% of pixels, then it is considered to be noise-dominated and hence unusable.
| Quadrant | # 1 sec bins | Bins with >0 counts | Bins with >2000 counts | High rate bins dominated by noise | Noise dominated (total time) | Noise dominated (detector-on time) | Marked lightcurve |
|---|---|---|---|---|---|---|---|
| A | 5885 | 5406 | 0 | 0 | 0.00% | 0.00% | 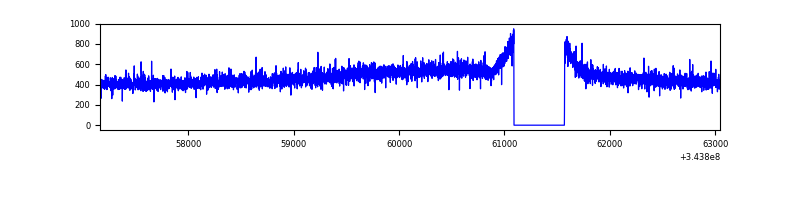 |
| B | 5885 | 5405 | 12 | 12 | 0.20% | 0.22% | 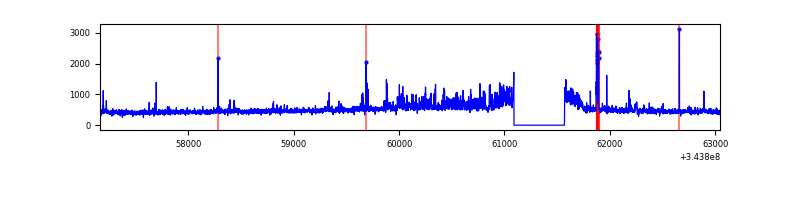 |
| C | 5885 | 5406 | 0 | 0 | 0.00% | 0.00% | 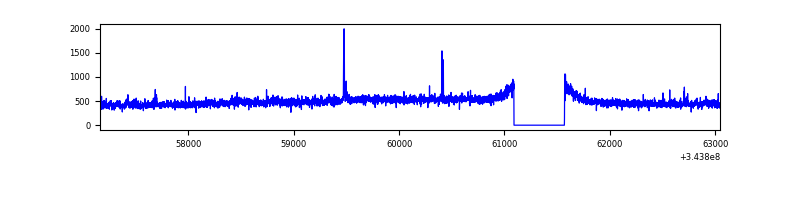 |
| D | 5884 | 5405 | 153 | 153 | 2.60% | 2.83% | 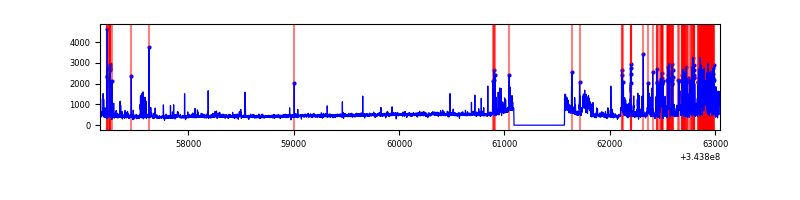 |
Top three noisy pixels from each quadrant. If the there are fewer than three noisy pixels in the level2.evt file, extra rows are filled as -1
| Pixel properties | Quadrant properties | ||||||
|---|---|---|---|---|---|---|---|
| Quadrant | DetID | PixID | Counts | Sigma | Mean | Median | Sigma |
| A | 13 | 254 | 10096 | 70.02 | 665 | 652 | 134.9 |
| A | 3 | 137 | 6363 | 42.34 | 665 | 652 | 134.9 |
| A | 0 | 226 | 5512 | 36.03 | 665 | 652 | 134.9 |
| B | 0 | 230 | 155133 | 1214.4 | 659 | 643 | 127.2 |
| B | 5 | 255 | 37776 | 291.89 | 659 | 643 | 127.2 |
| B | 10 | 247 | 36405 | 281.12 | 659 | 643 | 127.2 |
| C | 14 | 238 | 99986 | 669.35 | 630 | 635 | 148.4 |
| C | 3 | 233 | 89050 | 595.68 | 630 | 635 | 148.4 |
| C | 13 | 61 | 4255 | 24.39 | 630 | 635 | 148.4 |
| D | 7 | 238 | 583715 | 3902.79 | 628 | 610 | 149.4 |
| D | 2 | 250 | 236526 | 1579.01 | 628 | 610 | 149.4 |
| D | 1 | 52 | 95913 | 637.87 | 628 | 610 | 149.4 |
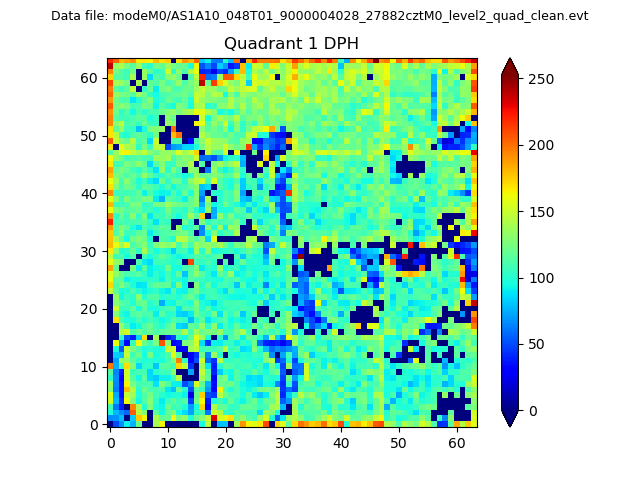
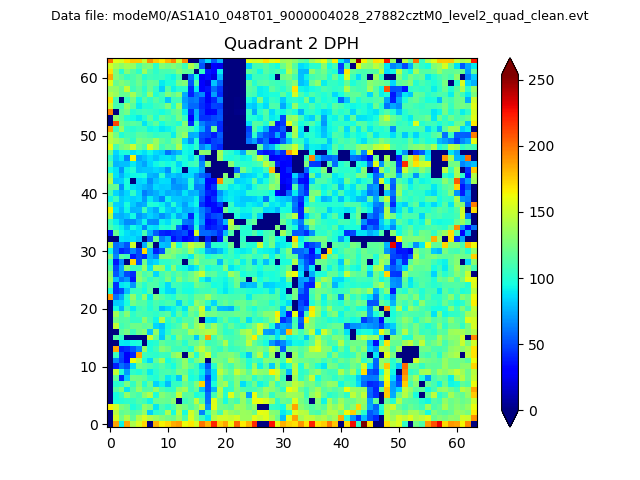
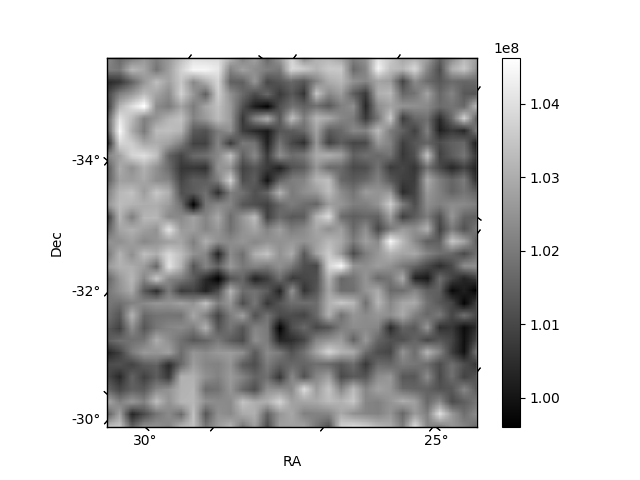
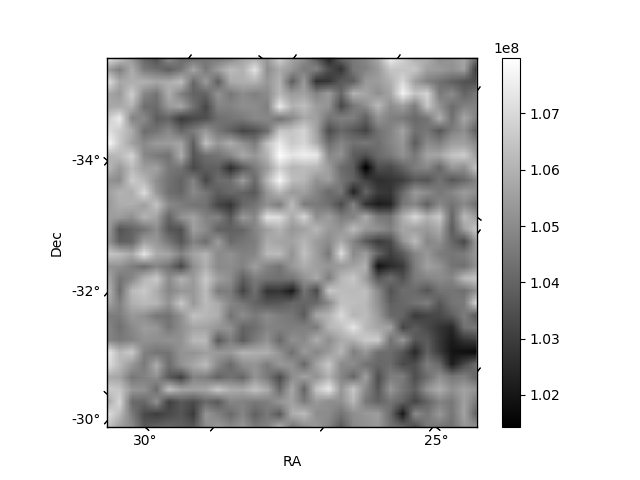
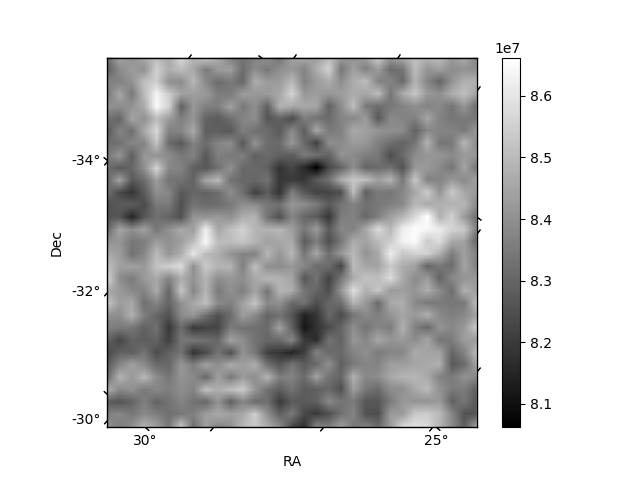
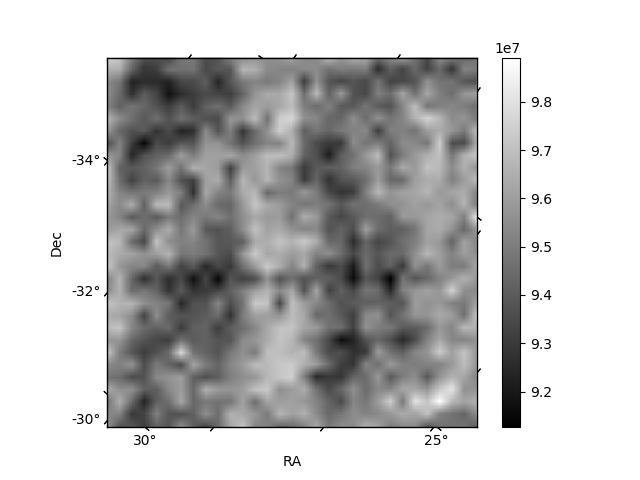
Histogram calculated using DETX and DETY for each event in the final _common_clean file
| Quadrant A |  |
 |
Quadrant B |
|---|---|---|---|
| Quadrant D |  |
 |
Quadrant C |
| Plot type | Count rate plots | Images |
|---|---|---|
| Comparison with Poisson distribution Blue bars denote a histogram of data divided into 1 sec bins. Red curve is a Poisson curve with rate = median count rate of data. |
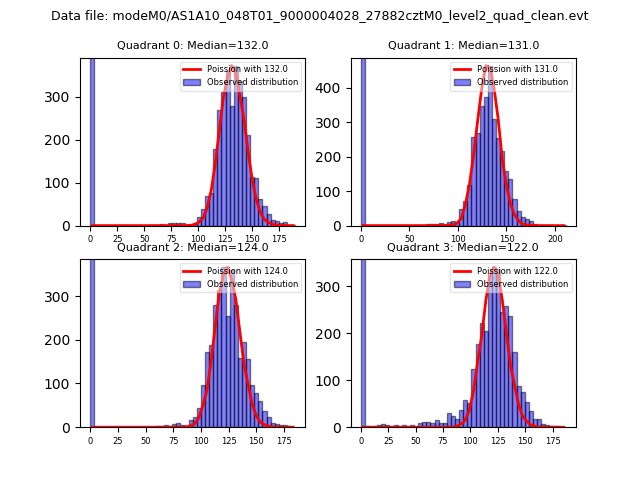 |
 |
| Quadrant-wise count rates Data is divided into 100 sec bins |
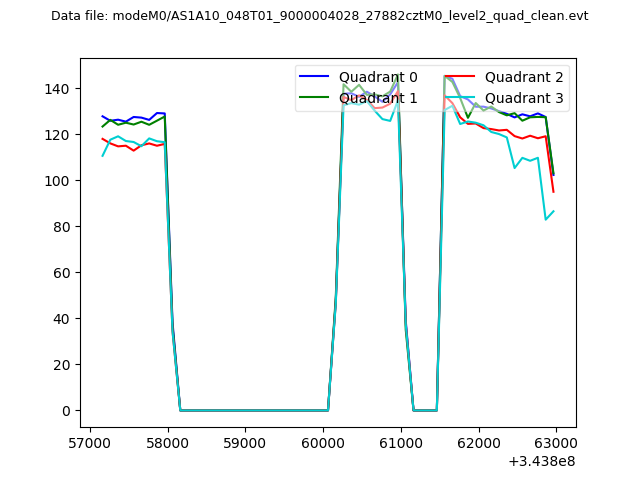 |
|
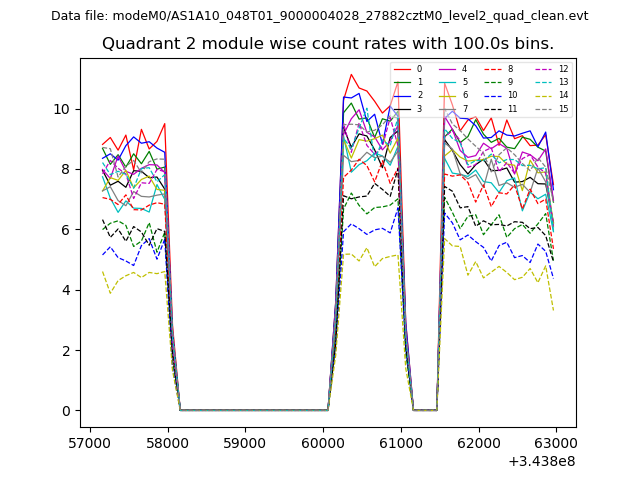
| Module-wise count rates for Quadrant A Data is divided into 100 sec bins |
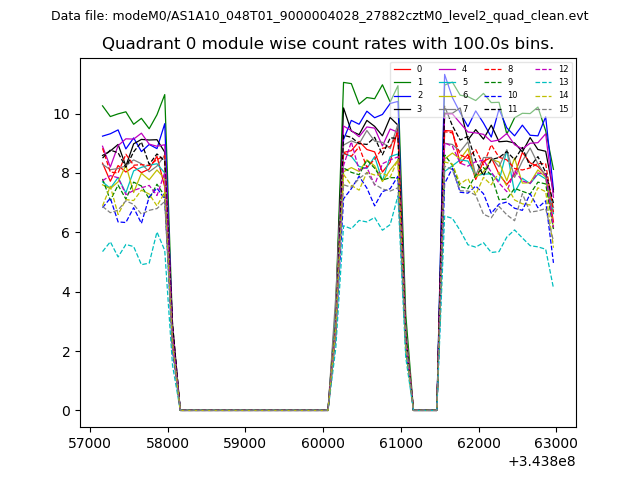 |
 |
| Module-wise count rates for Quadrant B Data is divided into 100 sec bins |
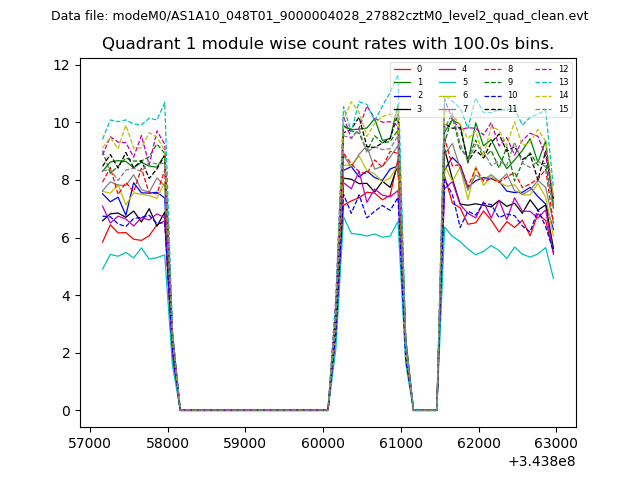 |
 |
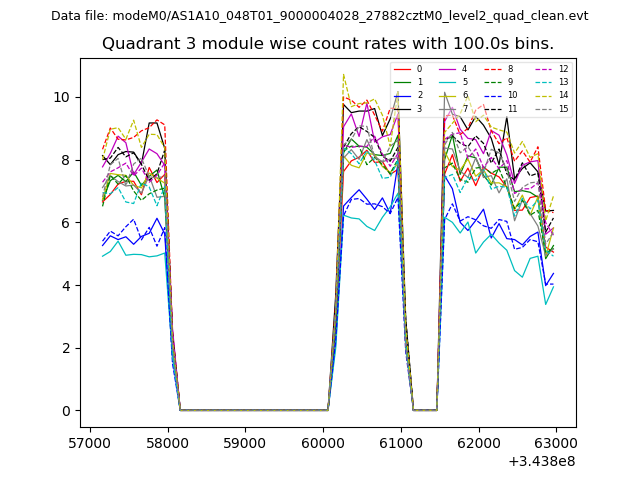
| Module-wise count rates for Quadrant C Data is divided into 100 sec bins |
 |
 |
| Module-wise count rates for Quadrant D Data is divided into 100 sec bins |
 |
 |
| Parameter | Plot |
|---|---|
| CZT HV Monitor | 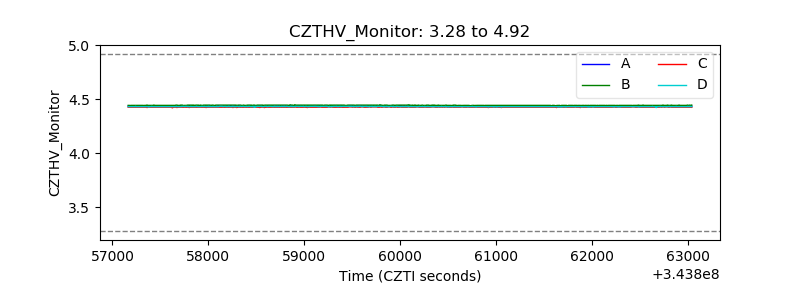 |
| D_VDD | 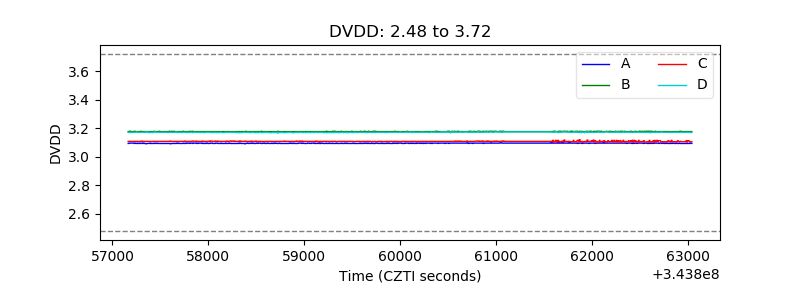 |
| Temperature 1 | 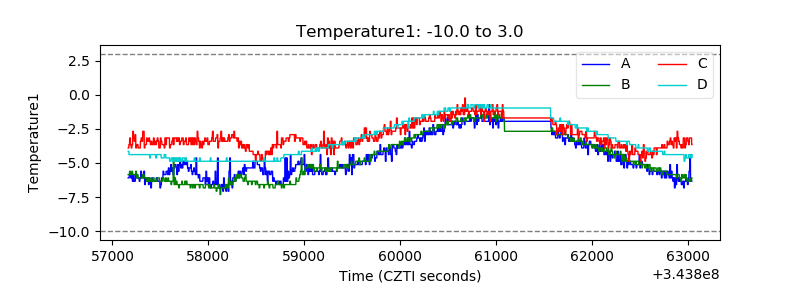 |
| Veto HV Monitor | 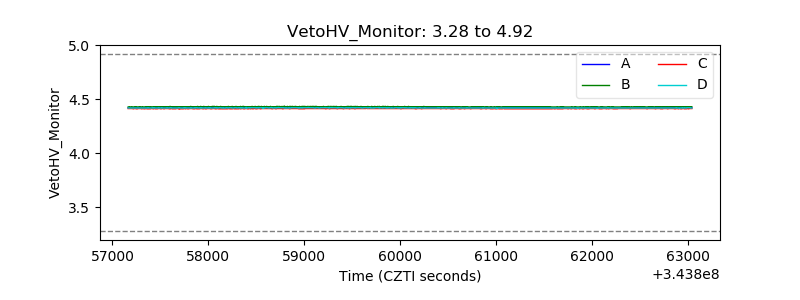 |
| Veto LLD | 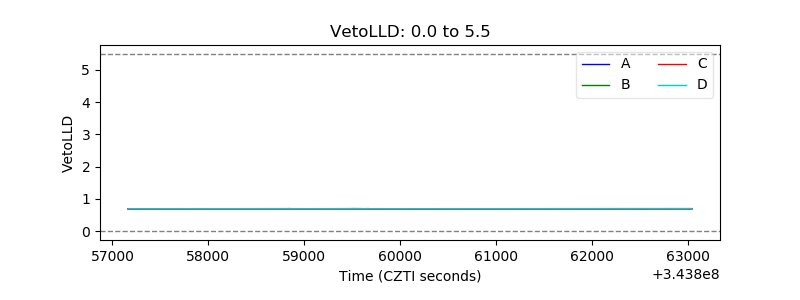 |
| Alpha Counter | 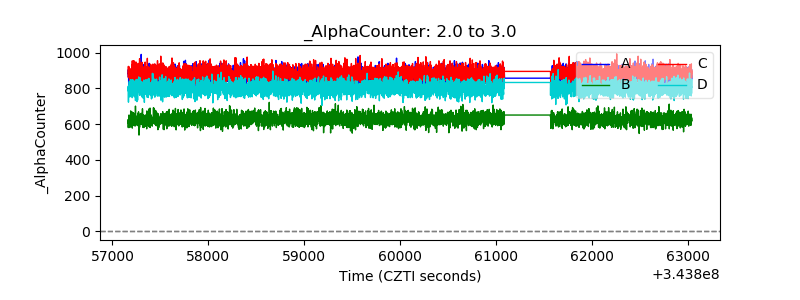 |
| _CPM_Rate | 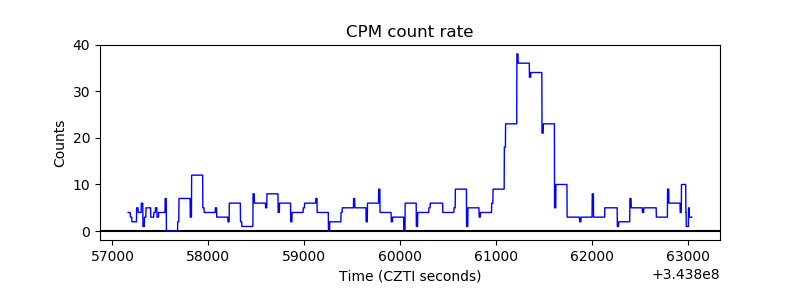 |
| CZT Counter | 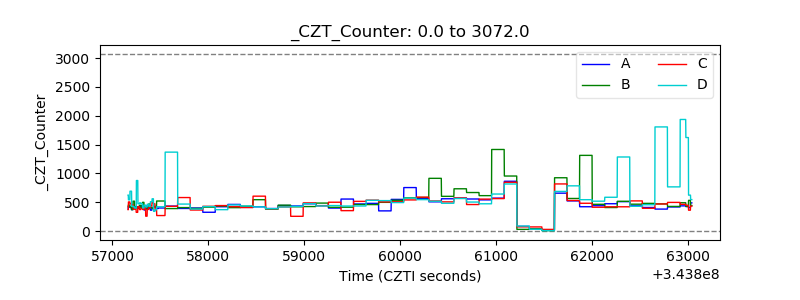 |
| +2.5 Volts monitor |  |
| +5 Volts monitor |  |
| _ROLL_ROT | 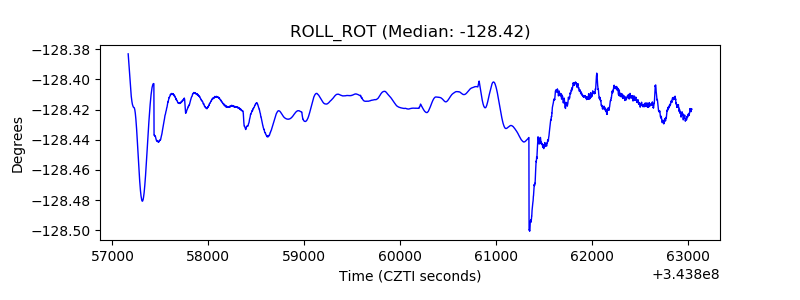 |
| _Roll_DEC | 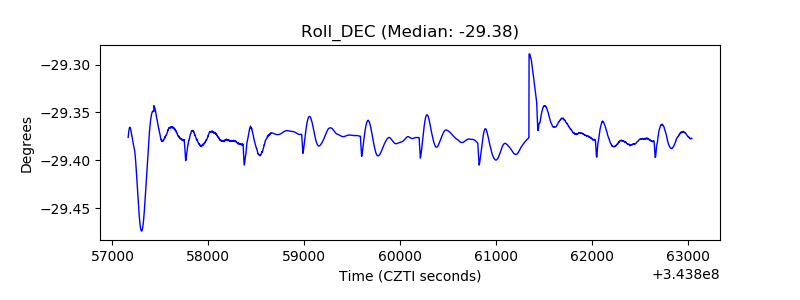 |
| _Roll_RA | 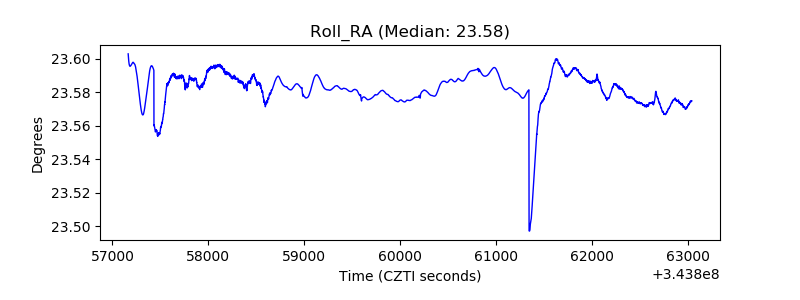 |
| Veto Counter | 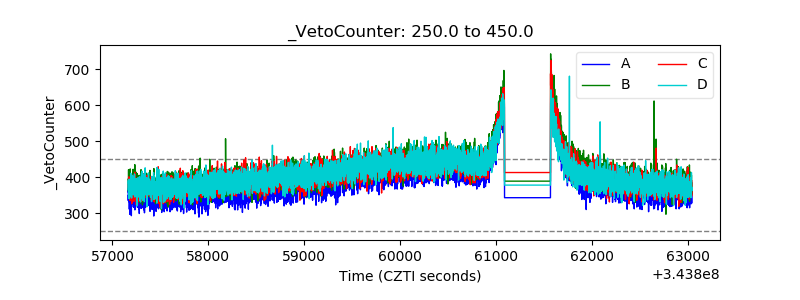 |