| Param | Original file | Final file |
|---|---|---|
| Filename | modeM0/AS1A10_048T01_9000004028_27883cztM0_level2.evt | modeM0/AS1A10_048T01_9000004028_27883cztM0_level2_quad_clean.evt |
| Size (bytes) | 645,744,960 | 106,361,280 |
| Size | 615.8 MB | 101.4 MB |
| Events in quadrant A | 3,659,397 | 735,265 |
| Events in quadrant B | 3,898,298 | 731,067 |
| Events in quadrant C | 3,938,310 | 686,472 |
| Events in quadrant D | 7,535,339 | 529,483 |
| Mode M0 | |||
|---|---|---|---|
| Quadrant | BADHDUFLAG | Total packets | Discarded packets |
| A | 0 | 16013 | 0 |
| B | 0 | 16697 | 0 |
| C | 0 | 16573 | 0 |
| D | 0 | 27701 | 0 |
| Mode M9 | |||
|---|---|---|---|
| Quadrant | BADHDUFLAG | Total packets | Discarded packets |
| A | 0 | 1 | 0 |
| B | 0 | 1 | 0 |
| C | 0 | 1 | 0 |
| D | 0 | 1 | 0 |
| Quadrant | Total seconds | Saturated seconds | Saturation percentage |
|---|---|---|---|
| A | 7730 | 73 | 0.944373% |
| B | 7731 | 160 | 2.069590% |
| C | 7730 | 144 | 1.862872% |
| D | 7730 | 2223 | 28.758085% |
Noise dominated data is calculated using 1-second bins in cleaned event files. If a bin has >2000 counts, and if more than 50% of those come from <1% of pixels, then it is considered to be noise-dominated and hence unusable.
| Quadrant | # 1 sec bins | Bins with >0 counts | Bins with >2000 counts | High rate bins dominated by noise | Noise dominated (total time) | Noise dominated (detector-on time) | Marked lightcurve |
|---|---|---|---|---|---|---|---|
| A | 7860 | 7731 | 1 | 1 | 0.01% | 0.01% | 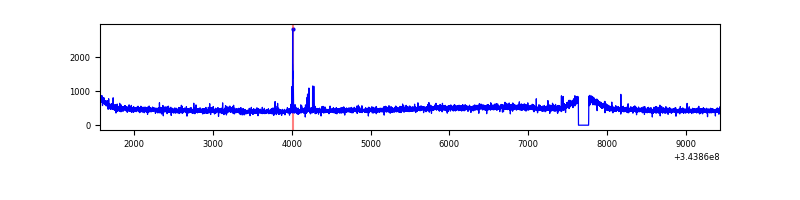 |
| B | 7861 | 7732 | 30 | 30 | 0.38% | 0.39% | 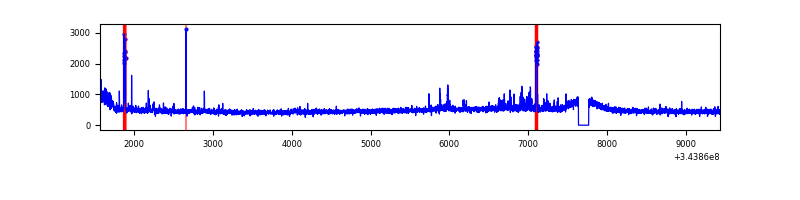 |
| C | 7860 | 7731 | 4 | 4 | 0.05% | 0.05% | 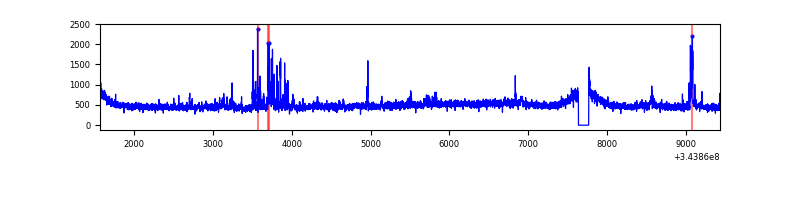 |
| D | 7860 | 7730 | 844 | 844 | 10.74% | 10.92% | 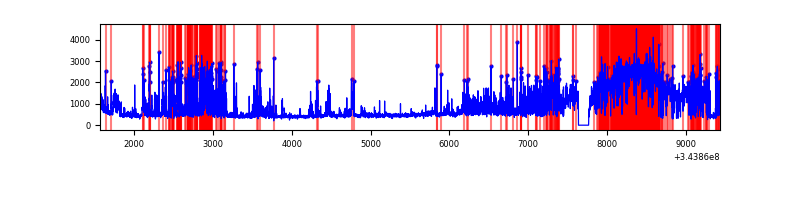 |
Top three noisy pixels from each quadrant. If the there are fewer than three noisy pixels in the level2.evt file, extra rows are filled as -1
| Pixel properties | Quadrant properties | ||||||
|---|---|---|---|---|---|---|---|
| Quadrant | DetID | PixID | Counts | Sigma | Mean | Median | Sigma |
| A | 14 | 235 | 35878 | 183.69 | 939 | 919 | 190.3 |
| A | 13 | 254 | 13853 | 67.96 | 939 | 919 | 190.3 |
| A | 3 | 137 | 9270 | 43.88 | 939 | 919 | 190.3 |
| B | 0 | 230 | 133013 | 731.82 | 934 | 910 | 180.5 |
| B | 0 | 190 | 36530 | 197.33 | 934 | 910 | 180.5 |
| B | 10 | 247 | 30581 | 164.37 | 934 | 910 | 180.5 |
| C | 3 | 233 | 175639 | 834.9 | 890 | 894 | 209.3 |
| C | 14 | 238 | 142198 | 675.13 | 890 | 894 | 209.3 |
| C | 2 | 16 | 120449 | 571.21 | 890 | 894 | 209.3 |
| D | 7 | 238 | 4181527 | 23166.65 | 752 | 730 | 180.5 |
| D | 2 | 250 | 250571 | 1384.42 | 752 | 730 | 180.5 |
| D | 1 | 52 | 241635 | 1334.9 | 752 | 730 | 180.5 |
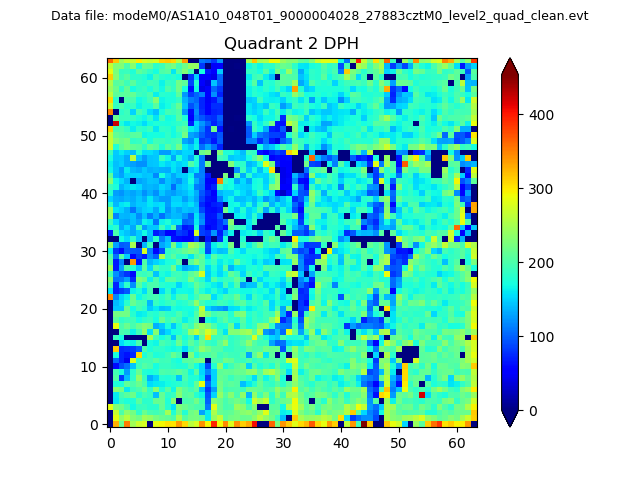
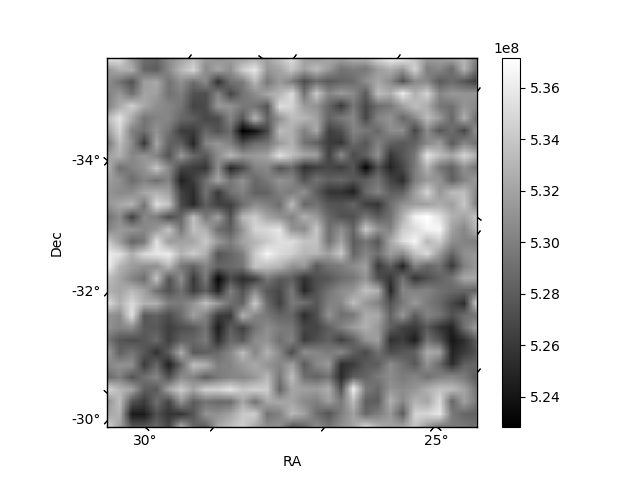
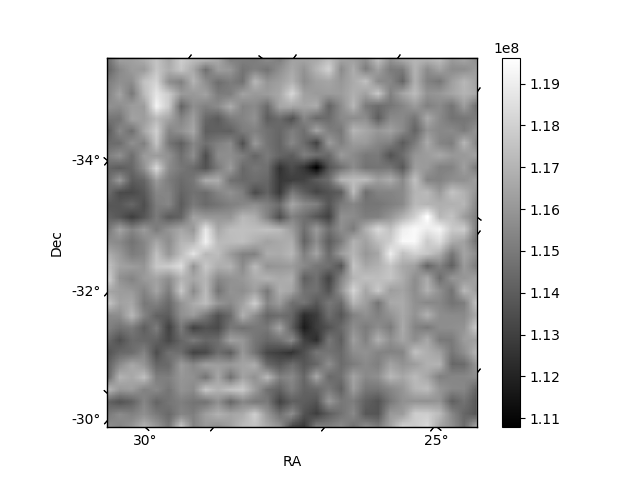
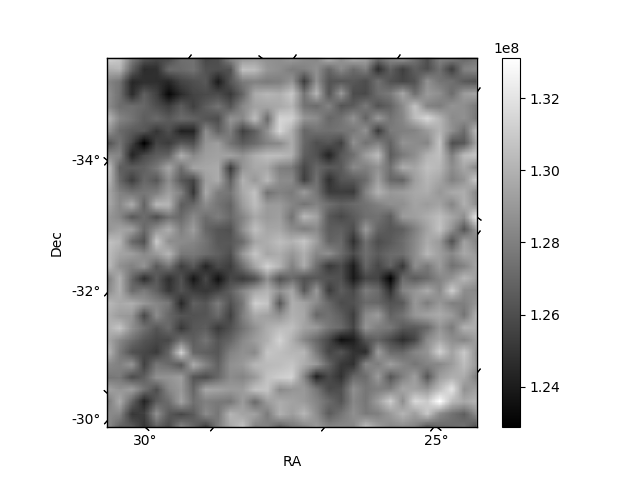
Histogram calculated using DETX and DETY for each event in the final _common_clean file
| Quadrant A | 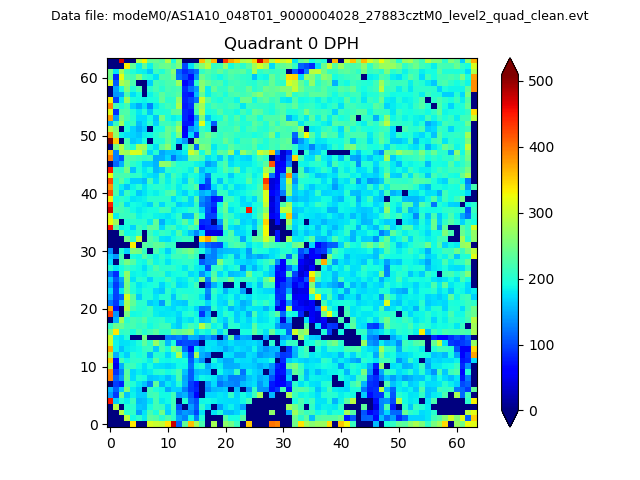 |
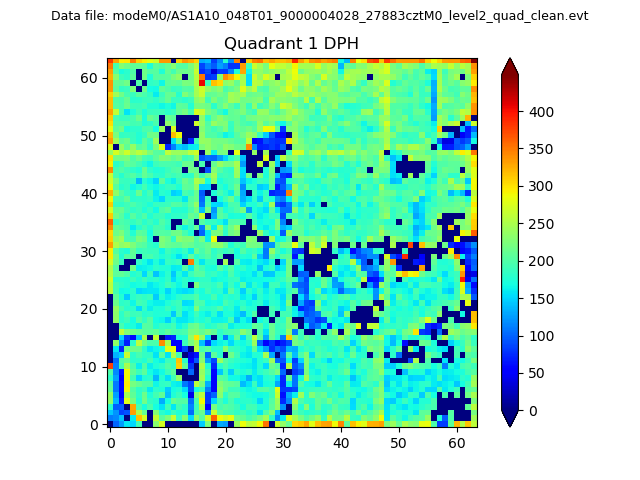 |
Quadrant B |
|---|---|---|---|
| Quadrant D | 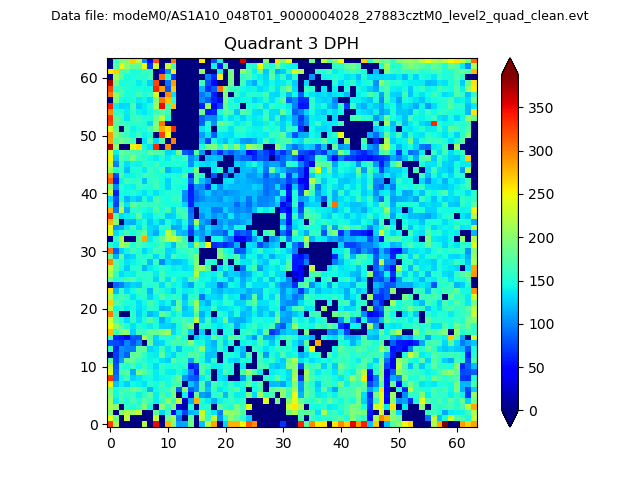 |
 |
Quadrant C |
| Plot type | Count rate plots | Images |
|---|---|---|
| Comparison with Poisson distribution Blue bars denote a histogram of data divided into 1 sec bins. Red curve is a Poisson curve with rate = median count rate of data. |
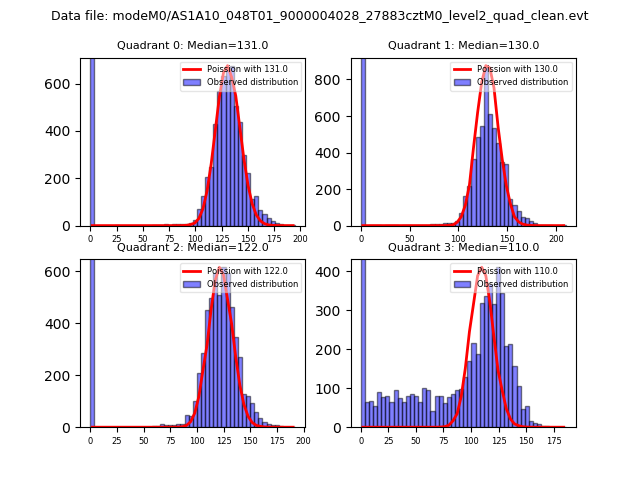 |
 |
| Quadrant-wise count rates Data is divided into 100 sec bins |
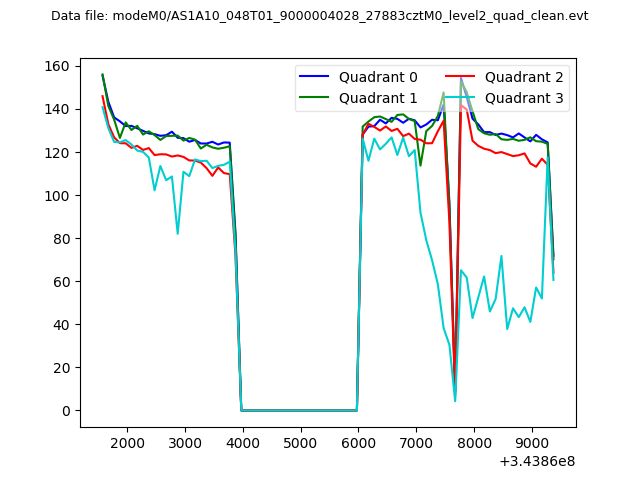 |
|
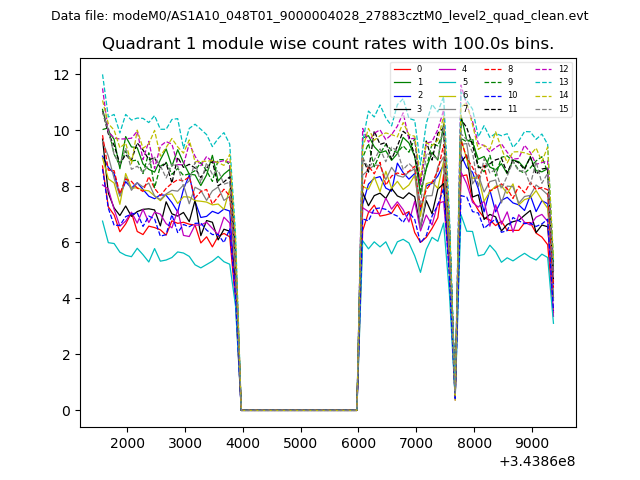
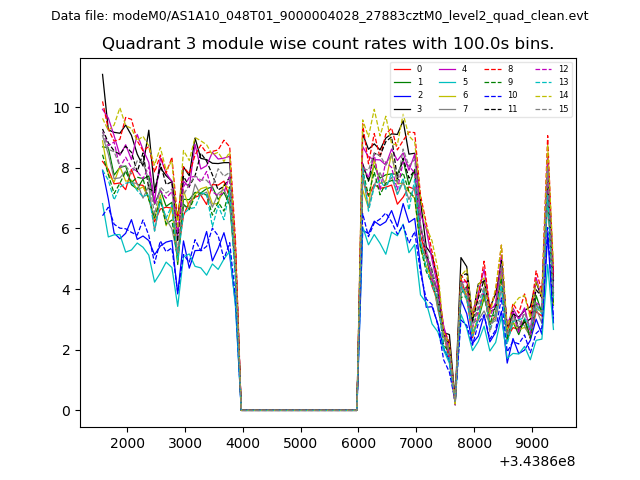
| Module-wise count rates for Quadrant A Data is divided into 100 sec bins |
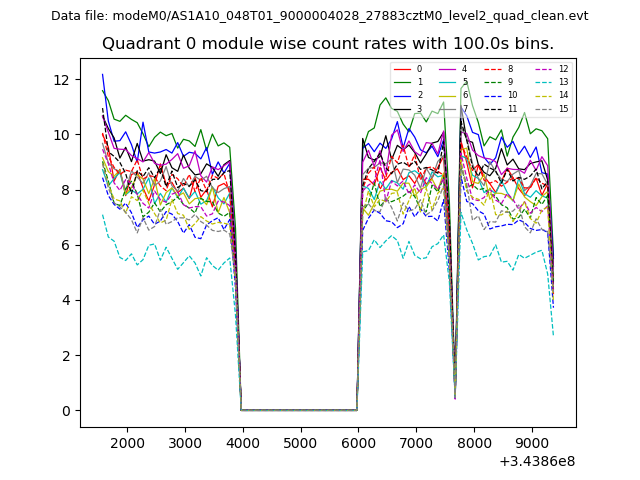 |
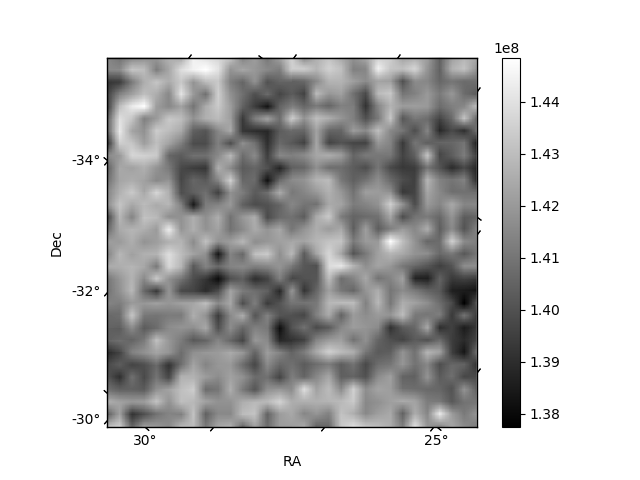 |
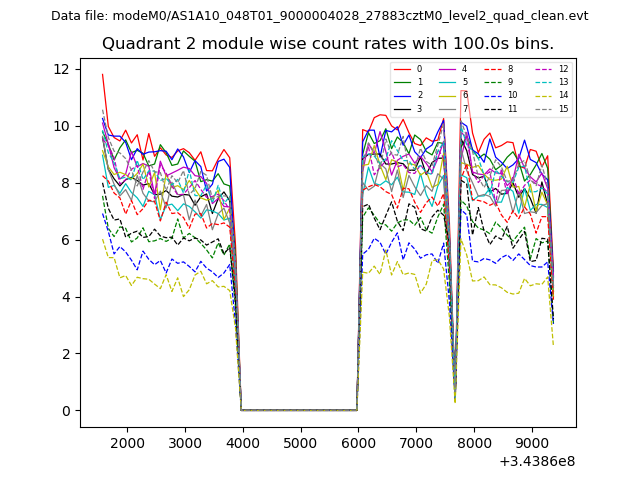
| Module-wise count rates for Quadrant B Data is divided into 100 sec bins |
 |
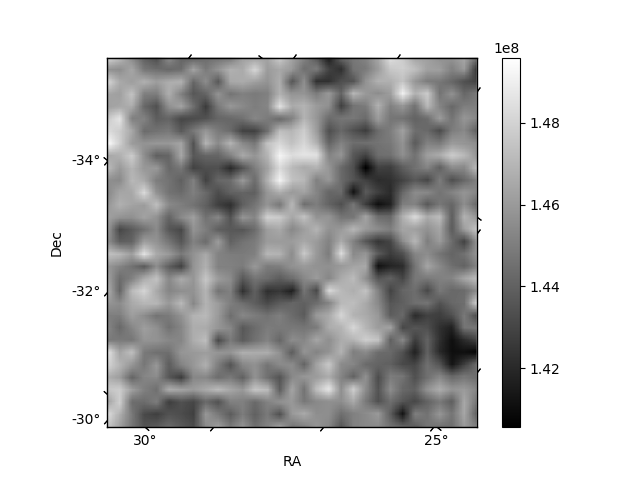 |
| Module-wise count rates for Quadrant C Data is divided into 100 sec bins |
 |
 |
| Module-wise count rates for Quadrant D Data is divided into 100 sec bins |
 |
 |
| Parameter | Plot |
|---|---|
| CZT HV Monitor | 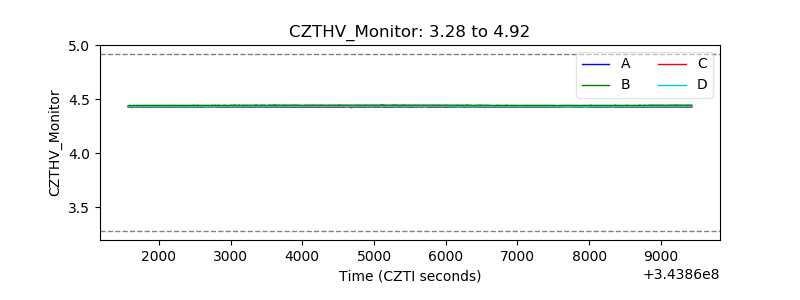 |
| D_VDD | 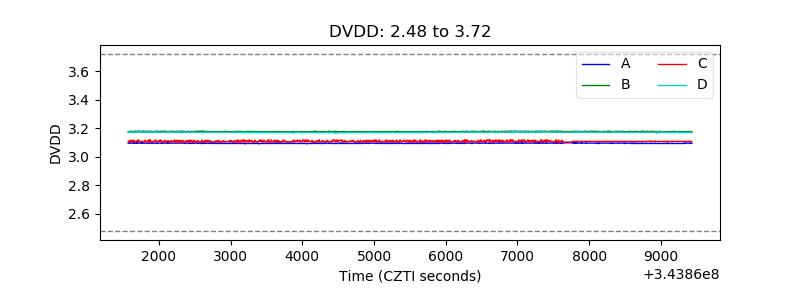 |
| Temperature 1 | 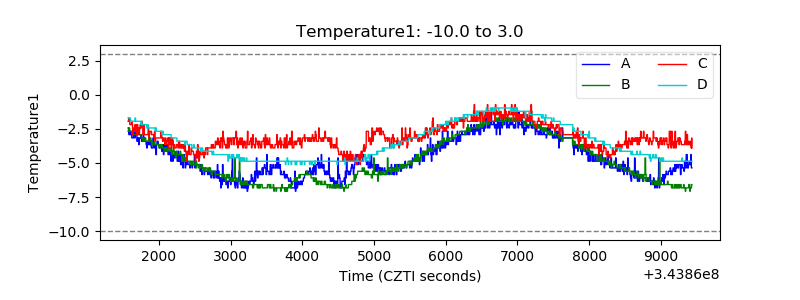 |
| Veto HV Monitor | 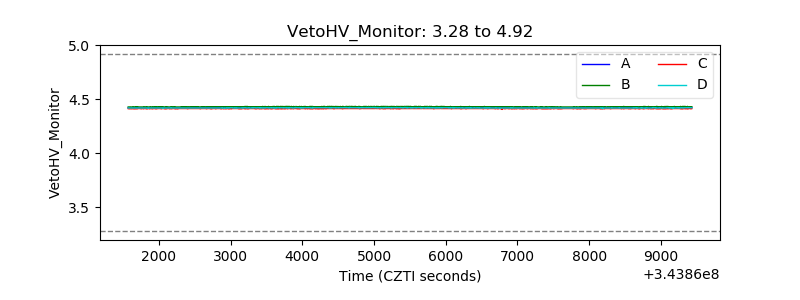 |
| Veto LLD | 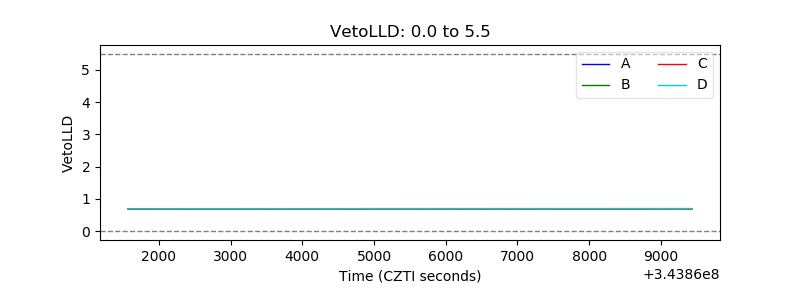 |
| Alpha Counter | 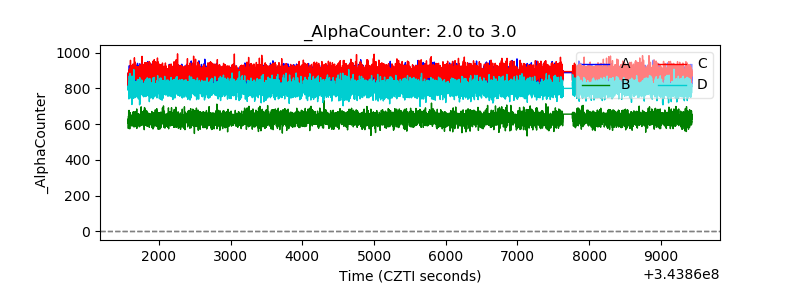 |
| _CPM_Rate | 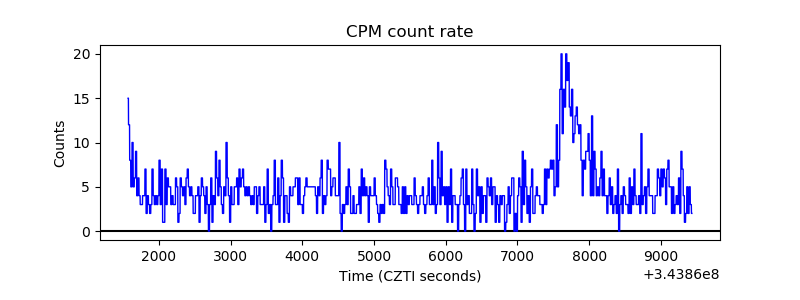 |
| CZT Counter | 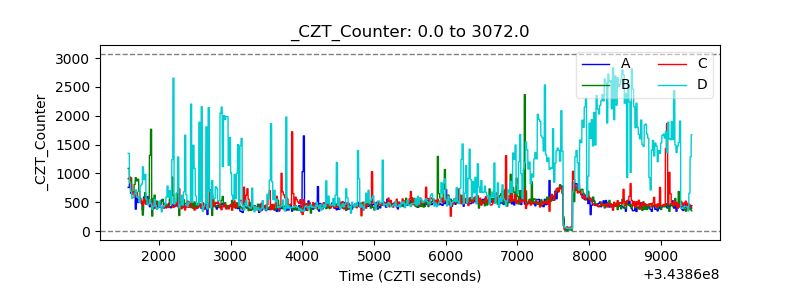 |
| +2.5 Volts monitor | 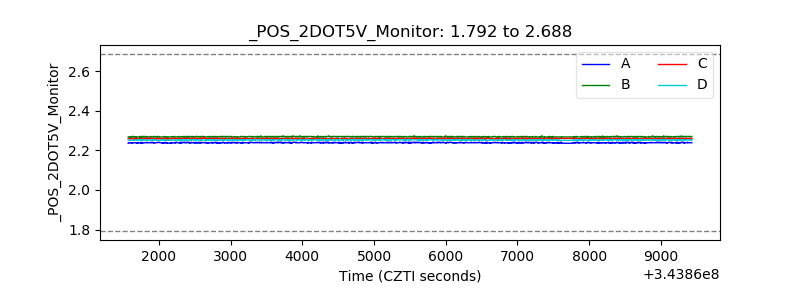 |
| +5 Volts monitor | 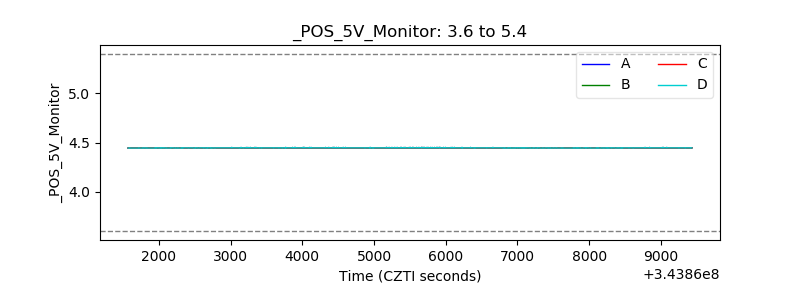 |
| _ROLL_ROT | 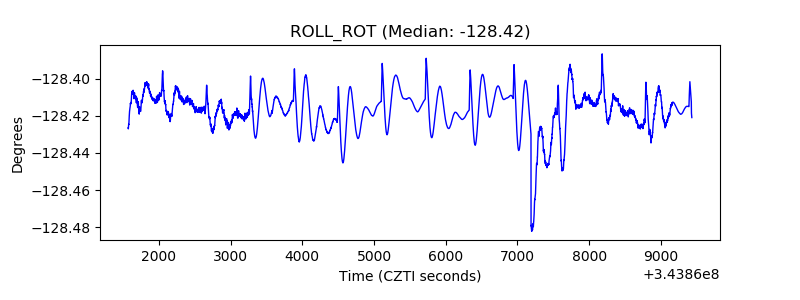 |
| _Roll_DEC | 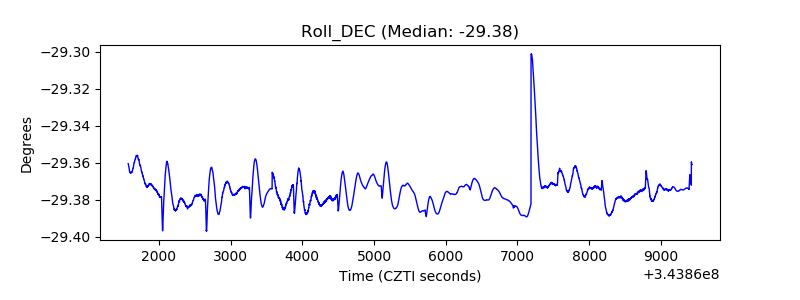 |
| _Roll_RA | 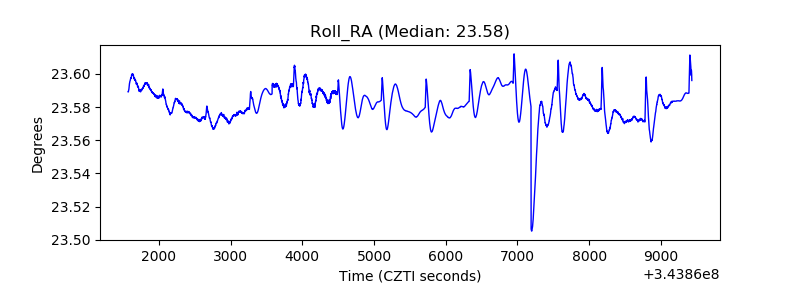 |
| Veto Counter | 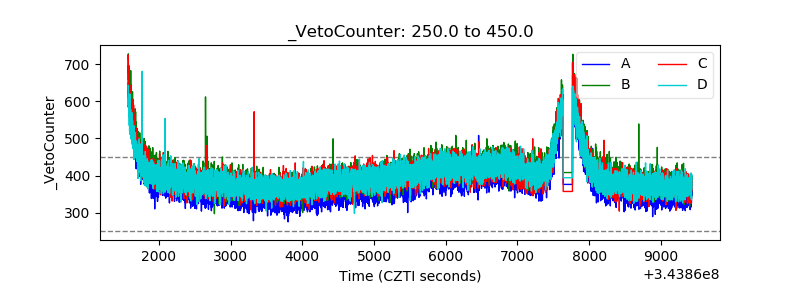 |