| Param | Original file | Final file |
|---|---|---|
| Filename | modeM0/AS1A10_048T01_9000004028_27884cztM0_level2.evt | modeM0/AS1A10_048T01_9000004028_27884cztM0_level2_quad_clean.evt |
| Size (bytes) | 709,191,360 | 106,608,960 |
| Size | 676.3 MB | 101.7 MB |
| Events in quadrant A | 3,759,733 | 741,635 |
| Events in quadrant B | 3,896,245 | 741,985 |
| Events in quadrant C | 4,284,109 | 691,536 |
| Events in quadrant D | 8,999,103 | 500,409 |
| Mode M0 | |||
|---|---|---|---|
| Quadrant | BADHDUFLAG | Total packets | Discarded packets |
| A | 0 | 16479 | 0 |
| B | 0 | 16854 | 0 |
| C | 0 | 17845 | 0 |
| D | 0 | 32114 | 0 |
| Mode M9 | |||
|---|---|---|---|
| Quadrant | BADHDUFLAG | Total packets | Discarded packets |
| A | 0 | 5 | 0 |
| B | 0 | 5 | 0 |
| C | 0 | 5 | 0 |
| D | 0 | 5 | 0 |
| Quadrant | Total seconds | Saturated seconds | Saturation percentage |
|---|---|---|---|
| A | 7941 | 76 | 0.957058% |
| B | 7942 | 138 | 1.737598% |
| C | 7942 | 197 | 2.480484% |
| D | 7941 | 3089 | 38.899383% |
Noise dominated data is calculated using 1-second bins in cleaned event files. If a bin has >2000 counts, and if more than 50% of those come from <1% of pixels, then it is considered to be noise-dominated and hence unusable.
| Quadrant | # 1 sec bins | Bins with >0 counts | Bins with >2000 counts | High rate bins dominated by noise | Noise dominated (total time) | Noise dominated (detector-on time) | Marked lightcurve |
|---|---|---|---|---|---|---|---|
| A | 8406 | 7943 | 4 | 4 | 0.05% | 0.05% | 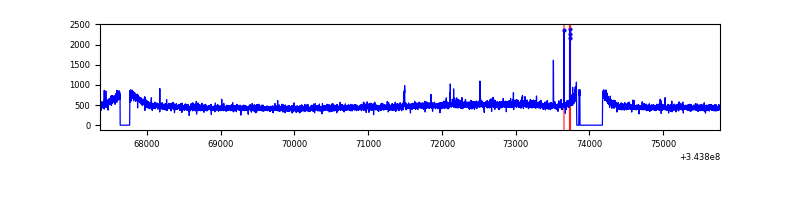 |
| B | 8407 | 7944 | 1 | 1 | 0.01% | 0.01% | 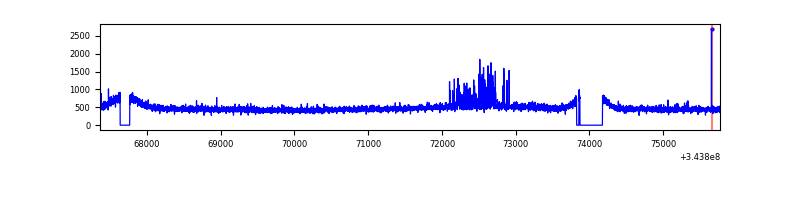 |
| C | 8407 | 7944 | 14 | 14 | 0.17% | 0.18% | 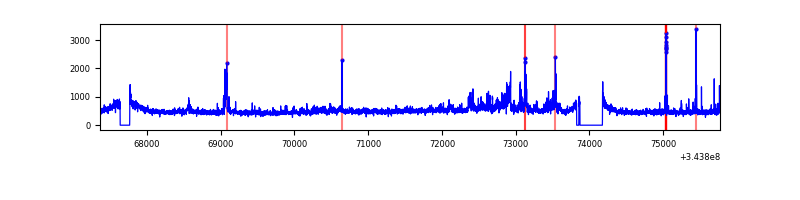 |
| D | 8405 | 7941 | 1106 | 1106 | 13.16% | 13.93% | 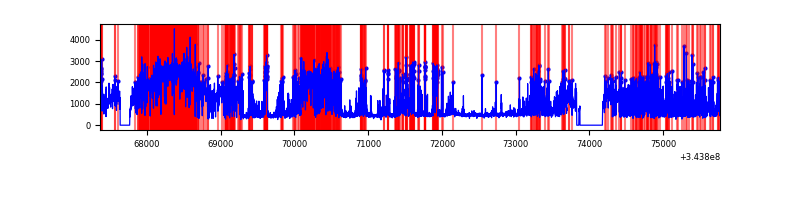 |
Top three noisy pixels from each quadrant. If the there are fewer than three noisy pixels in the level2.evt file, extra rows are filled as -1
| Pixel properties | Quadrant properties | ||||||
|---|---|---|---|---|---|---|---|
| Quadrant | DetID | PixID | Counts | Sigma | Mean | Median | Sigma |
| A | 4 | 2 | 27256 | 135.11 | 962 | 939 | 194.8 |
| A | 13 | 254 | 13176 | 62.83 | 962 | 939 | 194.8 |
| A | 5 | 98 | 10534 | 49.26 | 962 | 939 | 194.8 |
| B | 0 | 230 | 109611 | 582.72 | 959 | 933 | 186.5 |
| B | 12 | 111 | 23051 | 118.59 | 959 | 933 | 186.5 |
| B | 11 | 111 | 20783 | 106.43 | 959 | 933 | 186.5 |
| C | 3 | 233 | 473056 | 2199.82 | 915 | 920 | 214.6 |
| C | 14 | 238 | 144363 | 668.34 | 915 | 920 | 214.6 |
| C | 2 | 16 | 97423 | 449.64 | 915 | 920 | 214.6 |
| D | 7 | 238 | 5498348 | 31143.03 | 725 | 704 | 176.5 |
| D | 1 | 52 | 621563 | 3517.04 | 725 | 704 | 176.5 |
| D | 2 | 250 | 114702 | 645.78 | 725 | 704 | 176.5 |
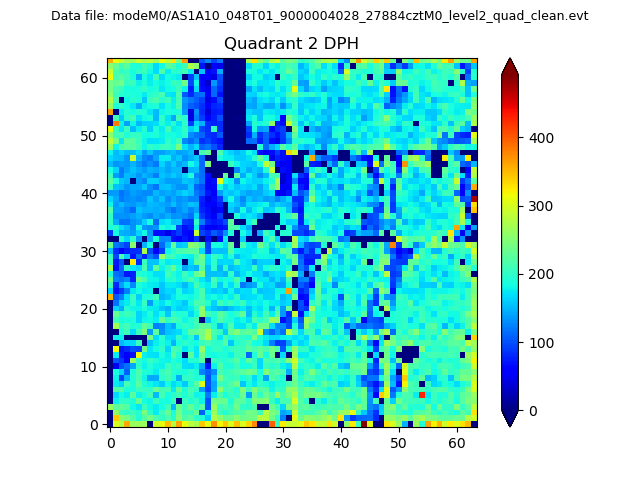
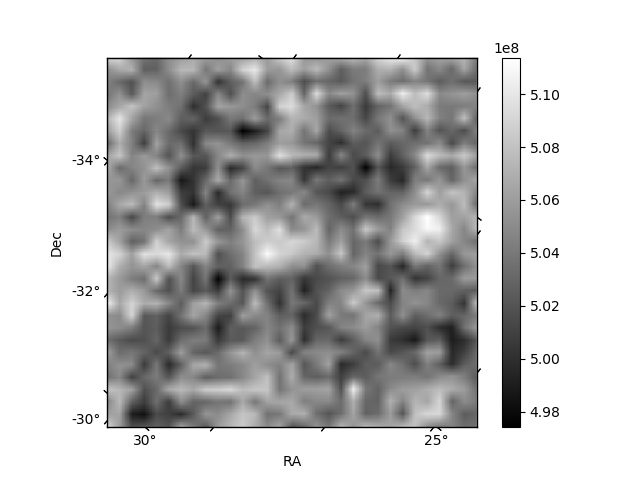
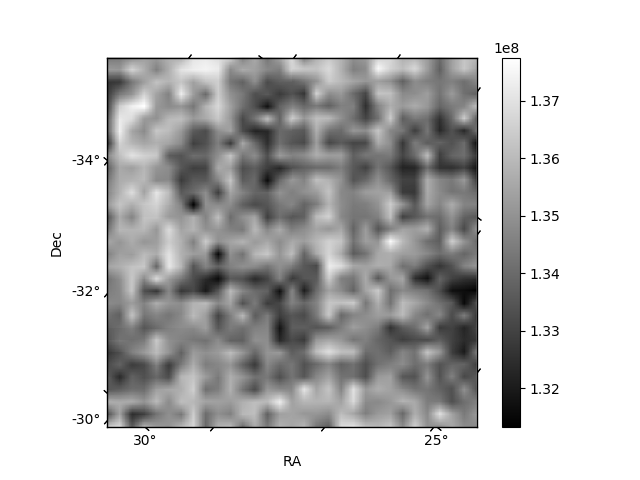
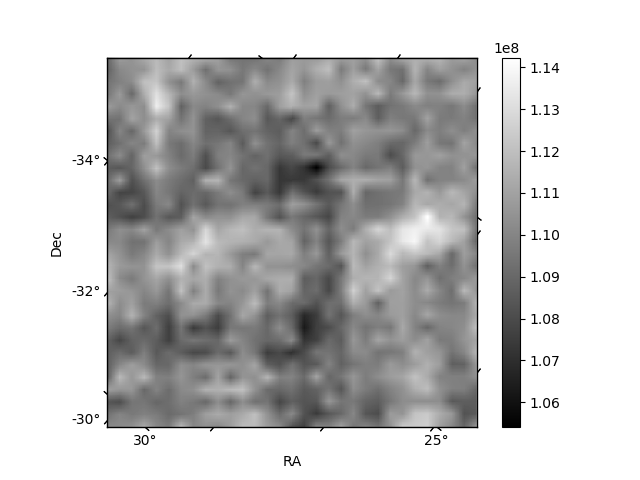
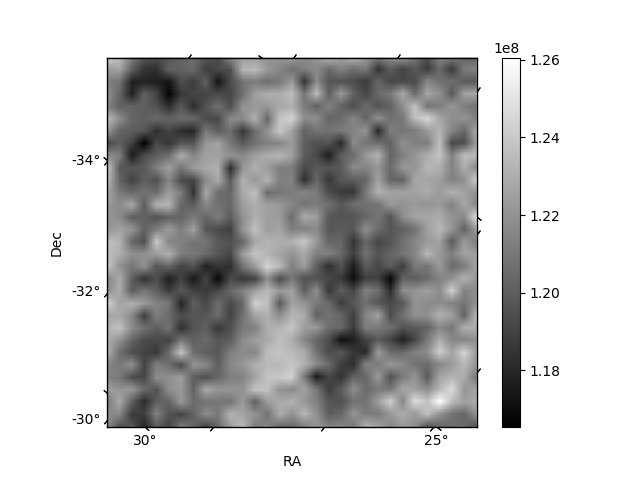
Histogram calculated using DETX and DETY for each event in the final _common_clean file
| Quadrant A | 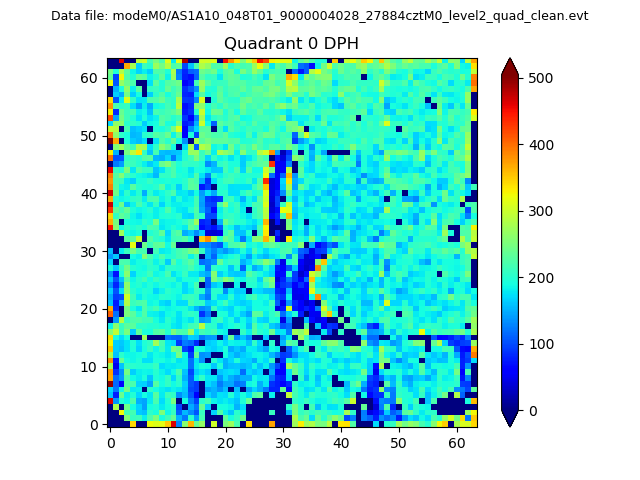 |
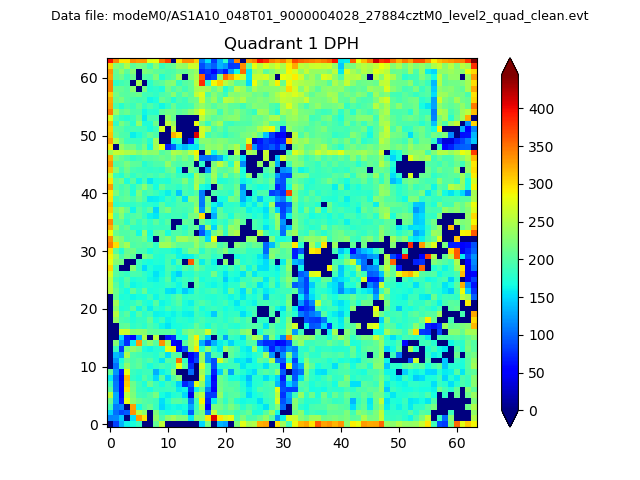 |
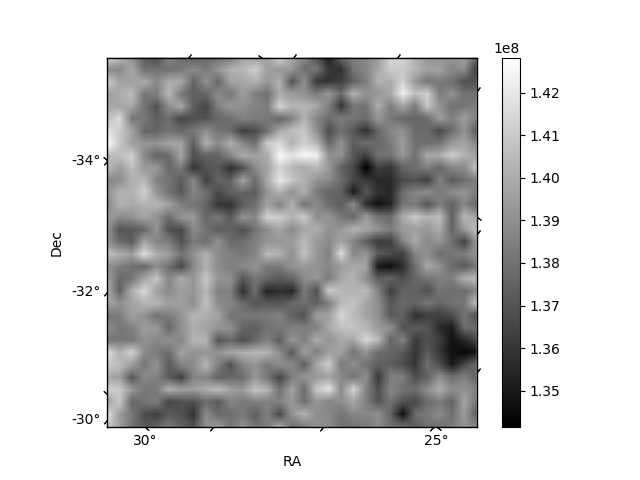
Quadrant B |
|---|---|---|---|
| Quadrant D | 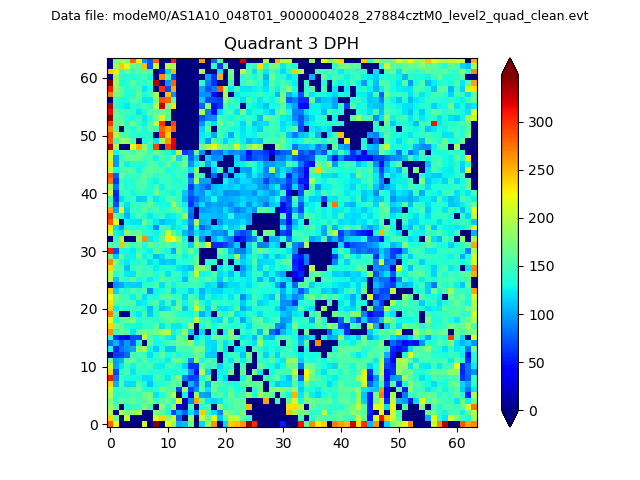 |
 |
Quadrant C |
| Plot type | Count rate plots | Images |
|---|---|---|
| Comparison with Poisson distribution Blue bars denote a histogram of data divided into 1 sec bins. Red curve is a Poisson curve with rate = median count rate of data. |
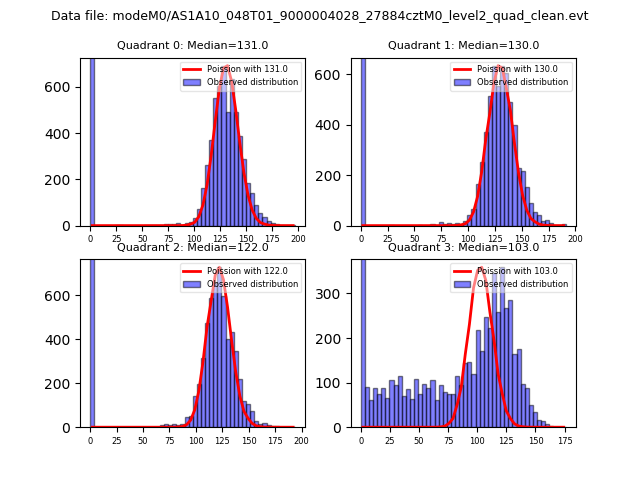 |
 |
| Quadrant-wise count rates Data is divided into 100 sec bins |
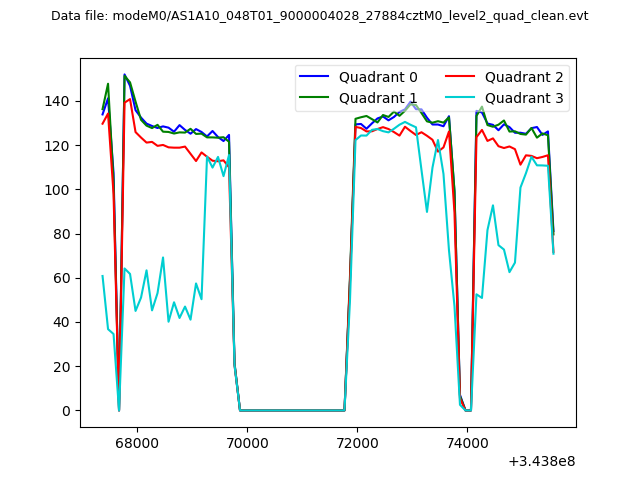 |
|
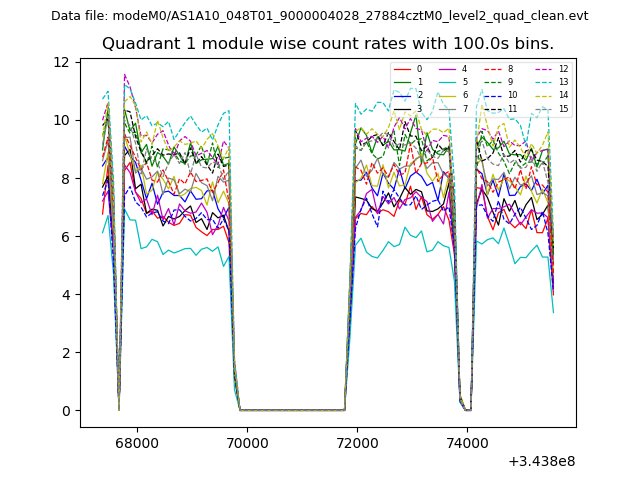
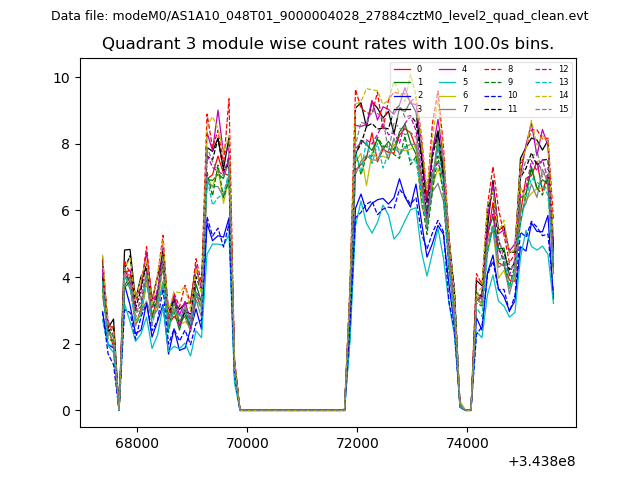
| Module-wise count rates for Quadrant A Data is divided into 100 sec bins |
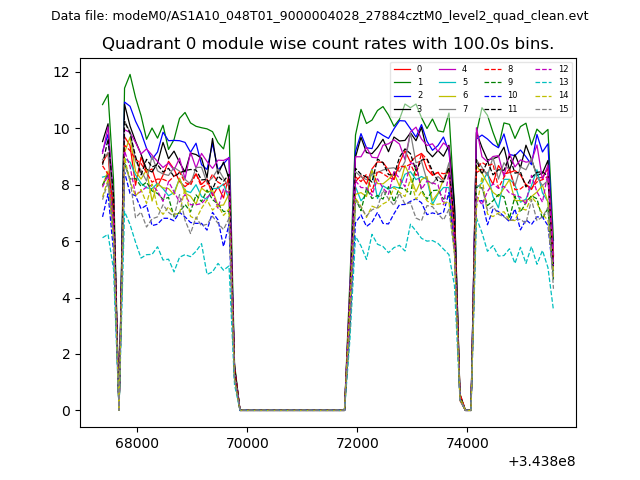 |
 |
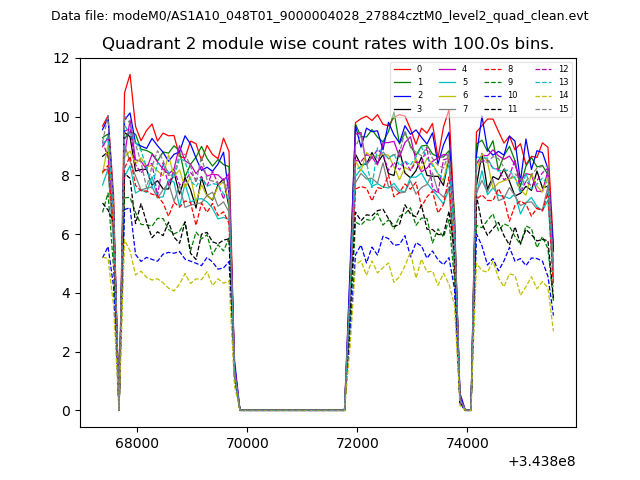
| Module-wise count rates for Quadrant B Data is divided into 100 sec bins |
 |
 |
| Module-wise count rates for Quadrant C Data is divided into 100 sec bins |
 |
 |
| Module-wise count rates for Quadrant D Data is divided into 100 sec bins |
 |
 |
| Parameter | Plot |
|---|---|
| CZT HV Monitor | 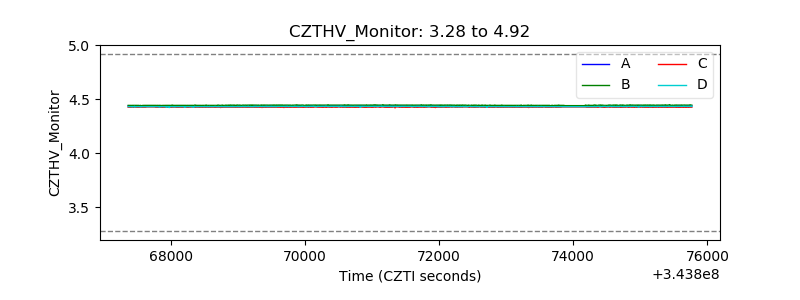 |
| D_VDD | 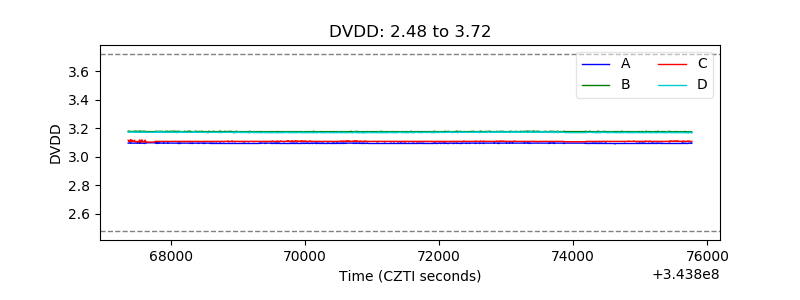 |
| Temperature 1 | 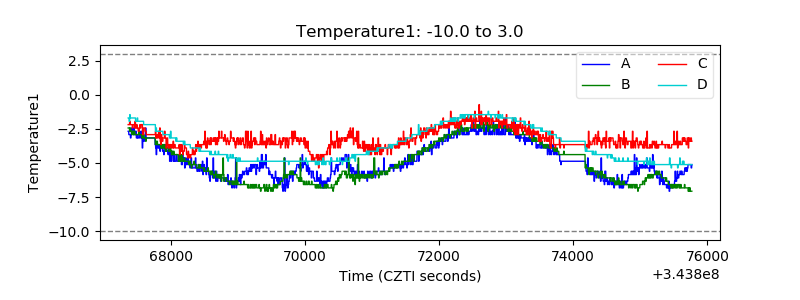 |
| Veto HV Monitor | 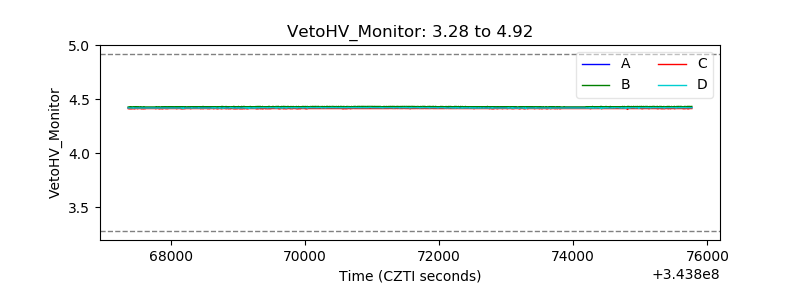 |
| Veto LLD | 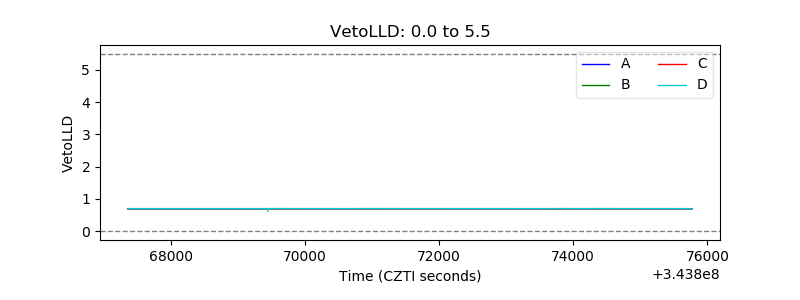 |
| Alpha Counter | 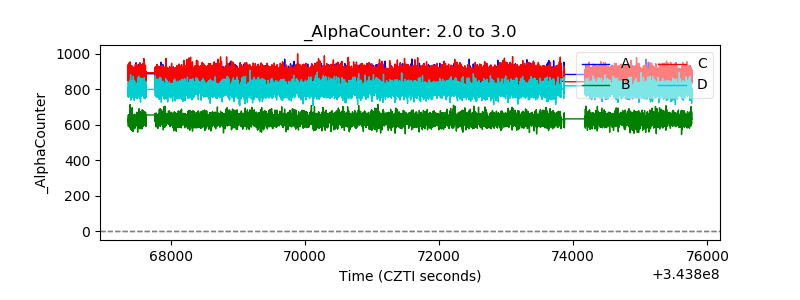 |
| _CPM_Rate | 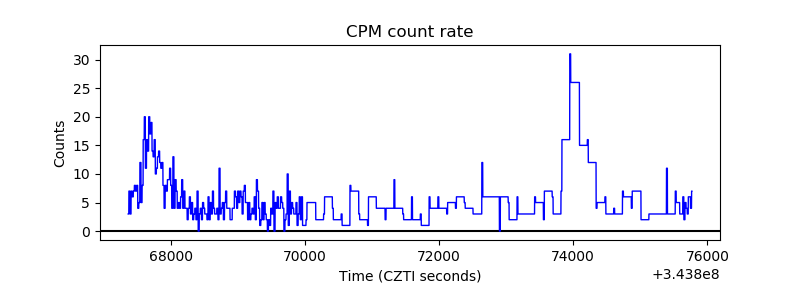 |
| CZT Counter | 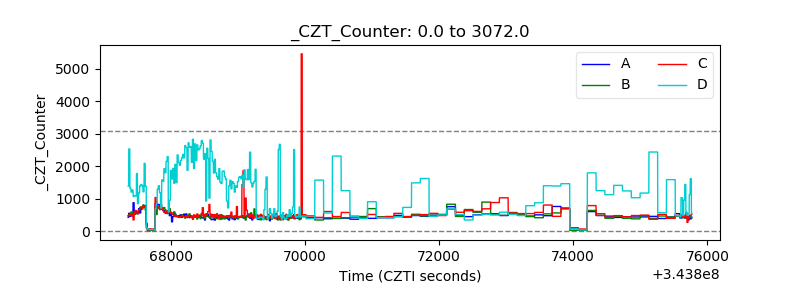 |
| +2.5 Volts monitor | 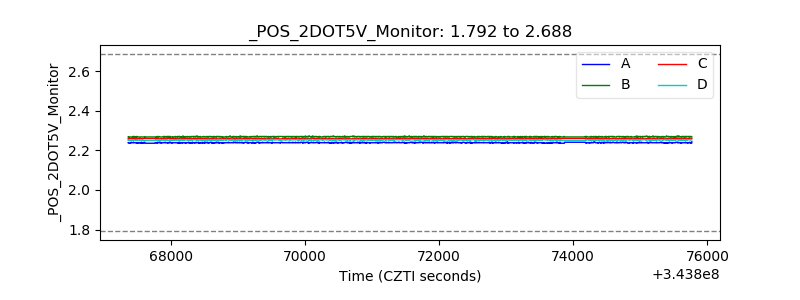 |
| +5 Volts monitor |  |
| _ROLL_ROT | 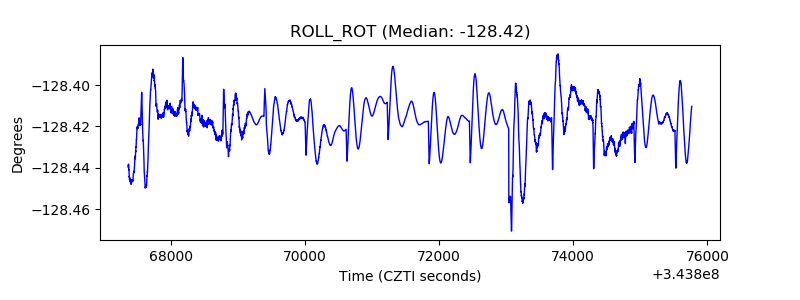 |
| _Roll_DEC | 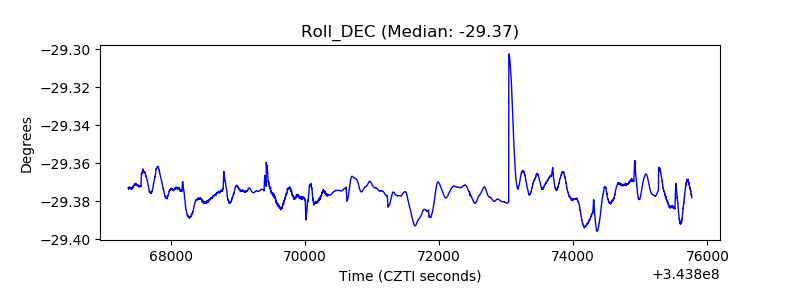 |
| _Roll_RA | 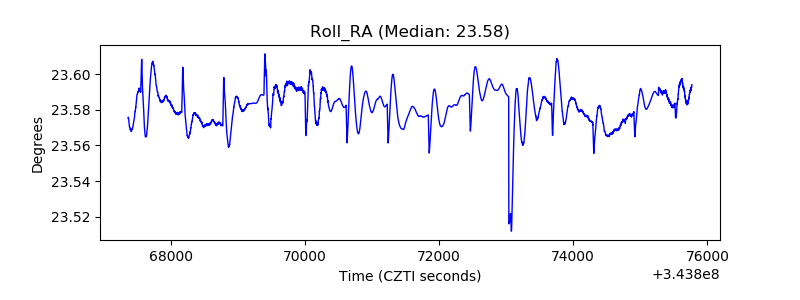 |
| Veto Counter | 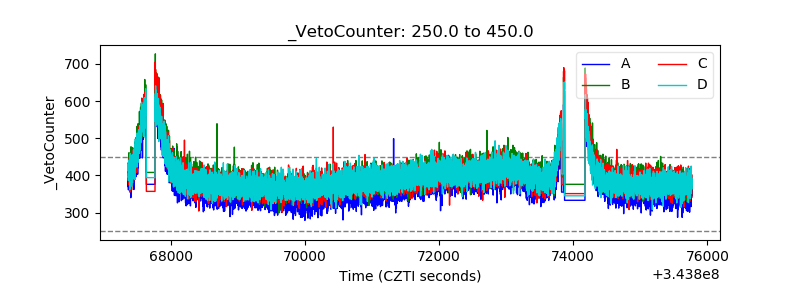 |