| Param | Original file | Final file |
|---|---|---|
| Filename | modeM0/AS1A10_048T01_9000004028_27887cztM0_level2.evt | modeM0/AS1A10_048T01_9000004028_27887cztM0_level2_quad_clean.evt |
| Size (bytes) | 1,304,262,720 | 210,928,320 |
| Size | 1.2 GB | 201.2 MB |
| Events in quadrant A | 8,705,024 | 1,331,096 |
| Events in quadrant B | 8,607,247 | 1,339,750 |
| Events in quadrant C | 8,887,963 | 1,262,248 |
| Events in quadrant D | 12,072,251 | 1,203,497 |
| Mode M0 | |||
|---|---|---|---|
| Quadrant | BADHDUFLAG | Total packets | Discarded packets |
| A | 0 | 37700 | 0 |
| B | 0 | 37111 | 0 |
| C | 0 | 37575 | 0 |
| D | 0 | 47946 | 0 |
| Mode M9 | |||
|---|---|---|---|
| Quadrant | BADHDUFLAG | Total packets | Discarded packets |
| A | 0 | 20 | 0 |
| B | 0 | 20 | 0 |
| C | 0 | 20 | 0 |
| D | 0 | 20 | 0 |
| Quadrant | Total seconds | Saturated seconds | Saturation percentage |
|---|---|---|---|
| A | 18149 | 96 | 0.528955% |
| B | 18149 | 135 | 0.743843% |
| C | 18149 | 243 | 1.338917% |
| D | 18149 | 1282 | 7.063750% |
Noise dominated data is calculated using 1-second bins in cleaned event files. If a bin has >2000 counts, and if more than 50% of those come from <1% of pixels, then it is considered to be noise-dominated and hence unusable.
| Quadrant | # 1 sec bins | Bins with >0 counts | Bins with >2000 counts | High rate bins dominated by noise | Noise dominated (total time) | Noise dominated (detector-on time) | Marked lightcurve |
|---|---|---|---|---|---|---|---|
| A | 20134 | 18149 | 0 | 0 | 0.00% | 0.00% | 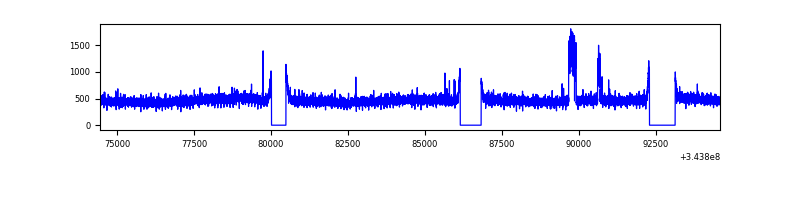 |
| B | 20134 | 18149 | 1 | 1 | 0.00% | 0.01% | 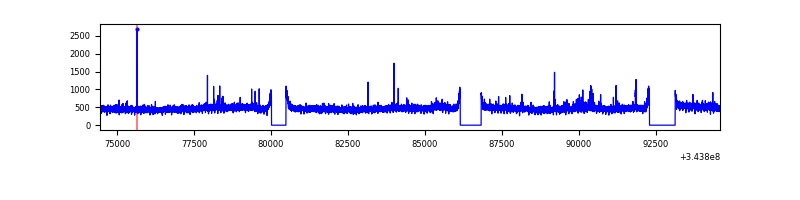 |
| C | 20134 | 18149 | 9 | 9 | 0.04% | 0.05% | 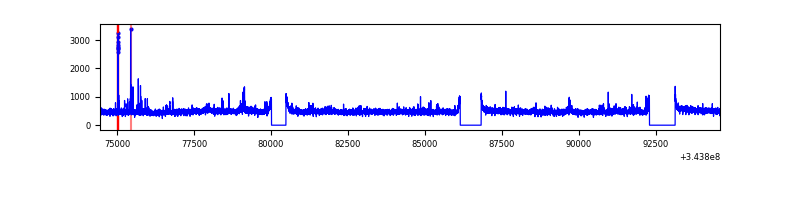 |
| D | 20134 | 18149 | 395 | 395 | 1.96% | 2.18% | 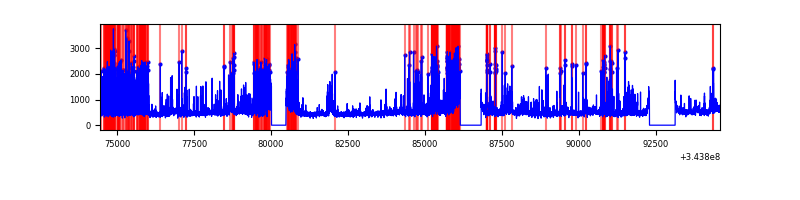 |
Top three noisy pixels from each quadrant. If the there are fewer than three noisy pixels in the level2.evt file, extra rows are filled as -1
| Pixel properties | Quadrant properties | ||||||
|---|---|---|---|---|---|---|---|
| Quadrant | DetID | PixID | Counts | Sigma | Mean | Median | Sigma |
| A | 6 | 16 | 284371 | 644.1 | 2181 | 2138 | 438.2 |
| A | 13 | 254 | 29462 | 62.36 | 2181 | 2138 | 438.2 |
| A | 3 | 137 | 21463 | 44.1 | 2181 | 2138 | 438.2 |
| B | 10 | 245 | 74834 | 174.67 | 2167 | 2112 | 416.3 |
| B | 12 | 111 | 52486 | 120.99 | 2167 | 2112 | 416.3 |
| B | 11 | 111 | 47434 | 108.86 | 2167 | 2112 | 416.3 |
| C | 14 | 238 | 330446 | 670.17 | 2086 | 2095 | 490.0 |
| C | 3 | 233 | 316294 | 641.29 | 2086 | 2095 | 490.0 |
| C | 2 | 16 | 94890 | 189.4 | 2086 | 2095 | 490.0 |
| D | 7 | 238 | 2464159 | 5026.55 | 2046 | 1991 | 489.8 |
| D | 1 | 52 | 1724156 | 3515.82 | 2046 | 1991 | 489.8 |
| D | 7 | 80 | 82895 | 165.17 | 2046 | 1991 | 489.8 |
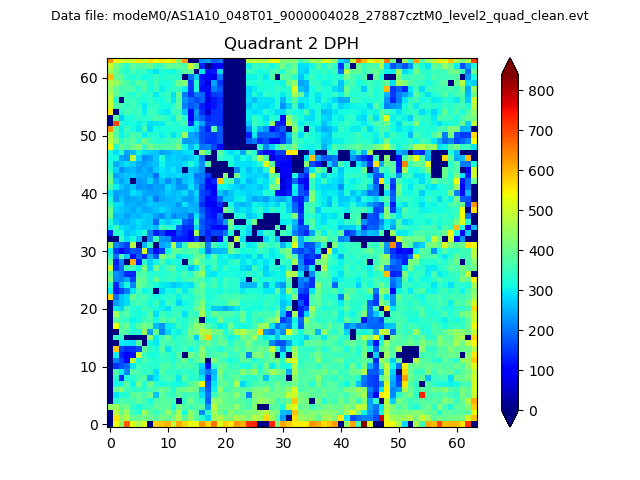
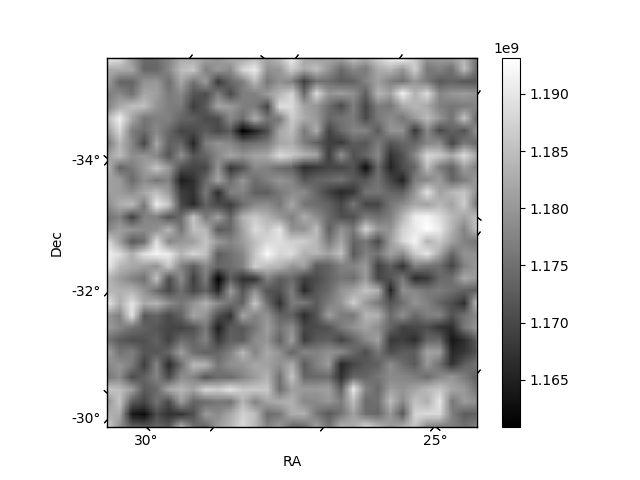
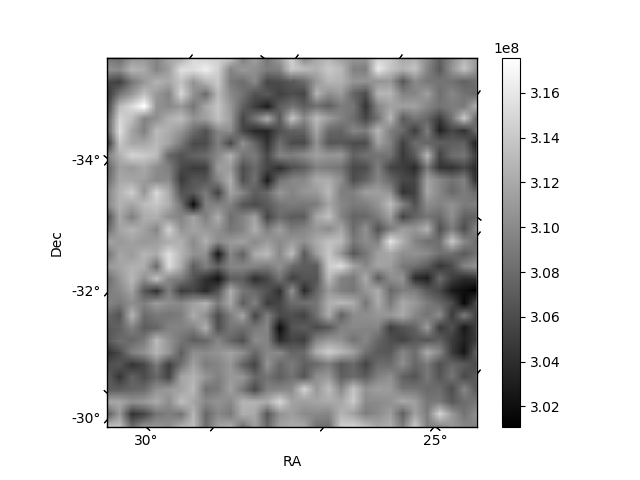
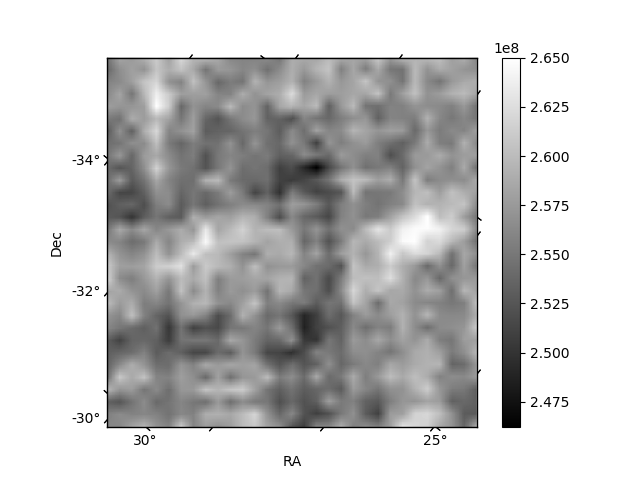
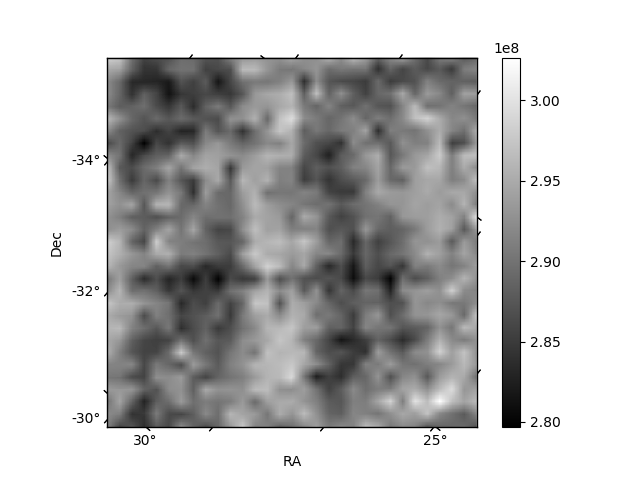
Histogram calculated using DETX and DETY for each event in the final _common_clean file
| Quadrant A | 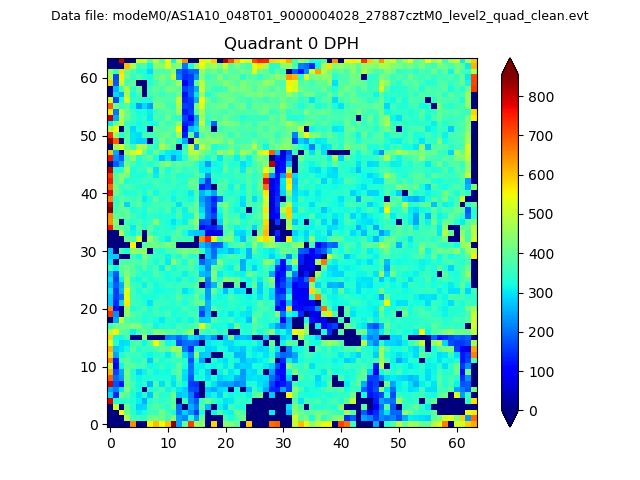 |
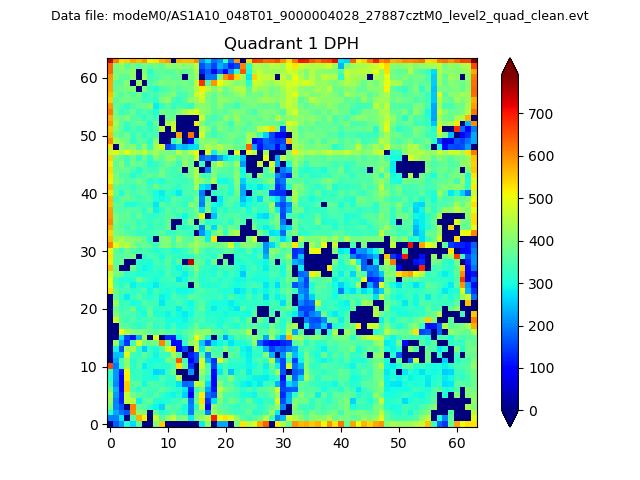 |
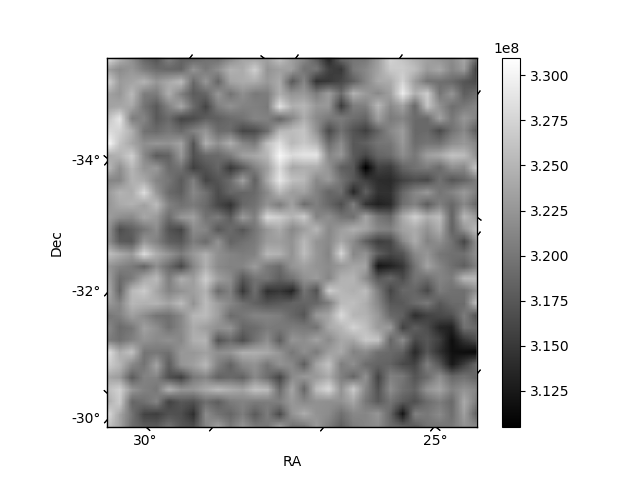
Quadrant B |
|---|---|---|---|
| Quadrant D | 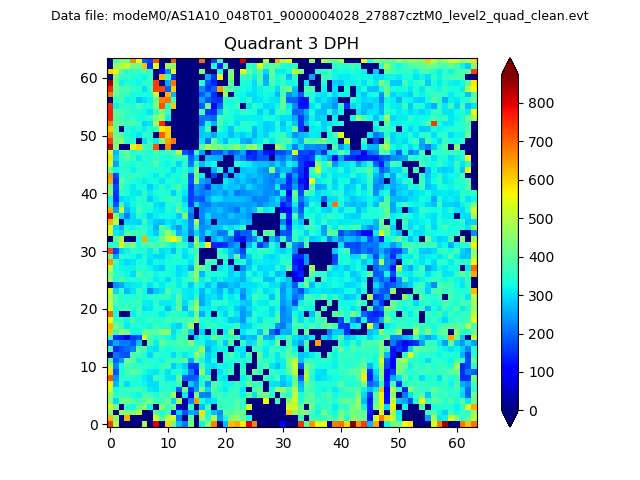 |
 |
Quadrant C |
| Plot type | Count rate plots | Images |
|---|---|---|
| Comparison with Poisson distribution Blue bars denote a histogram of data divided into 1 sec bins. Red curve is a Poisson curve with rate = median count rate of data. |
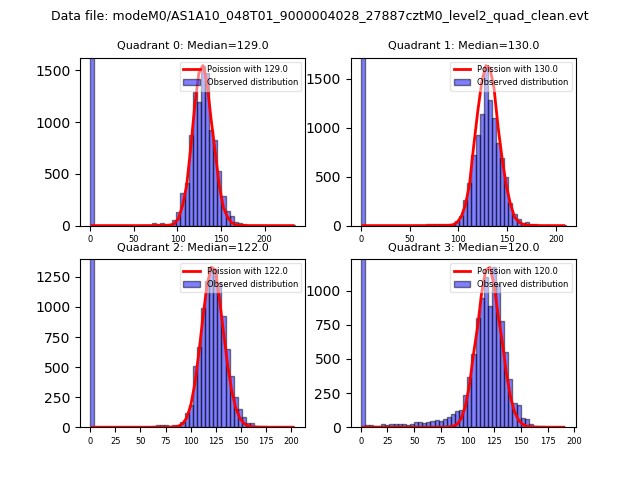 |
 |
| Quadrant-wise count rates Data is divided into 100 sec bins |
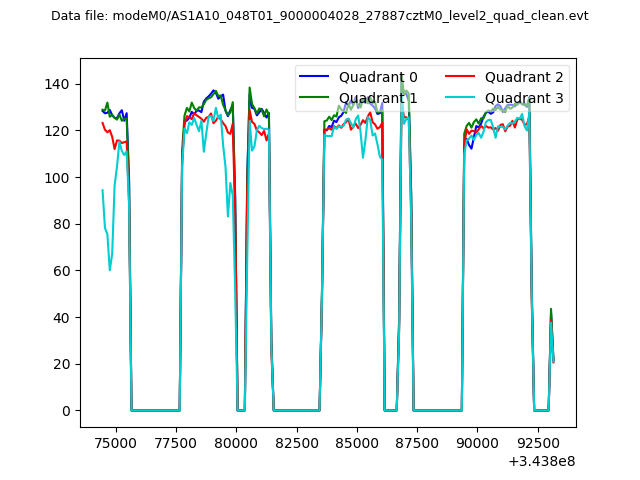 |
|
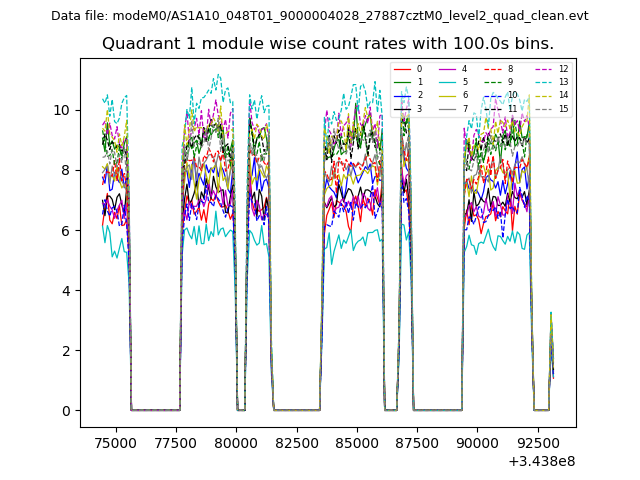
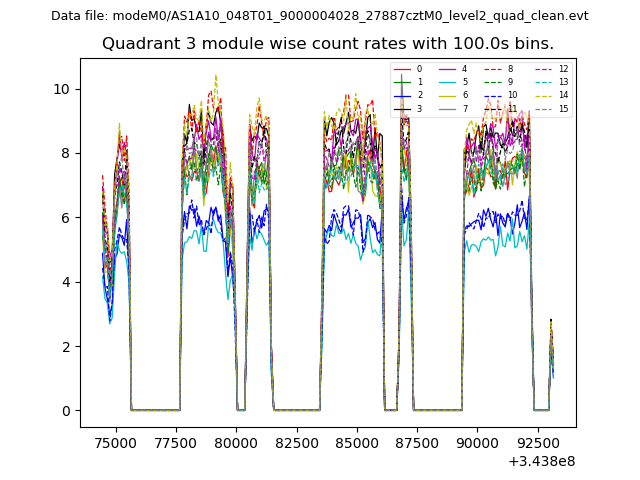
| Module-wise count rates for Quadrant A Data is divided into 100 sec bins |
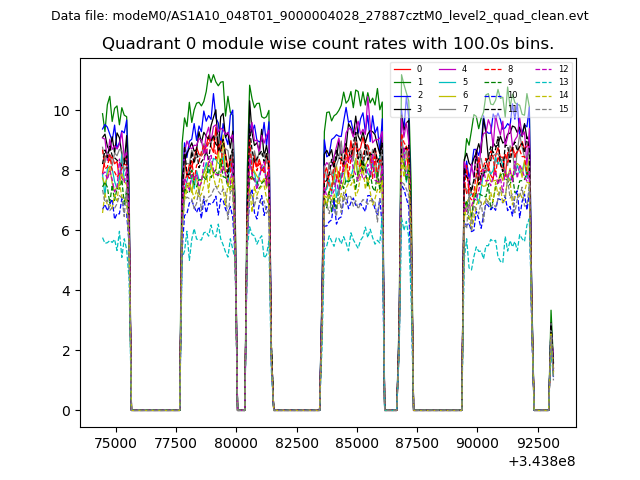 |
 |
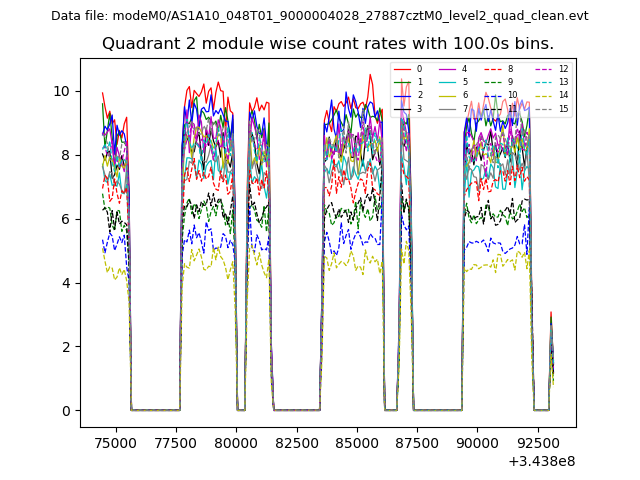
| Module-wise count rates for Quadrant B Data is divided into 100 sec bins |
 |
 |
| Module-wise count rates for Quadrant C Data is divided into 100 sec bins |
 |
 |
| Module-wise count rates for Quadrant D Data is divided into 100 sec bins |
 |
 |
| Parameter | Plot |
|---|---|
| CZT HV Monitor | 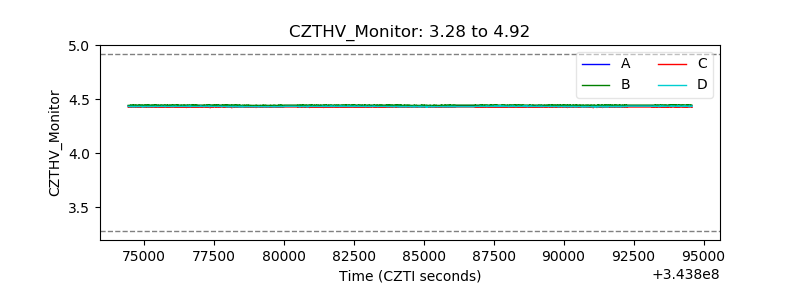 |
| D_VDD | 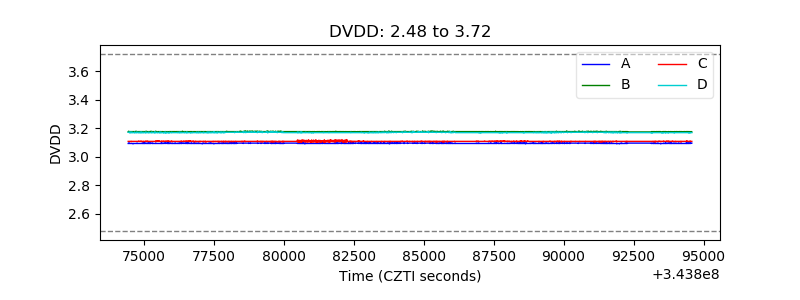 |
| Temperature 1 | 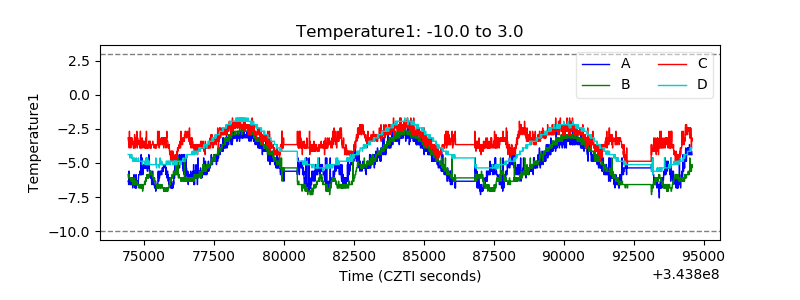 |
| Veto HV Monitor |  |
| Veto LLD | 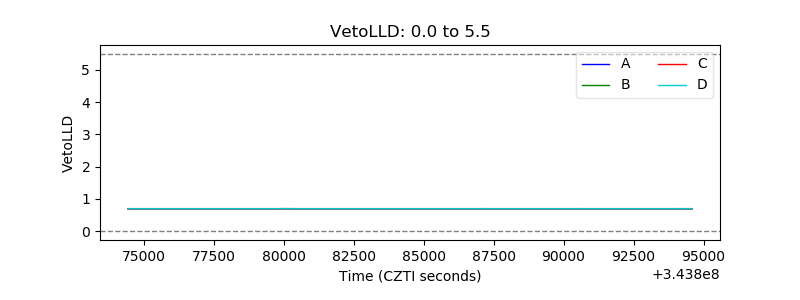 |
| Alpha Counter | 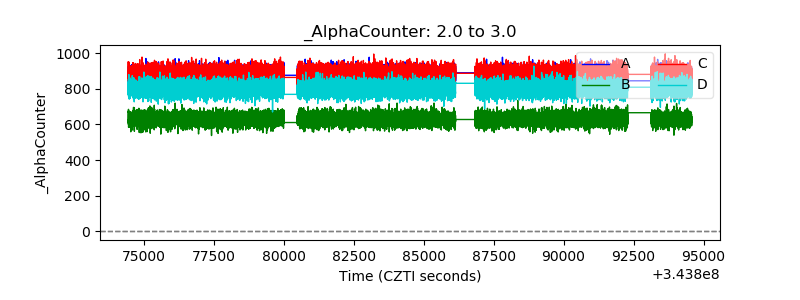 |
| _CPM_Rate | 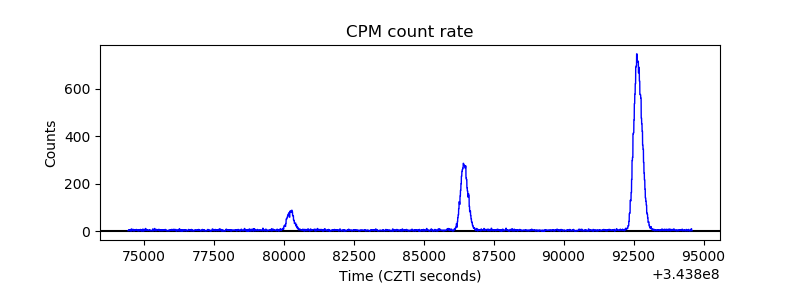 |
| CZT Counter | 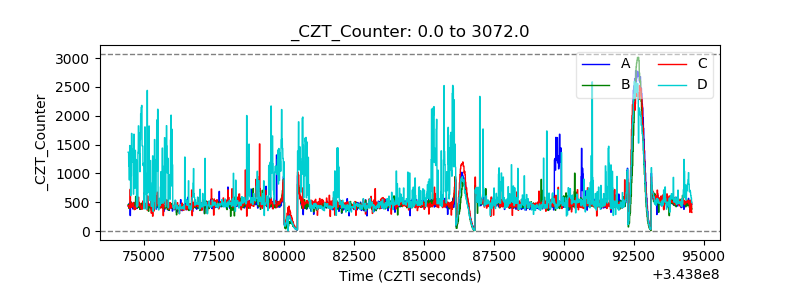 |
| +2.5 Volts monitor | 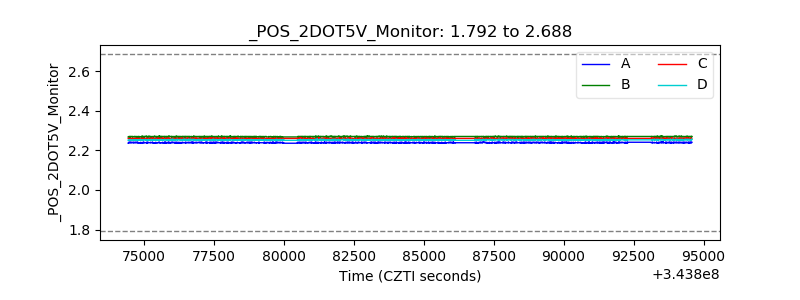 |
| +5 Volts monitor |  |
| _ROLL_ROT | 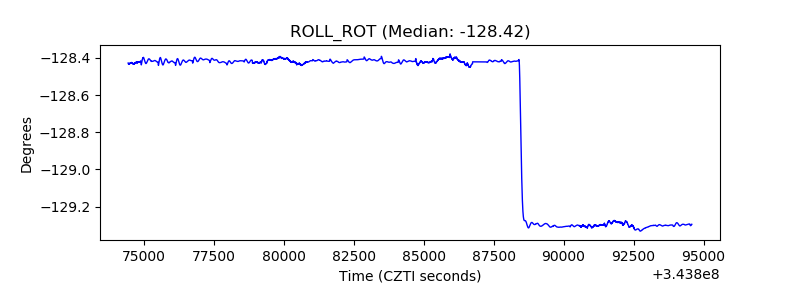 |
| _Roll_DEC | 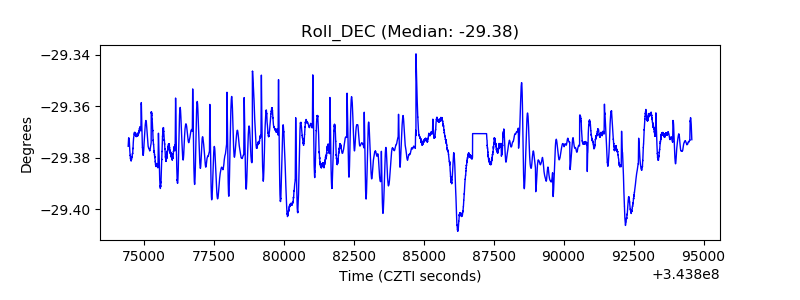 |
| _Roll_RA | 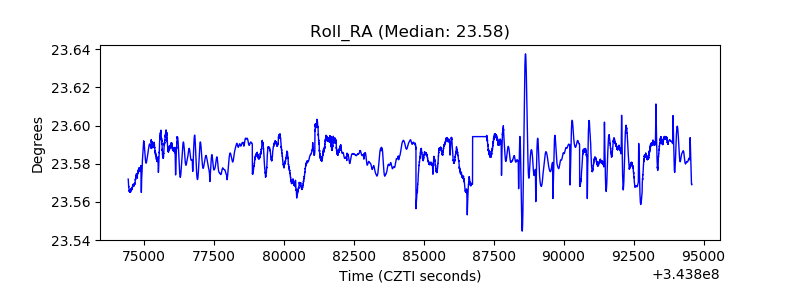 |
| Veto Counter | 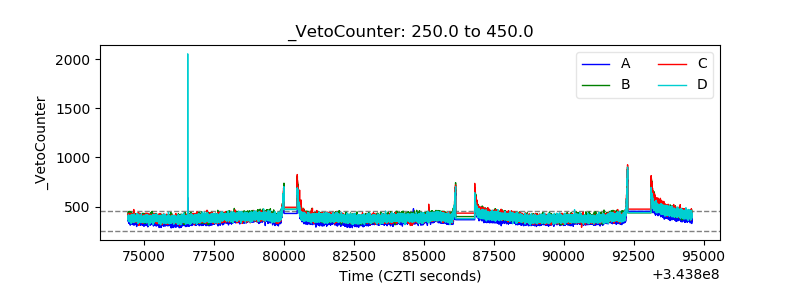 |