| Param | Original file | Final file |
|---|---|---|
| Filename | modeM0/AS1A10_048T01_9000004028_27888cztM0_level2.evt | modeM0/AS1A10_048T01_9000004028_27888cztM0_level2_quad_clean.evt |
| Size (bytes) | 487,719,360 | 66,873,600 |
| Size | 465.1 MB | 63.8 MB |
| Events in quadrant A | 3,367,136 | 402,368 |
| Events in quadrant B | 3,317,406 | 403,194 |
| Events in quadrant C | 3,284,665 | 386,080 |
| Events in quadrant D | 4,353,521 | 372,960 |
| Mode M0 | |||
|---|---|---|---|
| Quadrant | BADHDUFLAG | Total packets | Discarded packets |
| A | 0 | 14253 | 0 |
| B | 0 | 13883 | 0 |
| C | 0 | 13934 | 0 |
| D | 0 | 17343 | 0 |
| Mode M9 | |||
|---|---|---|---|
| Quadrant | BADHDUFLAG | Total packets | Discarded packets |
| A | 0 | 10 | 0 |
| B | 0 | 10 | 0 |
| C | 0 | 10 | 0 |
| D | 0 | 10 | 0 |
| Quadrant | Total seconds | Saturated seconds | Saturation percentage |
|---|---|---|---|
| A | 6604 | 52 | 0.787402% |
| B | 6605 | 67 | 1.014383% |
| C | 6605 | 109 | 1.650265% |
| D | 6604 | 233 | 3.528165% |
Noise dominated data is calculated using 1-second bins in cleaned event files. If a bin has >2000 counts, and if more than 50% of those come from <1% of pixels, then it is considered to be noise-dominated and hence unusable.
| Quadrant | # 1 sec bins | Bins with >0 counts | Bins with >2000 counts | High rate bins dominated by noise | Noise dominated (total time) | Noise dominated (detector-on time) | Marked lightcurve |
|---|---|---|---|---|---|---|---|
| A | 7584 | 6604 | 0 | 0 | 0.00% | 0.00% | 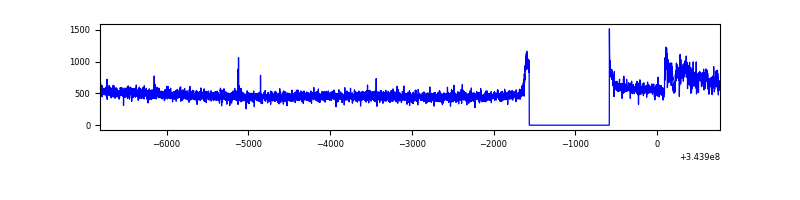 |
| B | 7585 | 6605 | 3 | 3 | 0.04% | 0.05% | 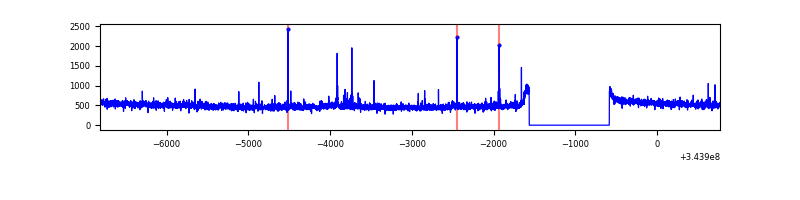 |
| C | 7585 | 6605 | 0 | 0 | 0.00% | 0.00% | 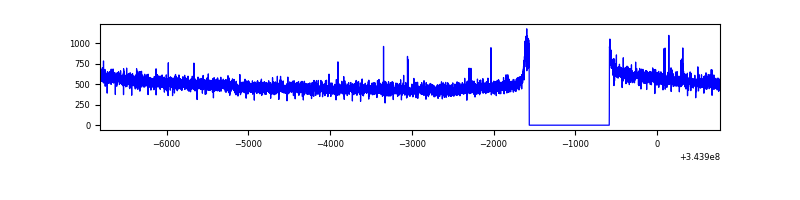 |
| D | 7584 | 6604 | 85 | 85 | 1.12% | 1.29% | 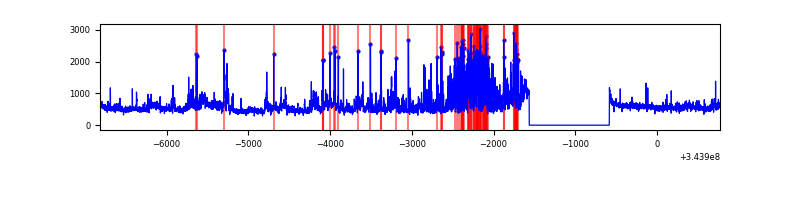 |
Top three noisy pixels from each quadrant. If the there are fewer than three noisy pixels in the level2.evt file, extra rows are filled as -1
| Pixel properties | Quadrant properties | ||||||
|---|---|---|---|---|---|---|---|
| Quadrant | DetID | PixID | Counts | Sigma | Mean | Median | Sigma |
| A | 6 | 16 | 169080 | 1008.75 | 827 | 811 | 166.8 |
| A | 13 | 254 | 10092 | 55.64 | 827 | 811 | 166.8 |
| A | 3 | 137 | 7918 | 42.61 | 827 | 811 | 166.8 |
| B | 10 | 245 | 51682 | 323.65 | 825 | 805 | 157.2 |
| B | 0 | 230 | 29399 | 181.9 | 825 | 805 | 157.2 |
| B | 12 | 111 | 19480 | 118.8 | 825 | 805 | 157.2 |
| C | 14 | 238 | 127876 | 682.93 | 797 | 803 | 186.1 |
| C | 3 | 233 | 40154 | 211.49 | 797 | 803 | 186.1 |
| C | 15 | 208 | 6368 | 29.91 | 797 | 803 | 186.1 |
| D | 7 | 238 | 691111 | 3643.06 | 795 | 774 | 189.5 |
| D | 1 | 52 | 603626 | 3181.39 | 795 | 774 | 189.5 |
| D | 7 | 80 | 35245 | 181.91 | 795 | 774 | 189.5 |
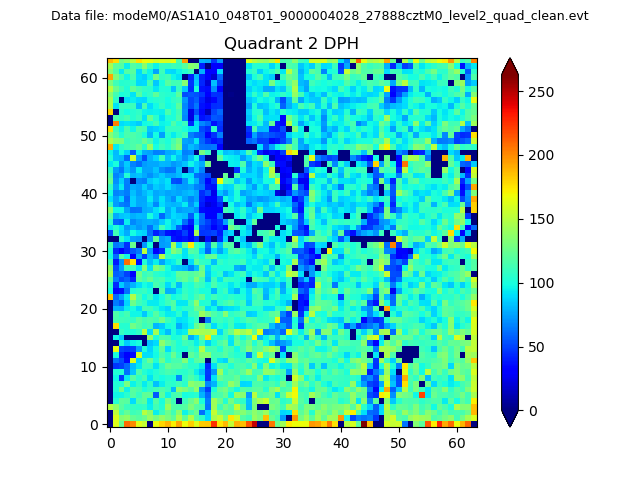
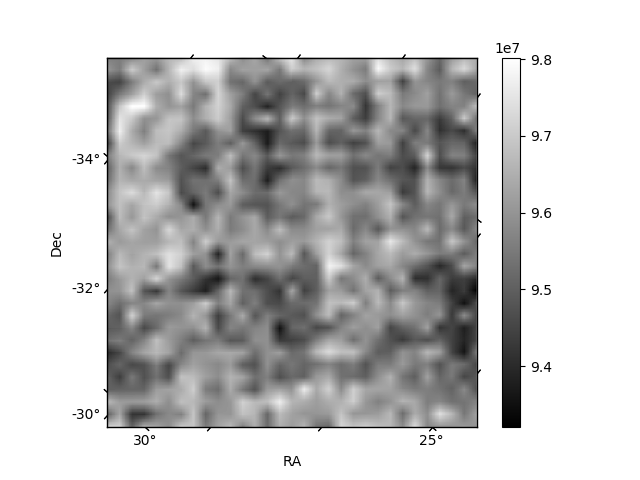
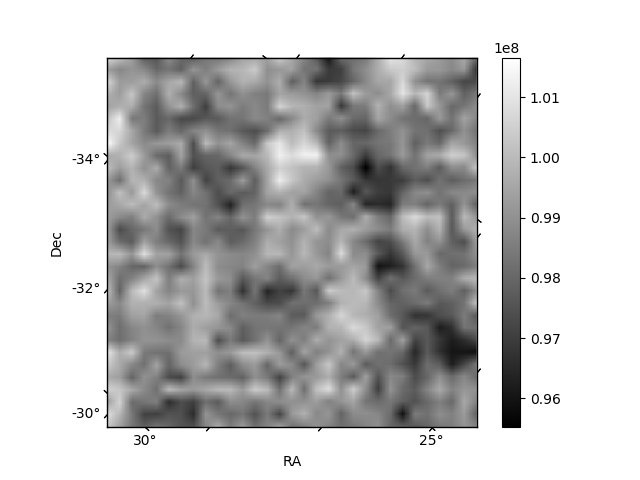
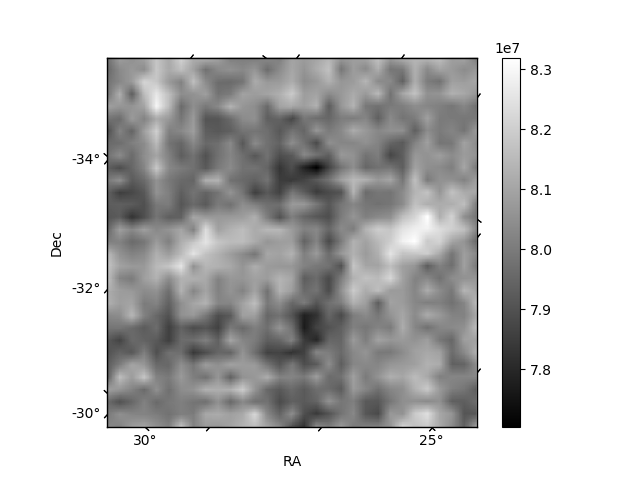
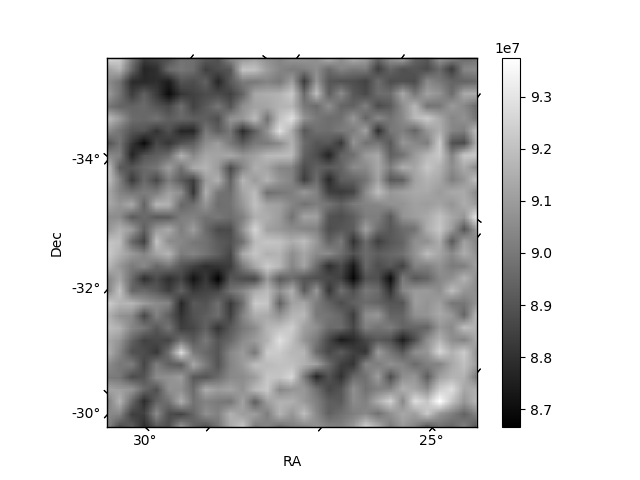
Histogram calculated using DETX and DETY for each event in the final _common_clean file
| Quadrant A |  |
 |
Quadrant B |
|---|---|---|---|
| Quadrant D | 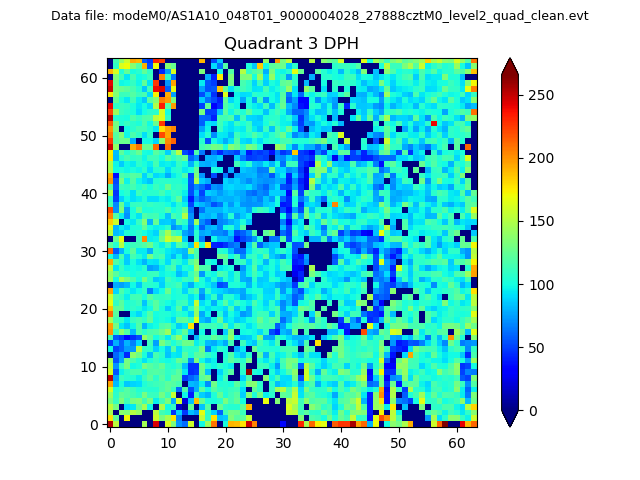 |
 |
Quadrant C |
| Plot type | Count rate plots | Images |
|---|---|---|
| Comparison with Poisson distribution Blue bars denote a histogram of data divided into 1 sec bins. Red curve is a Poisson curve with rate = median count rate of data. |
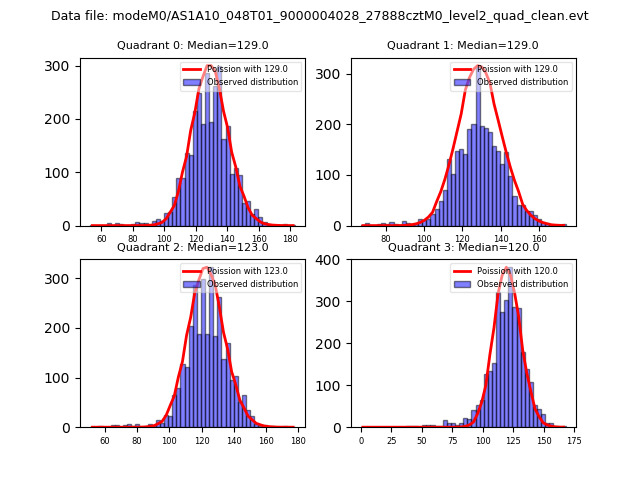 |
 |
| Quadrant-wise count rates Data is divided into 100 sec bins |
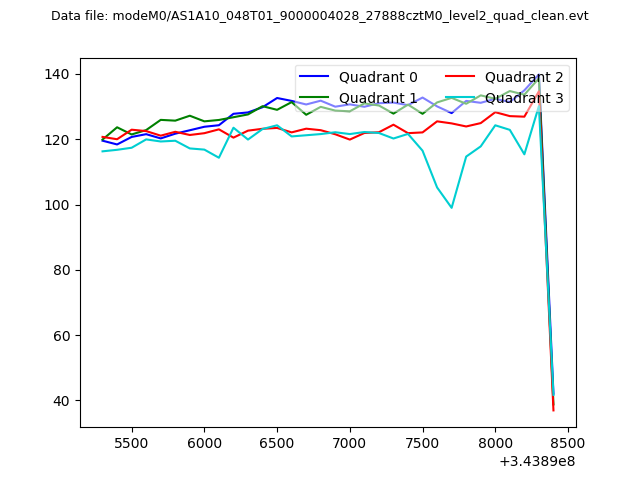 |
|
| Module-wise count rates for Quadrant A Data is divided into 100 sec bins |
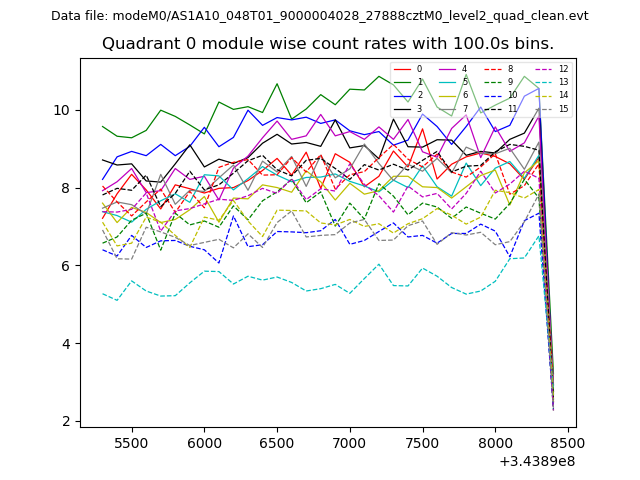 |
 |
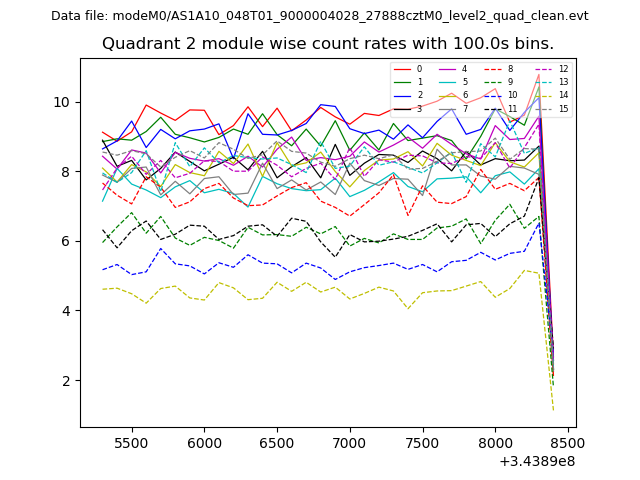
| Module-wise count rates for Quadrant B Data is divided into 100 sec bins |
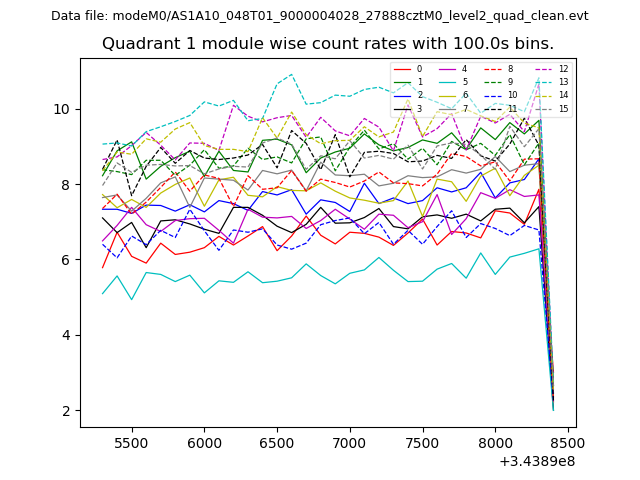 |
 |
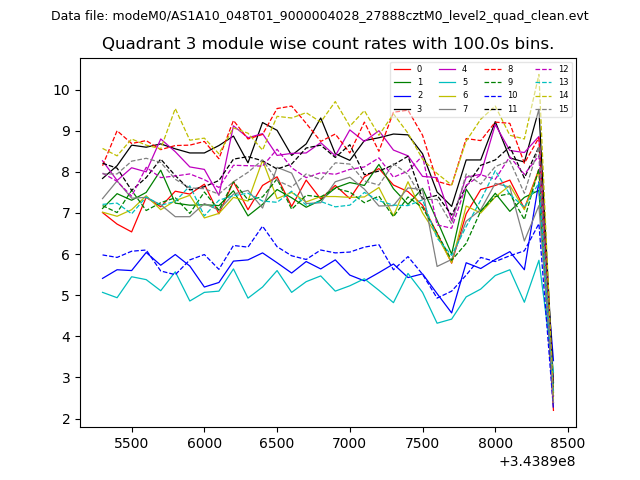
| Module-wise count rates for Quadrant C Data is divided into 100 sec bins |
 |
 |
| Module-wise count rates for Quadrant D Data is divided into 100 sec bins |
 |
 |
| Parameter | Plot |
|---|---|
| CZT HV Monitor | 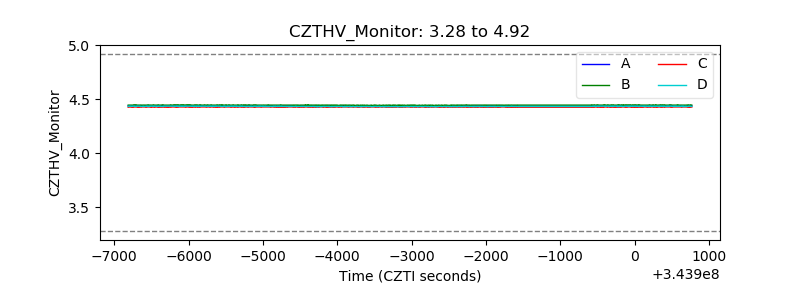 |
| D_VDD | 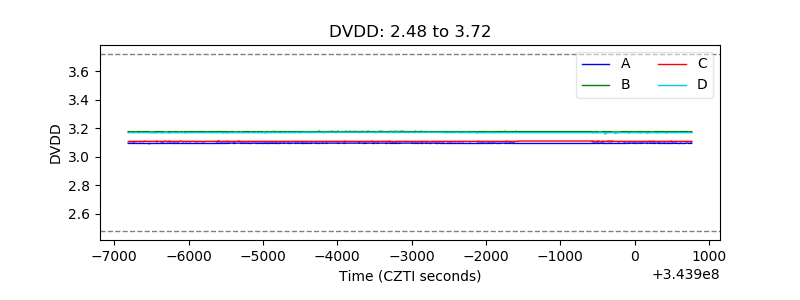 |
| Temperature 1 | 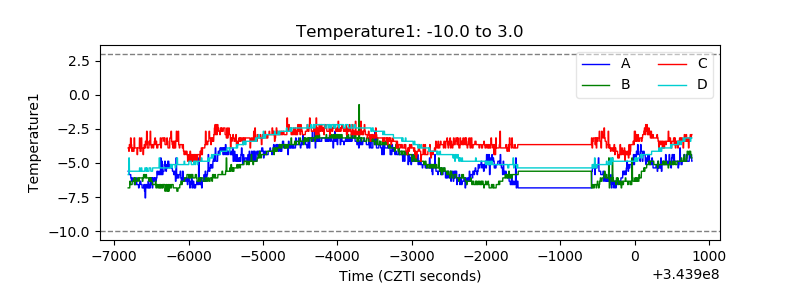 |
| Veto HV Monitor | 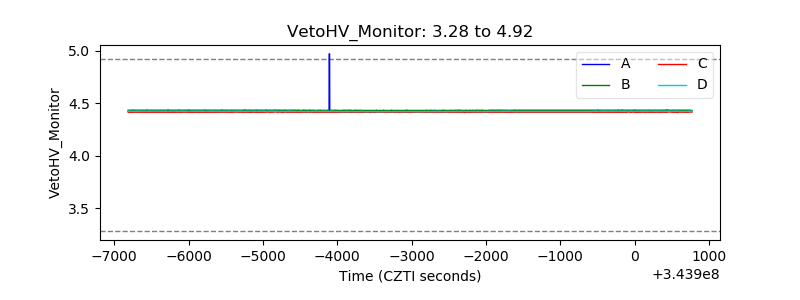 |
| Veto LLD | 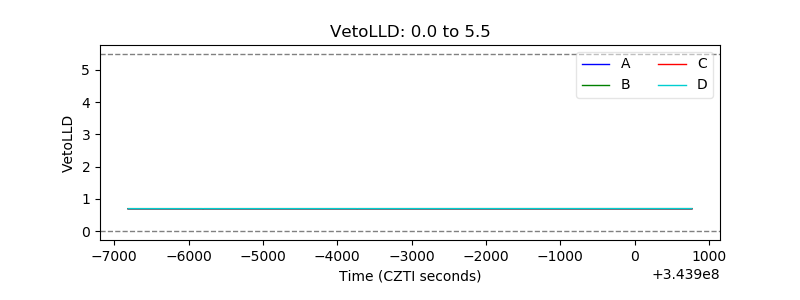 |
| Alpha Counter | 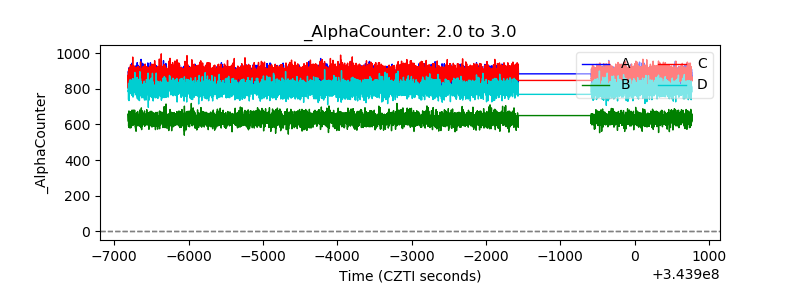 |
| _CPM_Rate |  |
| CZT Counter | 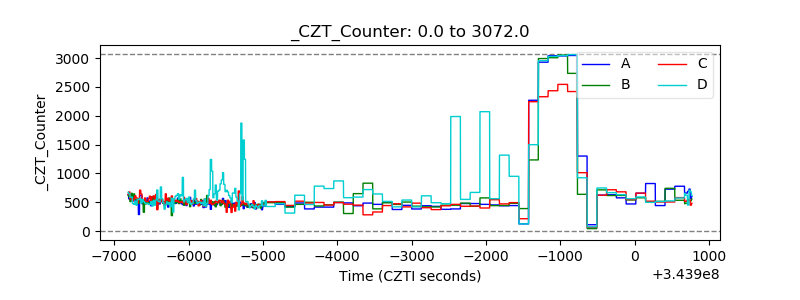 |
| +2.5 Volts monitor |  |
| +5 Volts monitor |  |
| _ROLL_ROT | 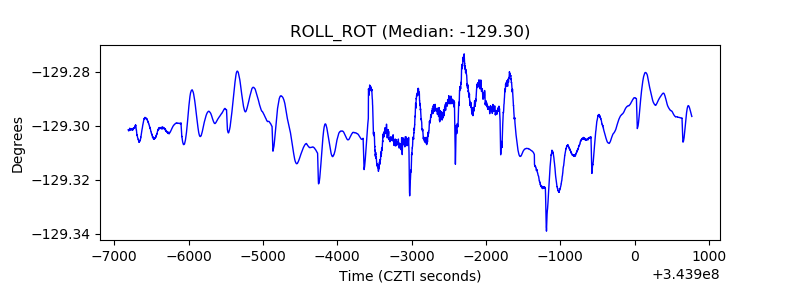 |
| _Roll_DEC |  |
| _Roll_RA | 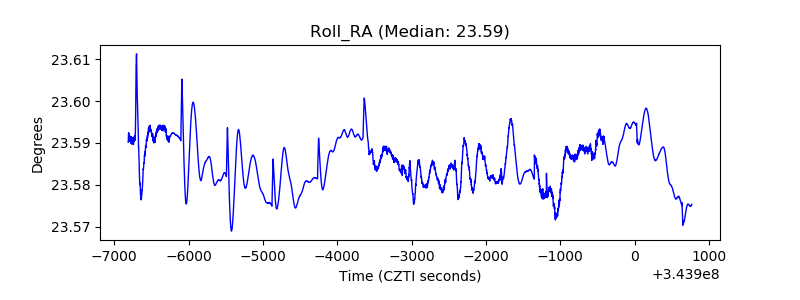 |
| Veto Counter | 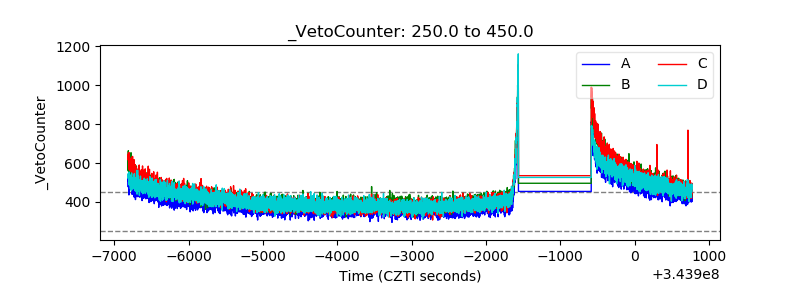 |