| Param | Original file | Final file |
|---|---|---|
| Filename | modeM0/AS1A10_048T01_9000004028_27890cztM0_level2.evt | modeM0/AS1A10_048T01_9000004028_27890cztM0_level2_quad_clean.evt |
| Size (bytes) | 555,598,080 | 82,296,000 |
| Size | 529.9 MB | 78.5 MB |
| Events in quadrant A | 4,130,733 | 514,682 |
| Events in quadrant B | 3,669,188 | 519,106 |
| Events in quadrant C | 3,669,384 | 492,228 |
| Events in quadrant D | 4,889,066 | 484,816 |
| Mode M0 | |||
|---|---|---|---|
| Quadrant | BADHDUFLAG | Total packets | Discarded packets |
| A | 0 | 16876 | 0 |
| B | 0 | 15236 | 0 |
| C | 0 | 15388 | 0 |
| D | 0 | 19274 | 0 |
| Mode M9 | |||
|---|---|---|---|
| Quadrant | BADHDUFLAG | Total packets | Discarded packets |
| A | 0 | 21 | 0 |
| B | 0 | 21 | 0 |
| C | 0 | 21 | 0 |
| D | 0 | 21 | 0 |
| Quadrant | Total seconds | Saturated seconds | Saturation percentage |
|---|---|---|---|
| A | 6903 | 121 | 1.752861% |
| B | 6904 | 125 | 1.810545% |
| C | 6904 | 177 | 2.563731% |
| D | 6904 | 254 | 3.679027% |
Noise dominated data is calculated using 1-second bins in cleaned event files. If a bin has >2000 counts, and if more than 50% of those come from <1% of pixels, then it is considered to be noise-dominated and hence unusable.
| Quadrant | # 1 sec bins | Bins with >0 counts | Bins with >2000 counts | High rate bins dominated by noise | Noise dominated (total time) | Noise dominated (detector-on time) | Marked lightcurve |
|---|---|---|---|---|---|---|---|
| A | 8998 | 6903 | 10 | 10 | 0.11% | 0.14% | 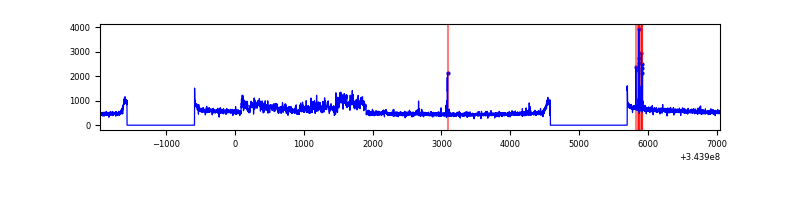 |
| B | 8999 | 6904 | 1 | 1 | 0.01% | 0.01% | 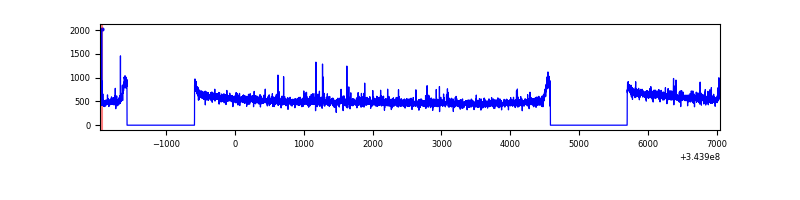 |
| C | 8999 | 6904 | 0 | 0 | 0.00% | 0.00% | 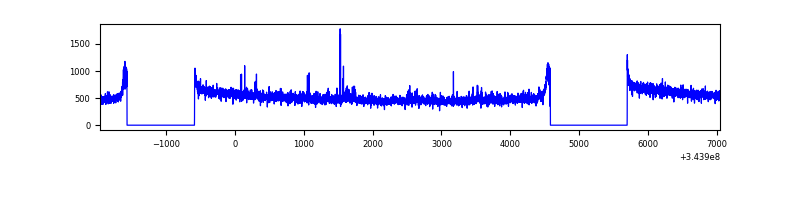 |
| D | 8999 | 6904 | 109 | 109 | 1.21% | 1.58% | 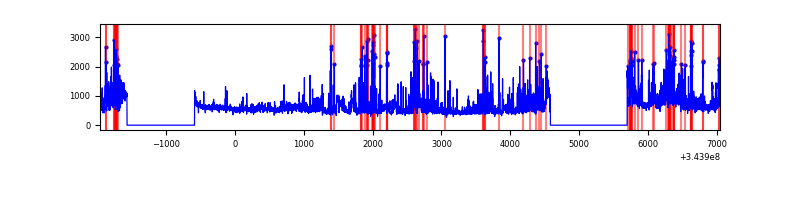 |
Top three noisy pixels from each quadrant. If the there are fewer than three noisy pixels in the level2.evt file, extra rows are filled as -1
| Pixel properties | Quadrant properties | ||||||
|---|---|---|---|---|---|---|---|
| Quadrant | DetID | PixID | Counts | Sigma | Mean | Median | Sigma |
| A | 6 | 16 | 541700 | 2941.6 | 917 | 897 | 183.8 |
| A | 4 | 2 | 30407 | 160.51 | 917 | 897 | 183.8 |
| A | 9 | 130 | 17270 | 89.06 | 917 | 897 | 183.8 |
| B | 0 | 230 | 53997 | 306.29 | 913 | 890 | 173.4 |
| B | 10 | 245 | 36731 | 206.71 | 913 | 890 | 173.4 |
| B | 12 | 111 | 21056 | 116.3 | 913 | 890 | 173.4 |
| C | 14 | 238 | 140887 | 686.42 | 877 | 883 | 204.0 |
| C | 6 | 112 | 55667 | 268.6 | 877 | 883 | 204.0 |
| C | 3 | 233 | 45730 | 219.88 | 877 | 883 | 204.0 |
| D | 1 | 52 | 905632 | 4347.19 | 881 | 857 | 208.1 |
| D | 13 | 104 | 313468 | 1502.01 | 881 | 857 | 208.1 |
| D | 7 | 238 | 277127 | 1327.4 | 881 | 857 | 208.1 |
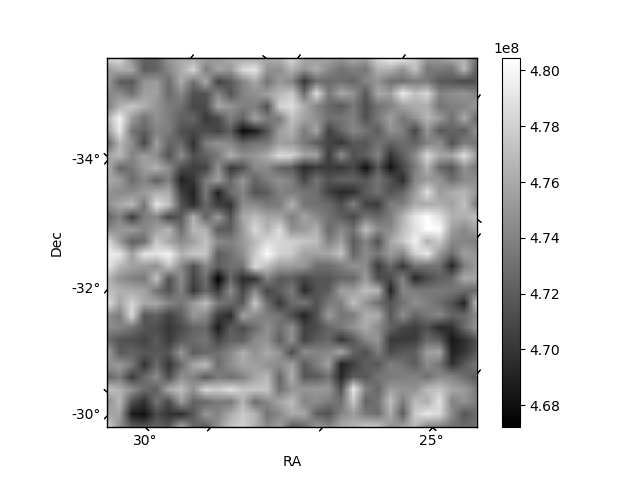
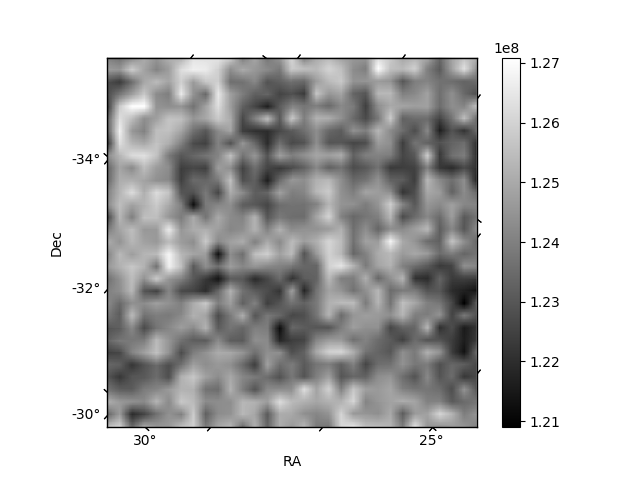
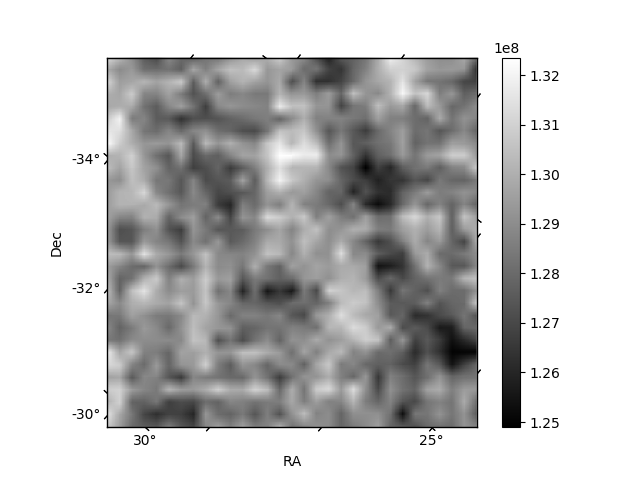
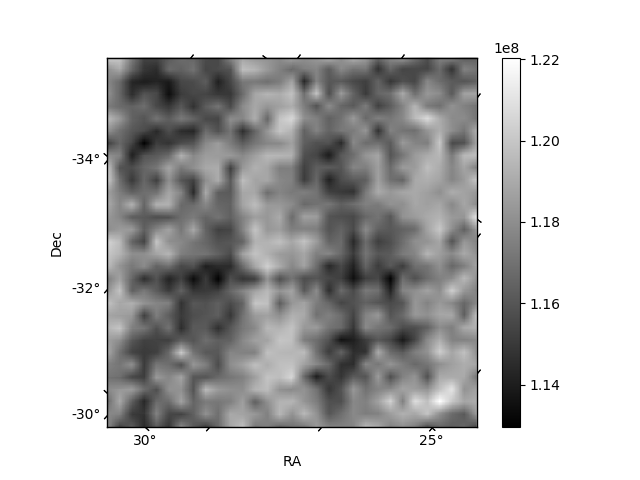
Histogram calculated using DETX and DETY for each event in the final _common_clean file
| Quadrant A | 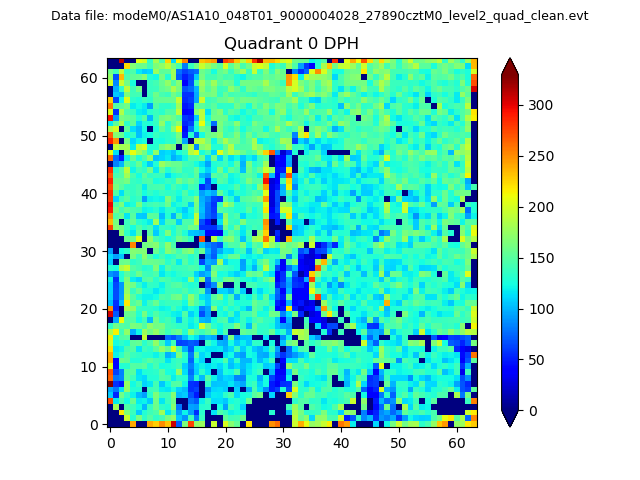 |
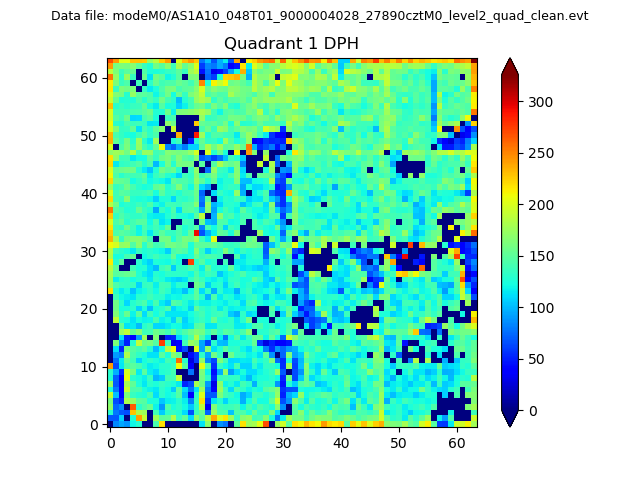 |
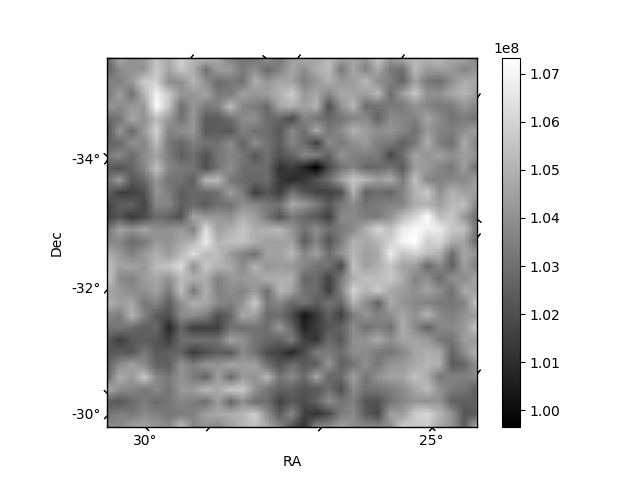
Quadrant B |
|---|---|---|---|
| Quadrant D |  |
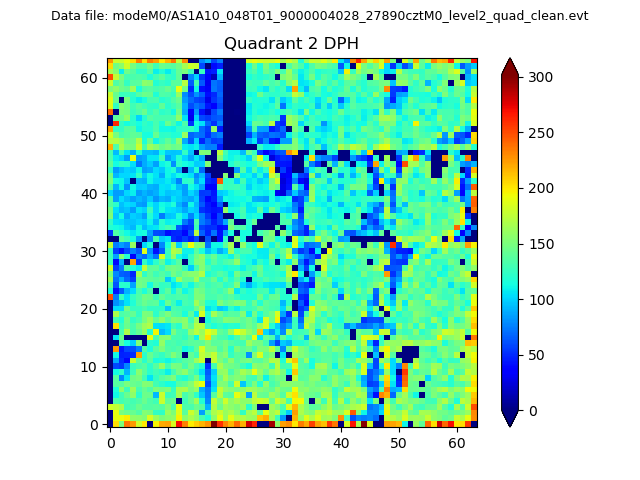 |
Quadrant C |
| Plot type | Count rate plots | Images |
|---|---|---|
| Comparison with Poisson distribution Blue bars denote a histogram of data divided into 1 sec bins. Red curve is a Poisson curve with rate = median count rate of data. |
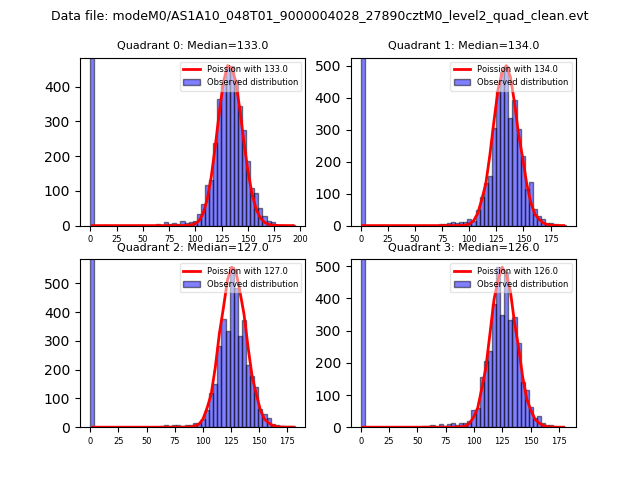 |
 |
| Quadrant-wise count rates Data is divided into 100 sec bins |
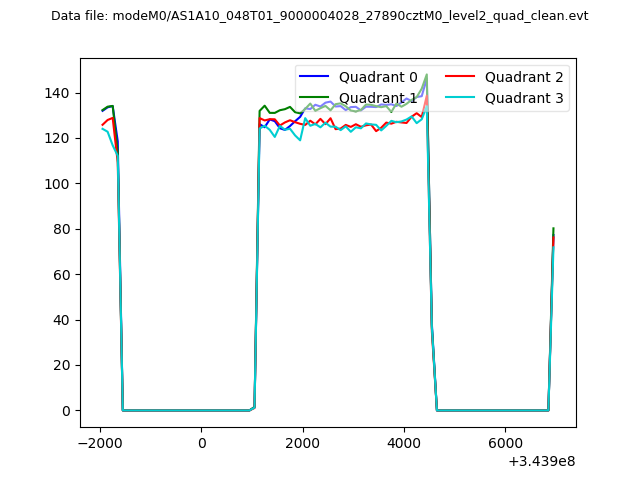 |
|
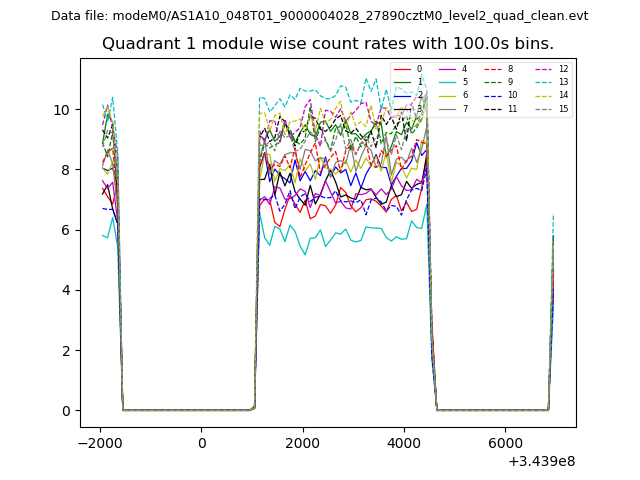
| Module-wise count rates for Quadrant A Data is divided into 100 sec bins |
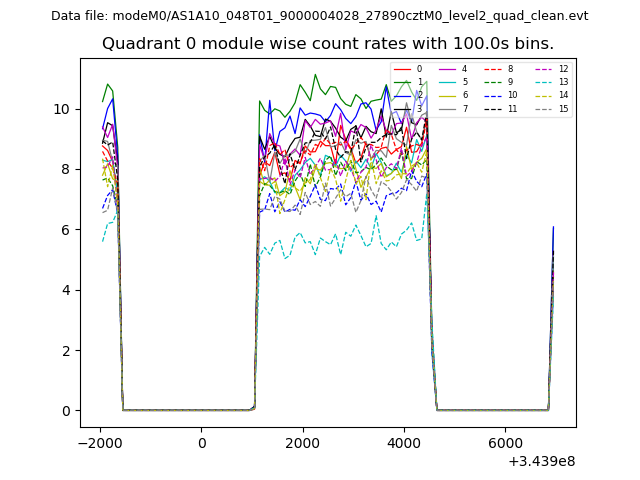 |
 |
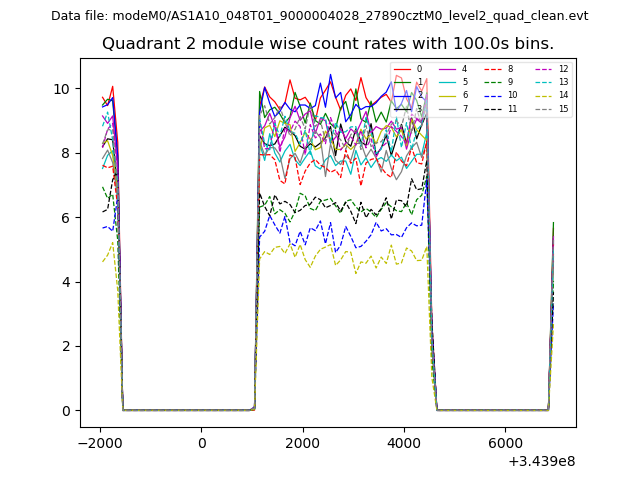
| Module-wise count rates for Quadrant B Data is divided into 100 sec bins |
 |
 |
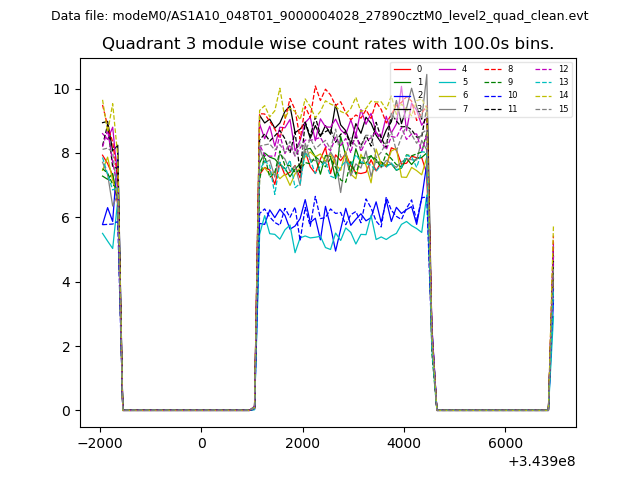
| Module-wise count rates for Quadrant C Data is divided into 100 sec bins |
 |
 |
| Module-wise count rates for Quadrant D Data is divided into 100 sec bins |
 |
 |
| Parameter | Plot |
|---|---|
| CZT HV Monitor | 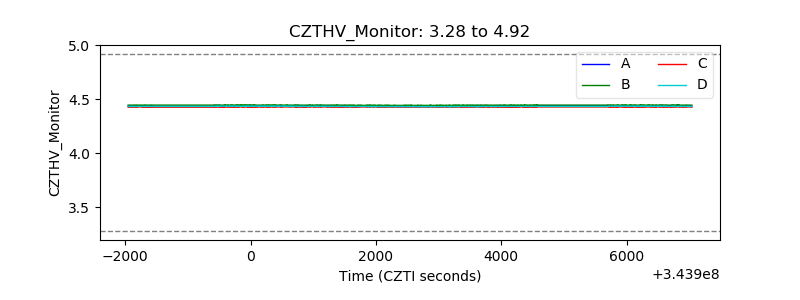 |
| D_VDD | 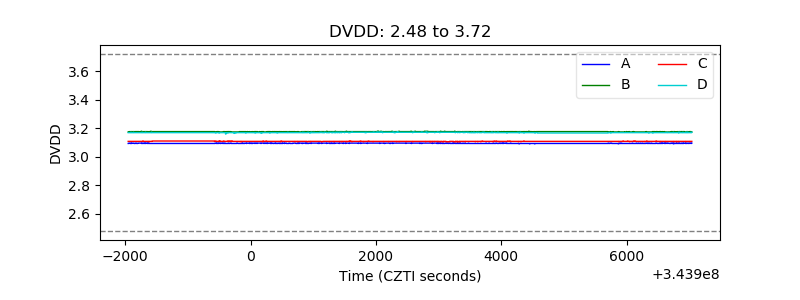 |
| Temperature 1 | 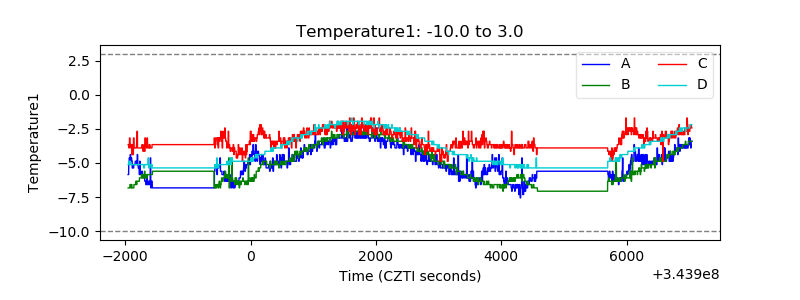 |
| Veto HV Monitor | 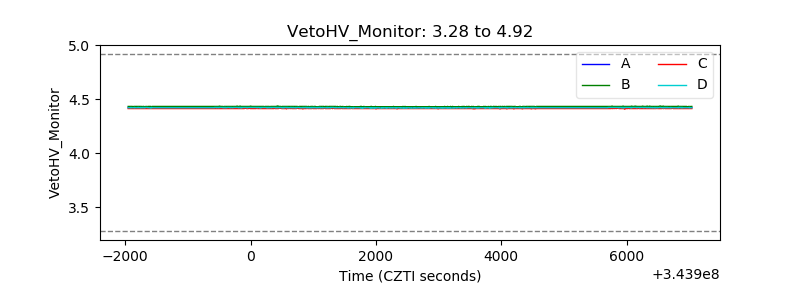 |
| Veto LLD | 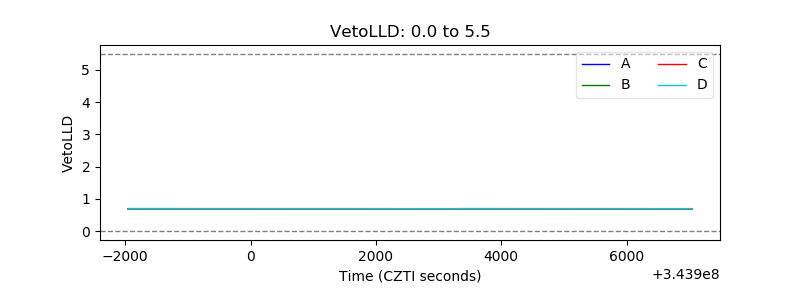 |
| Alpha Counter | 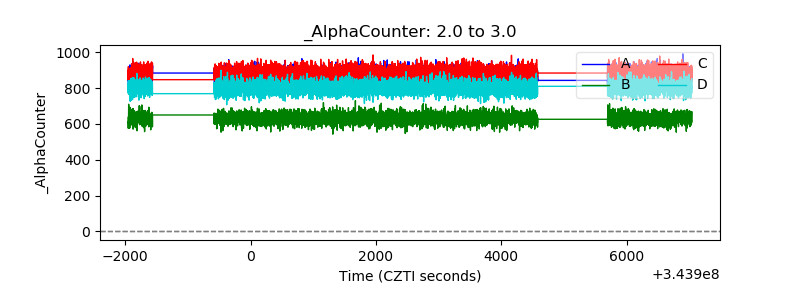 |
| _CPM_Rate | 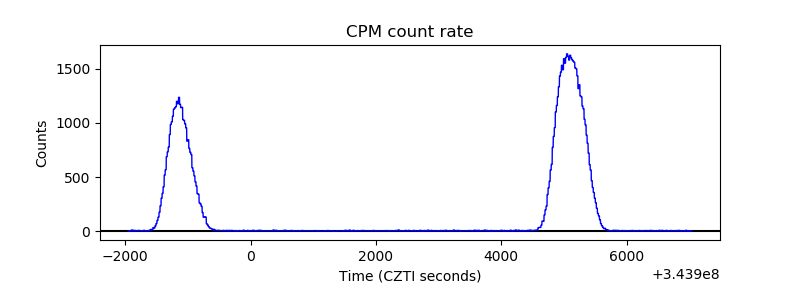 |
| CZT Counter | 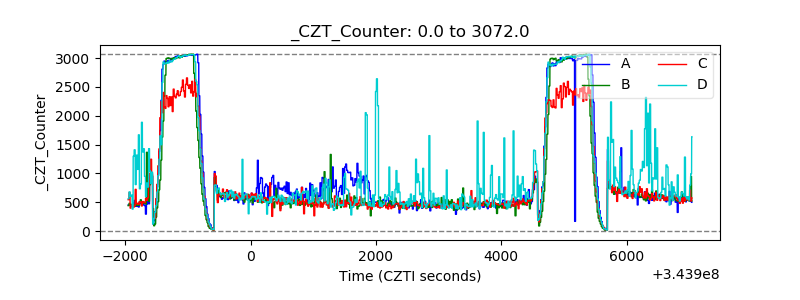 |
| +2.5 Volts monitor |  |
| +5 Volts monitor | 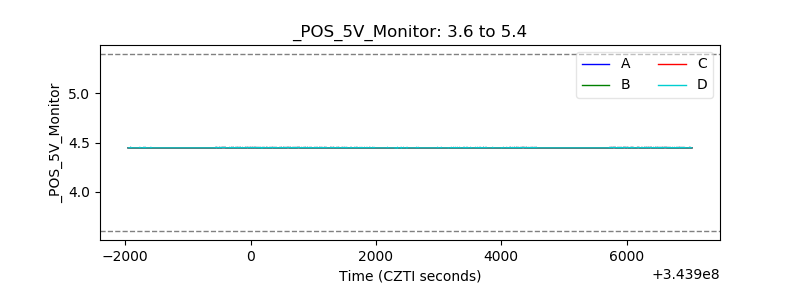 |
| _ROLL_ROT | 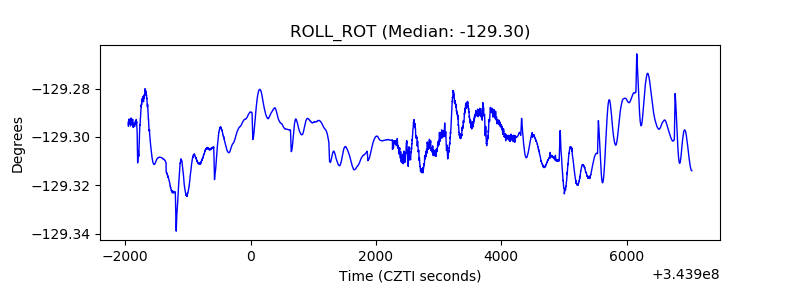 |
| _Roll_DEC | 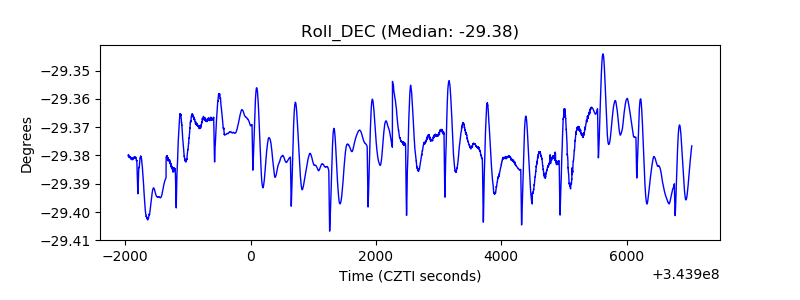 |
| _Roll_RA | 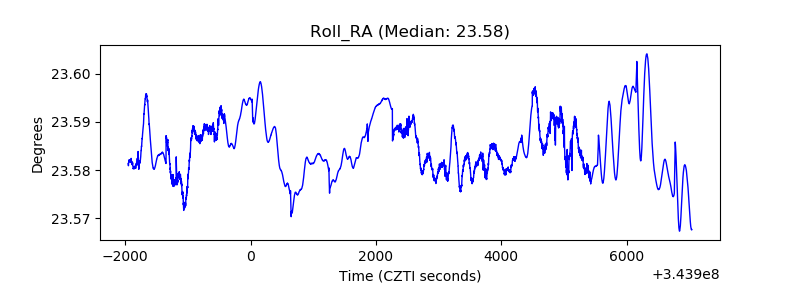 |
| Veto Counter | 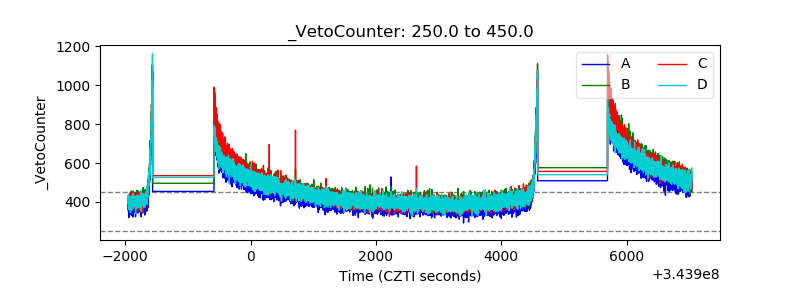 |