| Param | Original file | Final file |
|---|---|---|
| Filename | modeM0/AS1A10_048T01_9000004028_27891cztM0_level2.evt | modeM0/AS1A10_048T01_9000004028_27891cztM0_level2_quad_clean.evt |
| Size (bytes) | 522,702,720 | 92,992,320 |
| Size | 498.5 MB | 88.7 MB |
| Events in quadrant A | 3,377,955 | 614,012 |
| Events in quadrant B | 3,535,729 | 617,596 |
| Events in quadrant C | 3,385,654 | 579,464 |
| Events in quadrant D | 5,107,239 | 568,831 |
| Mode M0 | |||
|---|---|---|---|
| Quadrant | BADHDUFLAG | Total packets | Discarded packets |
| A | 0 | 14108 | 0 |
| B | 0 | 14655 | 0 |
| C | 0 | 14278 | 0 |
| D | 0 | 19573 | 0 |
| Mode M9 | |||
|---|---|---|---|
| Quadrant | BADHDUFLAG | Total packets | Discarded packets |
| A | 0 | 12 | 0 |
| B | 0 | 12 | 0 |
| C | 0 | 12 | 0 |
| D | 0 | 12 | 0 |
| Quadrant | Total seconds | Saturated seconds | Saturation percentage |
|---|---|---|---|
| A | 6247 | 81 | 1.296622% |
| B | 6248 | 81 | 1.296415% |
| C | 6248 | 112 | 1.792574% |
| D | 6248 | 219 | 3.505122% |
Noise dominated data is calculated using 1-second bins in cleaned event files. If a bin has >2000 counts, and if more than 50% of those come from <1% of pixels, then it is considered to be noise-dominated and hence unusable.
| Quadrant | # 1 sec bins | Bins with >0 counts | Bins with >2000 counts | High rate bins dominated by noise | Noise dominated (total time) | Noise dominated (detector-on time) | Marked lightcurve |
|---|---|---|---|---|---|---|---|
| A | 7472 | 6247 | 8 | 8 | 0.11% | 0.13% | 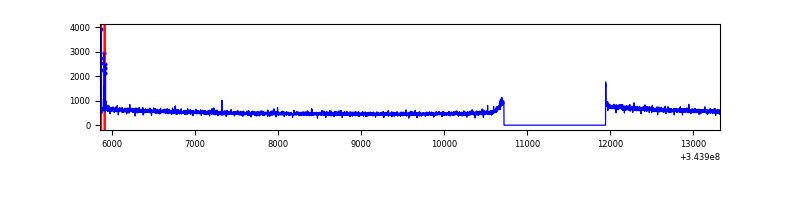 |
| B | 7473 | 6248 | 1 | 1 | 0.01% | 0.02% | 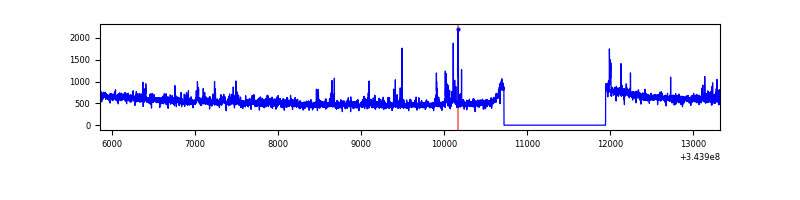 |
| C | 7473 | 6248 | 0 | 0 | 0.00% | 0.00% | 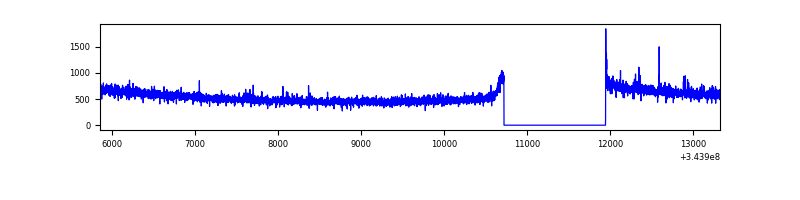 |
| D | 7473 | 6248 | 146 | 146 | 1.95% | 2.34% | 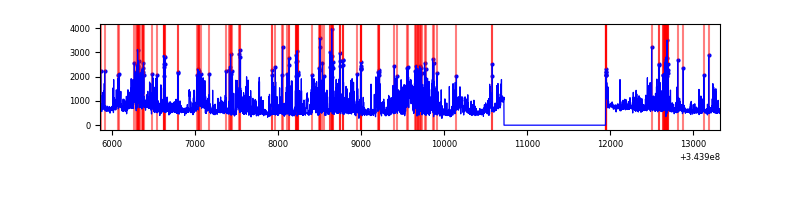 |
Top three noisy pixels from each quadrant. If the there are fewer than three noisy pixels in the level2.evt file, extra rows are filled as -1
| Pixel properties | Quadrant properties | ||||||
|---|---|---|---|---|---|---|---|
| Quadrant | DetID | PixID | Counts | Sigma | Mean | Median | Sigma |
| A | 4 | 2 | 25593 | 144.16 | 869 | 853 | 171.6 |
| A | 13 | 254 | 8977 | 47.34 | 869 | 853 | 171.6 |
| A | 3 | 137 | 7562 | 39.09 | 869 | 853 | 171.6 |
| B | 10 | 245 | 89562 | 552.43 | 858 | 840 | 160.6 |
| B | 0 | 230 | 80307 | 494.8 | 858 | 840 | 160.6 |
| B | 12 | 111 | 18806 | 111.86 | 858 | 840 | 160.6 |
| C | 14 | 238 | 133739 | 706.83 | 815 | 821 | 188.0 |
| C | 3 | 233 | 41549 | 216.58 | 815 | 821 | 188.0 |
| C | 2 | 16 | 23590 | 121.08 | 815 | 821 | 188.0 |
| D | 1 | 52 | 982154 | 5080.62 | 822 | 801 | 193.2 |
| D | 13 | 104 | 804260 | 4159.64 | 822 | 801 | 193.2 |
| D | 7 | 238 | 209929 | 1082.69 | 822 | 801 | 193.2 |
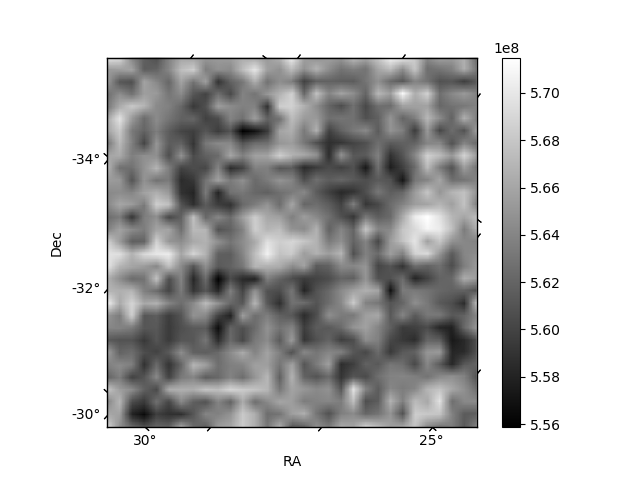
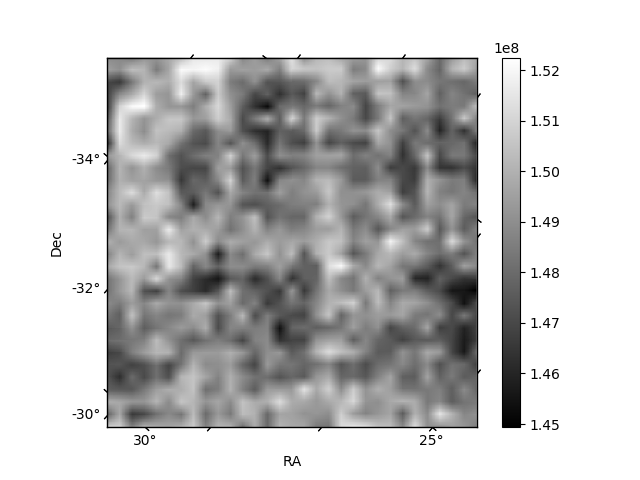
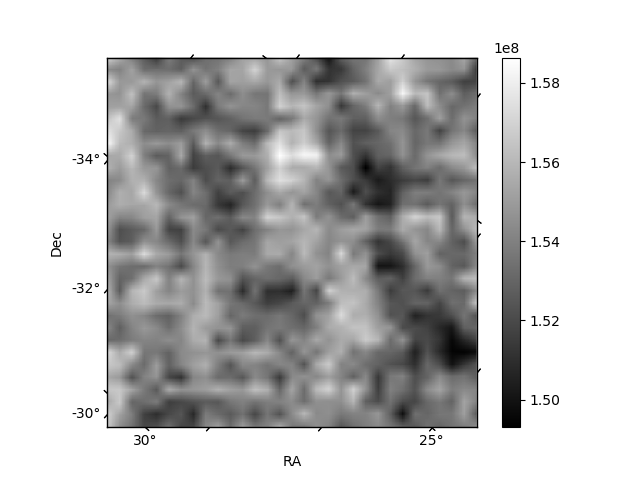
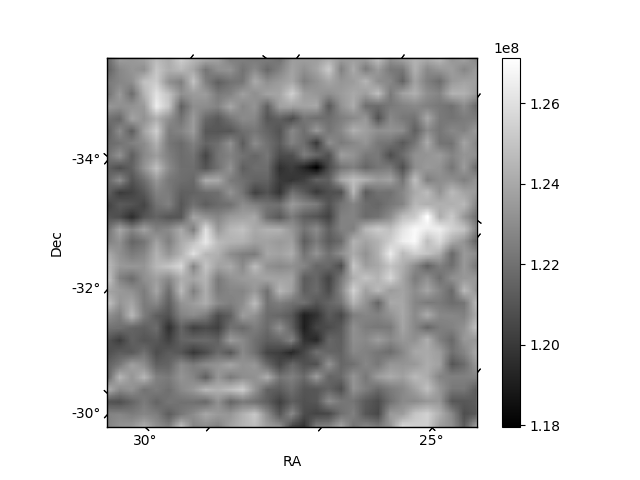
Histogram calculated using DETX and DETY for each event in the final _common_clean file
| Quadrant A | 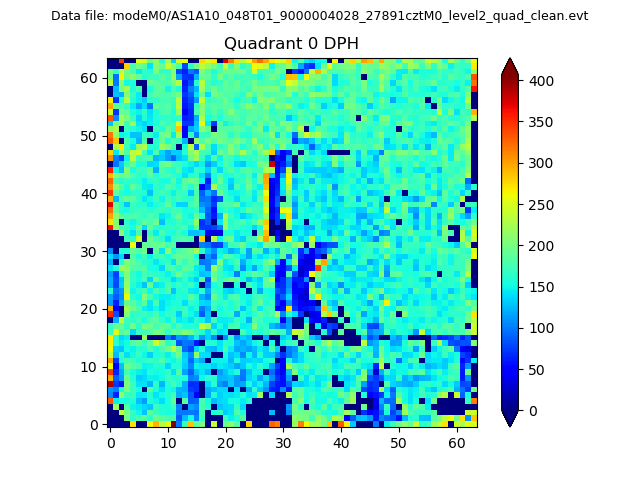 |
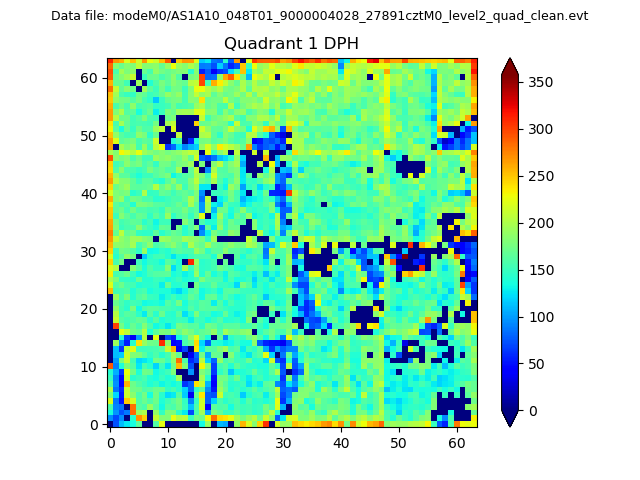 |
Quadrant B |
|---|---|---|---|
| Quadrant D | 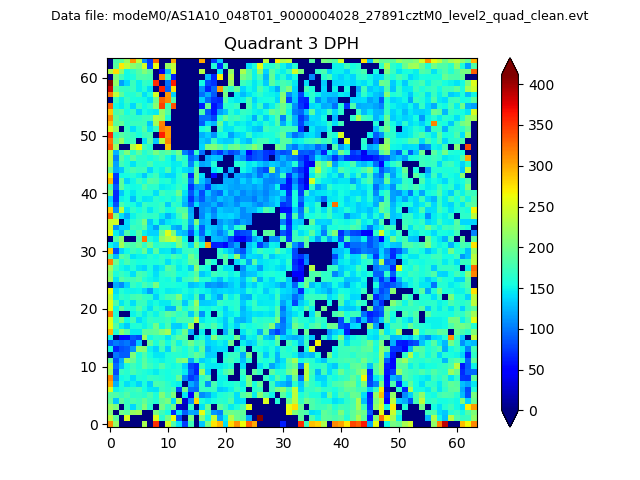 |
 |
Quadrant C |
| Plot type | Count rate plots | Images |
|---|---|---|
| Comparison with Poisson distribution Blue bars denote a histogram of data divided into 1 sec bins. Red curve is a Poisson curve with rate = median count rate of data. |
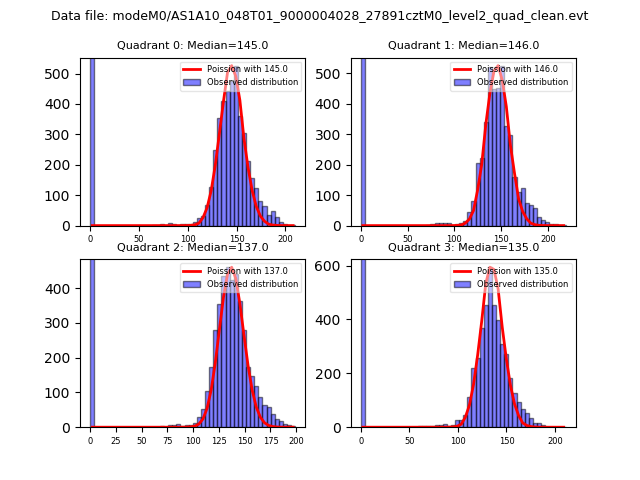 |
 |
| Quadrant-wise count rates Data is divided into 100 sec bins |
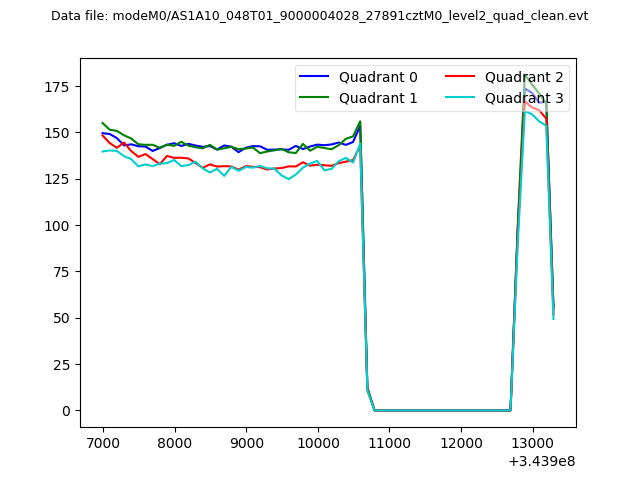 |
|
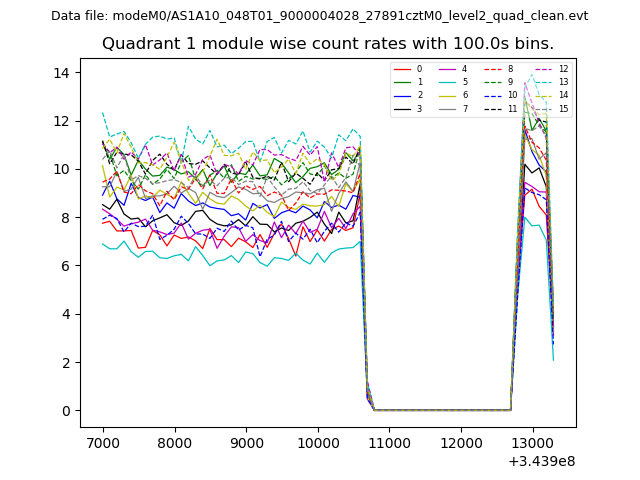
| Module-wise count rates for Quadrant A Data is divided into 100 sec bins |
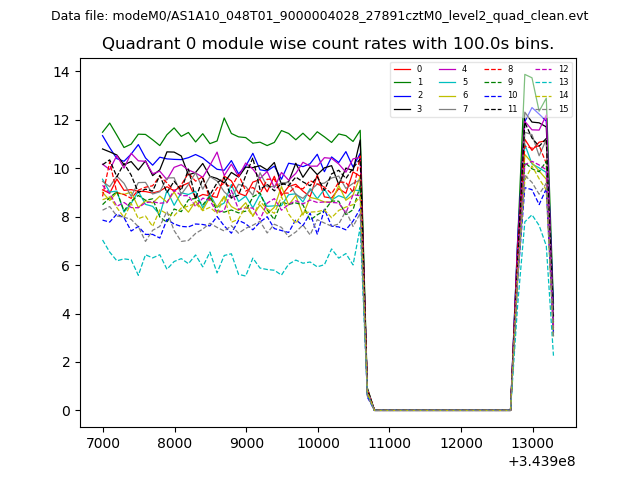 |
 |
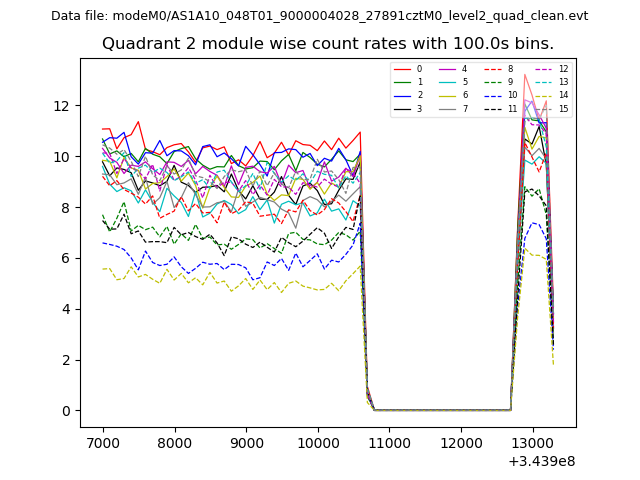
| Module-wise count rates for Quadrant B Data is divided into 100 sec bins |
 |
 |
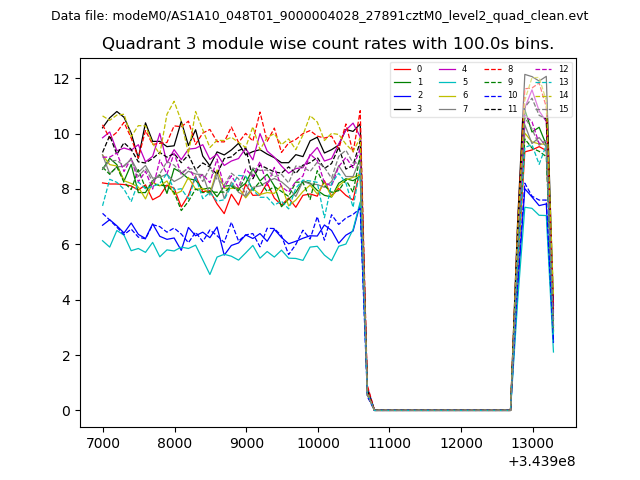
| Module-wise count rates for Quadrant C Data is divided into 100 sec bins |
 |
 |
| Module-wise count rates for Quadrant D Data is divided into 100 sec bins |
 |
 |
| Parameter | Plot |
|---|---|
| CZT HV Monitor | 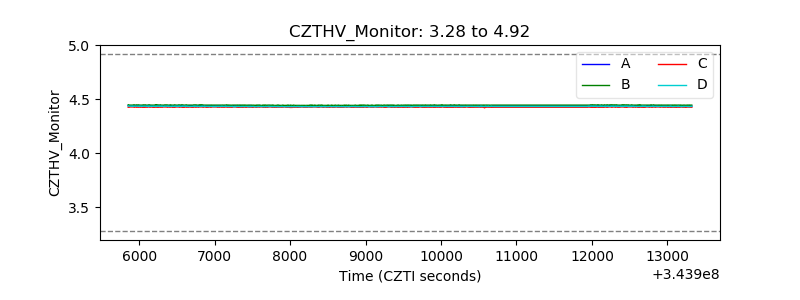 |
| D_VDD | 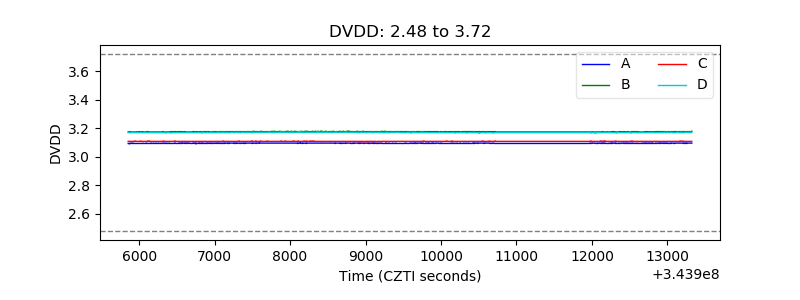 |
| Temperature 1 |  |
| Veto HV Monitor | 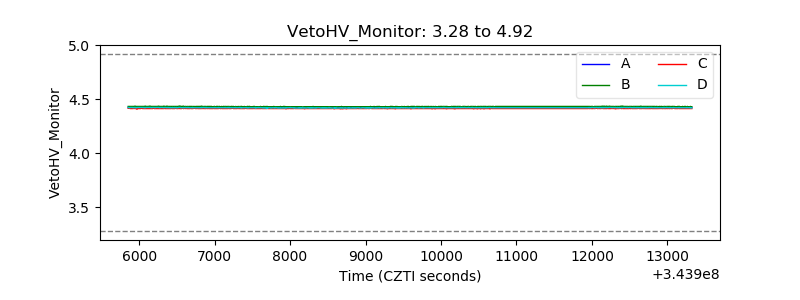 |
| Veto LLD | 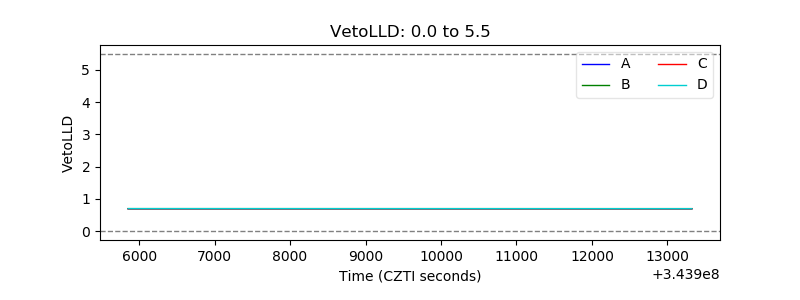 |
| Alpha Counter | 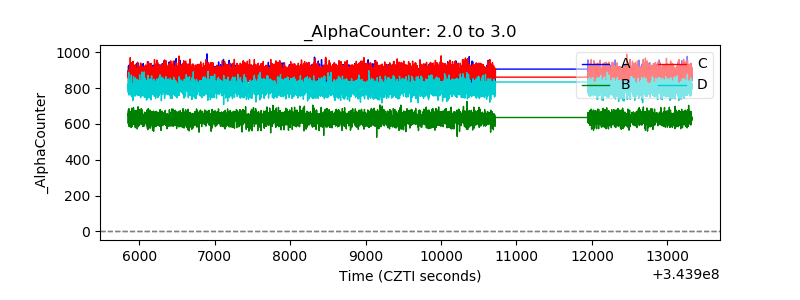 |
| _CPM_Rate | 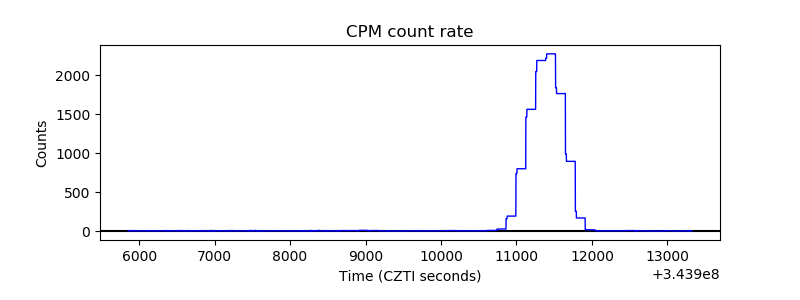 |
| CZT Counter |  |
| +2.5 Volts monitor | 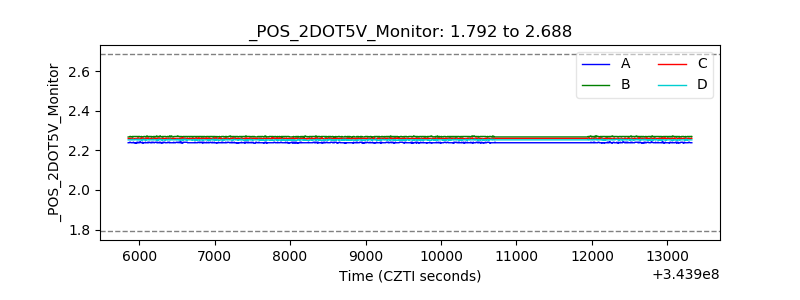 |
| +5 Volts monitor | 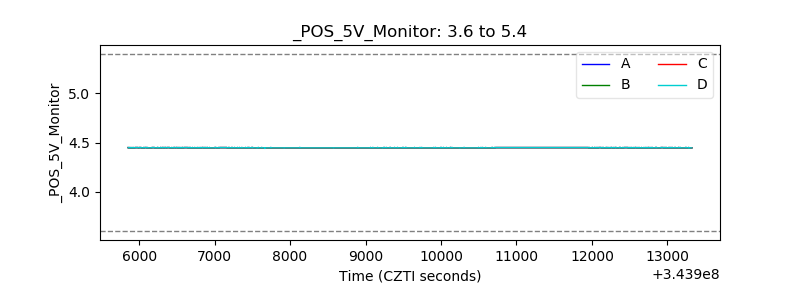 |
| _ROLL_ROT | 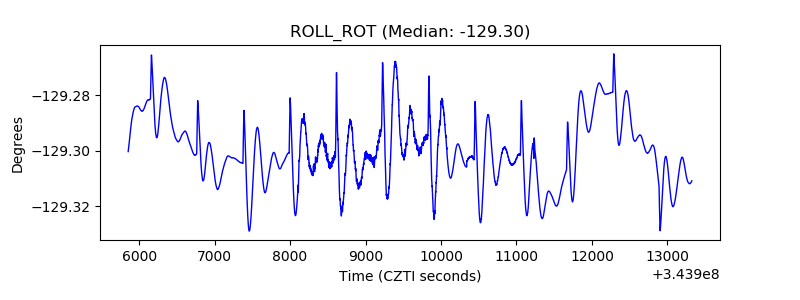 |
| _Roll_DEC | 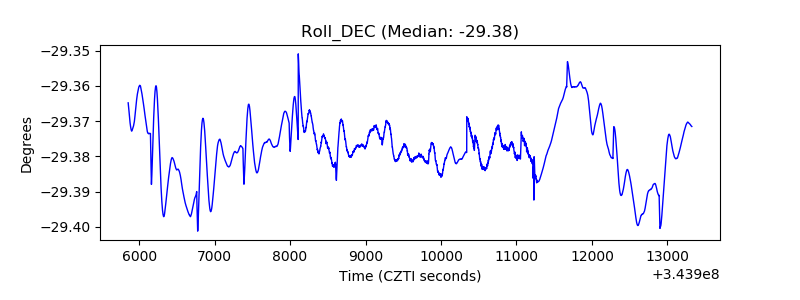 |
| _Roll_RA | 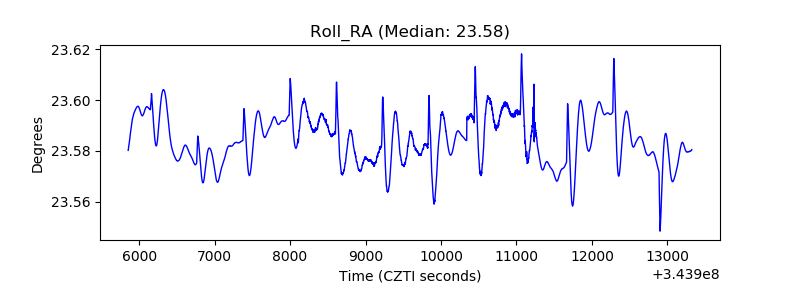 |
| Veto Counter | 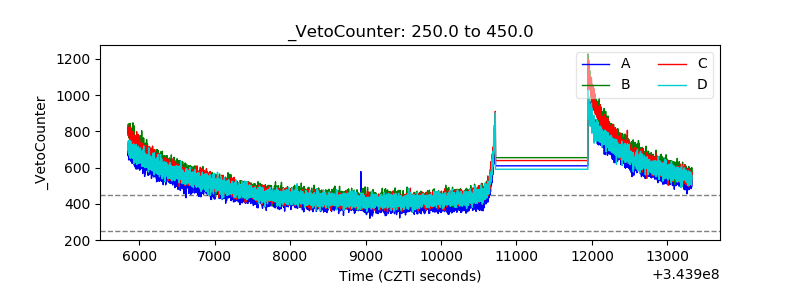 |