| Param | Original file | Final file |
|---|---|---|
| Filename | modeM0/AS1A10_048T01_9000004028_27892cztM0_level2.evt | modeM0/AS1A10_048T01_9000004028_27892cztM0_level2_quad_clean.evt |
| Size (bytes) | 485,614,080 | 106,272,000 |
| Size | 463.1 MB | 101.3 MB |
| Events in quadrant A | 3,345,931 | 724,594 |
| Events in quadrant B | 3,478,640 | 729,342 |
| Events in quadrant C | 3,367,261 | 675,660 |
| Events in quadrant D | 4,104,118 | 666,180 |
| Mode M0 | |||
|---|---|---|---|
| Quadrant | BADHDUFLAG | Total packets | Discarded packets |
| A | 0 | 13947 | 0 |
| B | 0 | 14461 | 0 |
| C | 0 | 14009 | 0 |
| D | 0 | 16300 | 0 |
| Mode M9 | |||
|---|---|---|---|
| Quadrant | BADHDUFLAG | Total packets | Discarded packets |
| A | 0 | 13 | 0 |
| B | 0 | 13 | 0 |
| C | 0 | 13 | 0 |
| D | 0 | 13 | 0 |
| Quadrant | Total seconds | Saturated seconds | Saturation percentage |
|---|---|---|---|
| A | 6058 | 105 | 1.733245% |
| B | 6059 | 132 | 2.178577% |
| C | 6059 | 160 | 2.640700% |
| D | 6059 | 170 | 2.805744% |
Noise dominated data is calculated using 1-second bins in cleaned event files. If a bin has >2000 counts, and if more than 50% of those come from <1% of pixels, then it is considered to be noise-dominated and hence unusable.
| Quadrant | # 1 sec bins | Bins with >0 counts | Bins with >2000 counts | High rate bins dominated by noise | Noise dominated (total time) | Noise dominated (detector-on time) | Marked lightcurve |
|---|---|---|---|---|---|---|---|
| A | 7318 | 6058 | 0 | 0 | 0.00% | 0.00% | 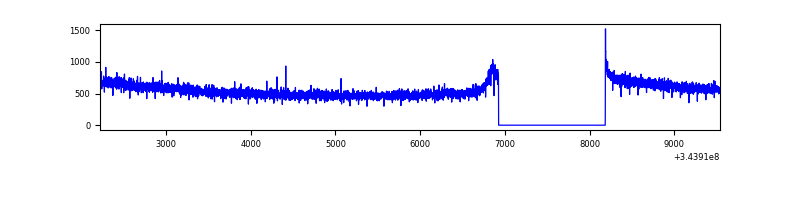 |
| B | 7319 | 6059 | 5 | 5 | 0.07% | 0.08% | 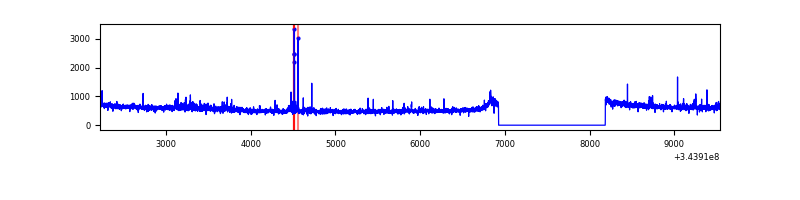 |
| C | 7319 | 6059 | 0 | 0 | 0.00% | 0.00% | 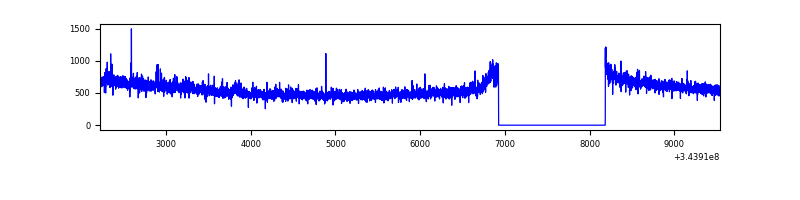 |
| D | 7319 | 6059 | 82 | 82 | 1.12% | 1.35% | 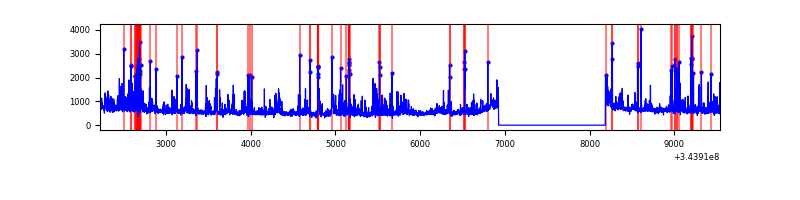 |
Top three noisy pixels from each quadrant. If the there are fewer than three noisy pixels in the level2.evt file, extra rows are filled as -1
| Pixel properties | Quadrant properties | ||||||
|---|---|---|---|---|---|---|---|
| Quadrant | DetID | PixID | Counts | Sigma | Mean | Median | Sigma |
| A | 13 | 254 | 9415 | 50.06 | 867 | 856 | 171.0 |
| A | 3 | 137 | 7518 | 38.96 | 867 | 856 | 171.0 |
| A | 0 | 226 | 7483 | 38.76 | 867 | 856 | 171.0 |
| B | 0 | 230 | 79430 | 496.02 | 852 | 839 | 158.4 |
| B | 10 | 245 | 40934 | 253.06 | 852 | 839 | 158.4 |
| B | 12 | 111 | 18662 | 112.49 | 852 | 839 | 158.4 |
| C | 14 | 238 | 133755 | 714.51 | 807 | 813 | 186.1 |
| C | 3 | 233 | 69417 | 368.72 | 807 | 813 | 186.1 |
| C | 2 | 16 | 23219 | 120.42 | 807 | 813 | 186.1 |
| D | 1 | 52 | 638558 | 3330.4 | 820 | 800 | 191.5 |
| D | 13 | 104 | 247922 | 1290.48 | 820 | 800 | 191.5 |
| D | 7 | 238 | 99033 | 512.98 | 820 | 800 | 191.5 |
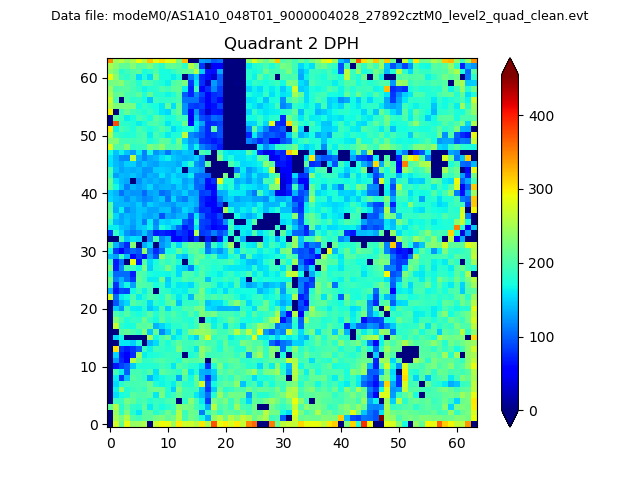
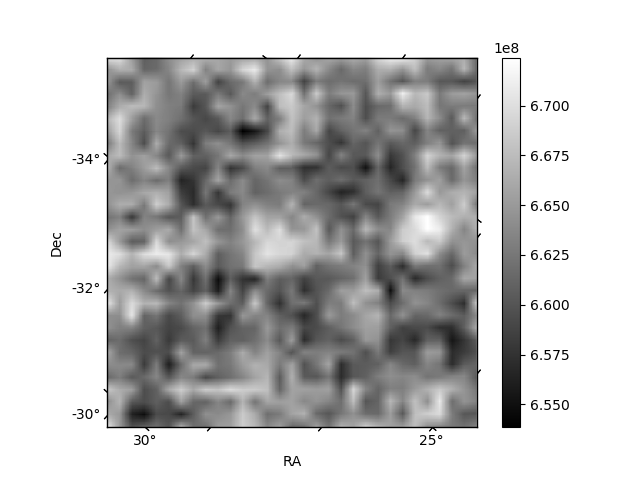
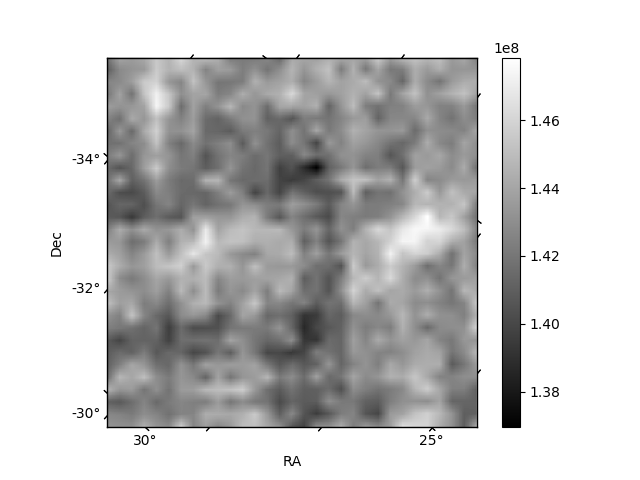
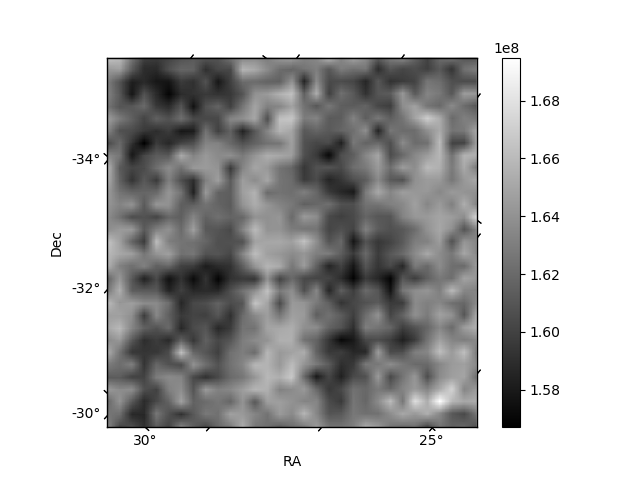
Histogram calculated using DETX and DETY for each event in the final _common_clean file
| Quadrant A | 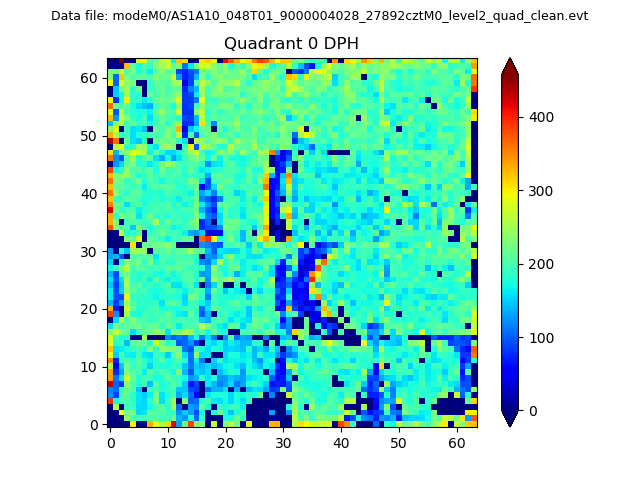 |
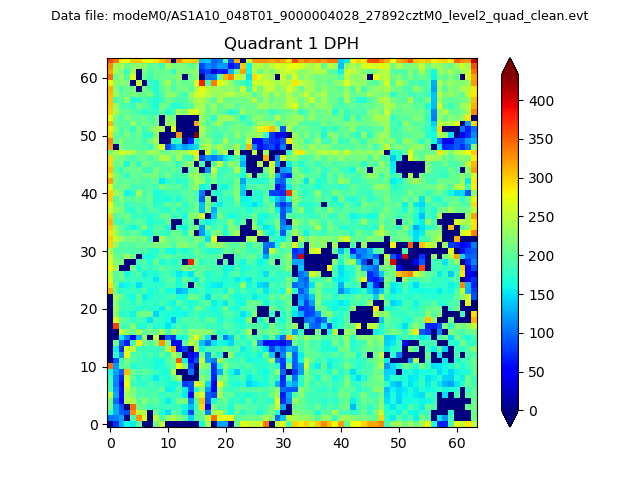 |
Quadrant B |
|---|---|---|---|
| Quadrant D | 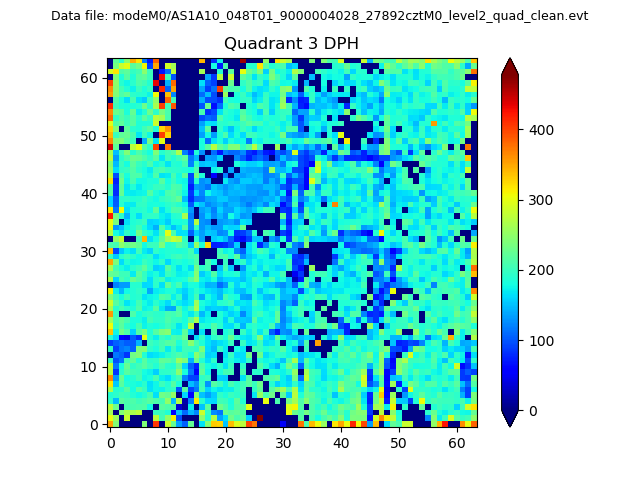 |
 |
Quadrant C |
| Plot type | Count rate plots | Images |
|---|---|---|
| Comparison with Poisson distribution Blue bars denote a histogram of data divided into 1 sec bins. Red curve is a Poisson curve with rate = median count rate of data. |
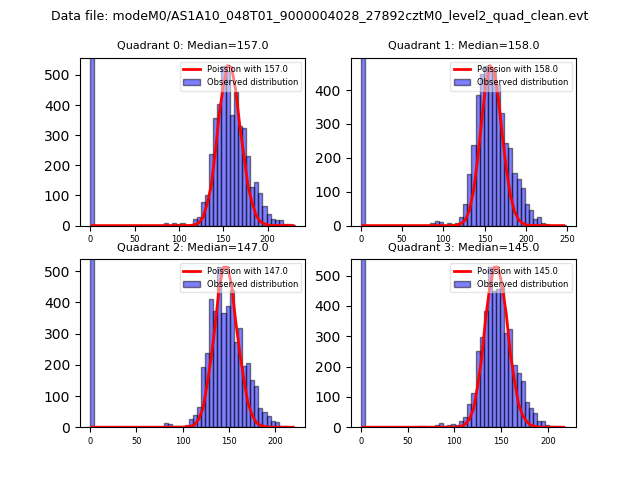 |
 |
| Quadrant-wise count rates Data is divided into 100 sec bins |
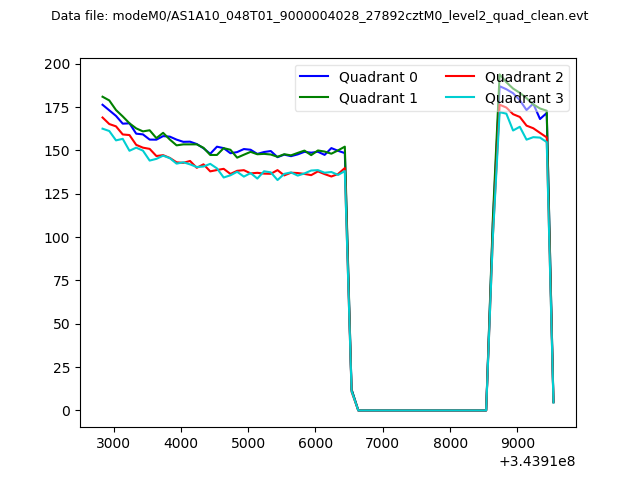 |
|
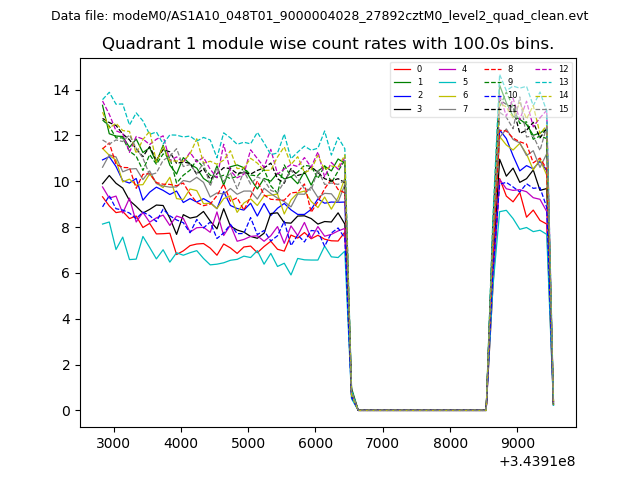
| Module-wise count rates for Quadrant A Data is divided into 100 sec bins |
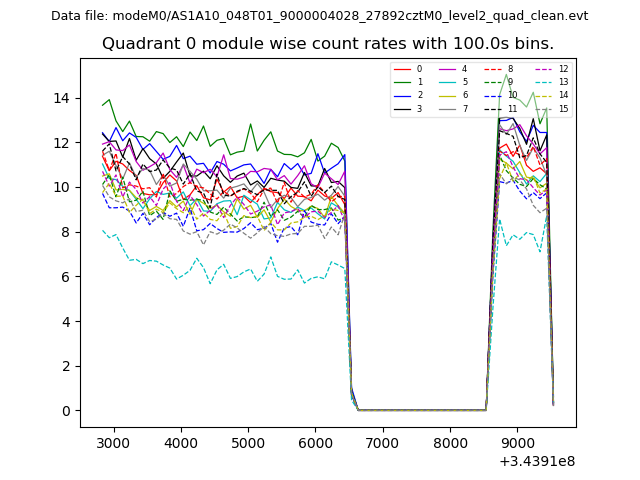 |
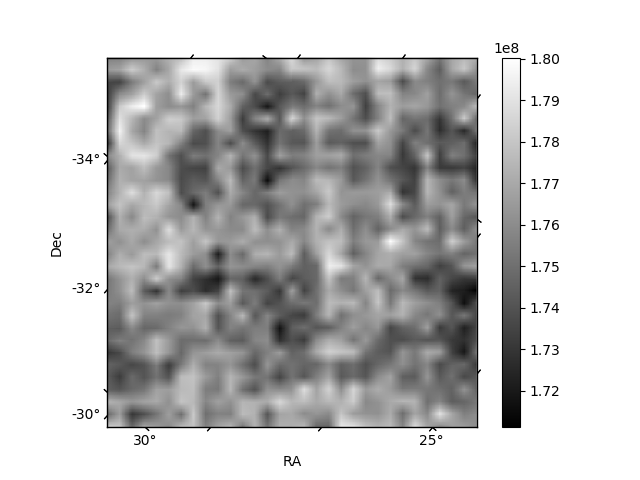 |
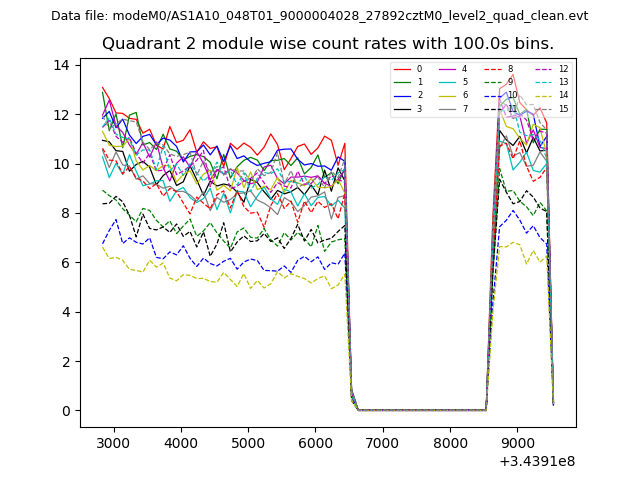
| Module-wise count rates for Quadrant B Data is divided into 100 sec bins |
 |
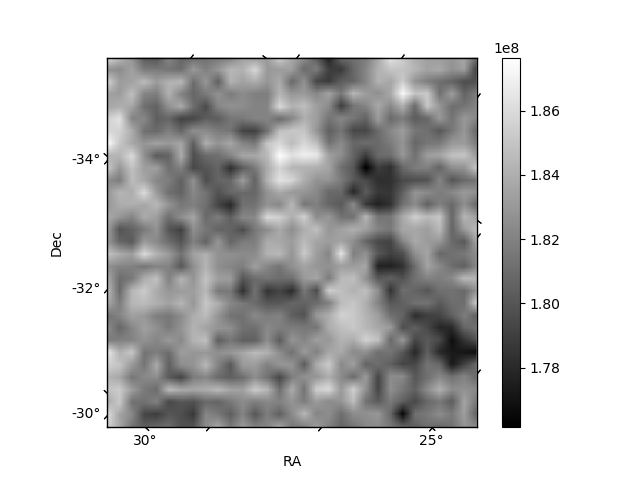 |
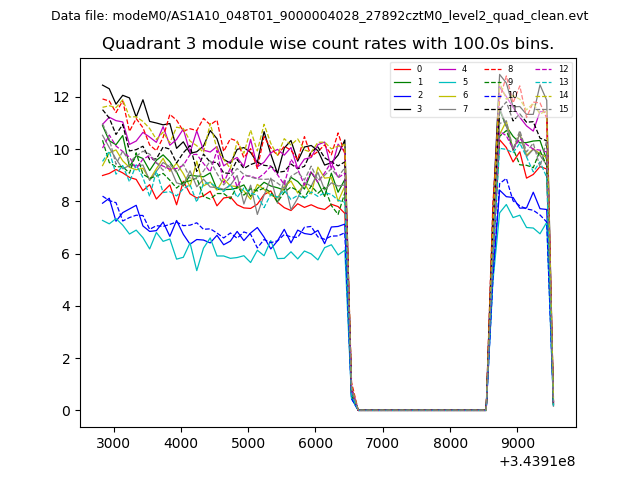
| Module-wise count rates for Quadrant C Data is divided into 100 sec bins |
 |
 |
| Module-wise count rates for Quadrant D Data is divided into 100 sec bins |
 |
 |
| Parameter | Plot |
|---|---|
| CZT HV Monitor | 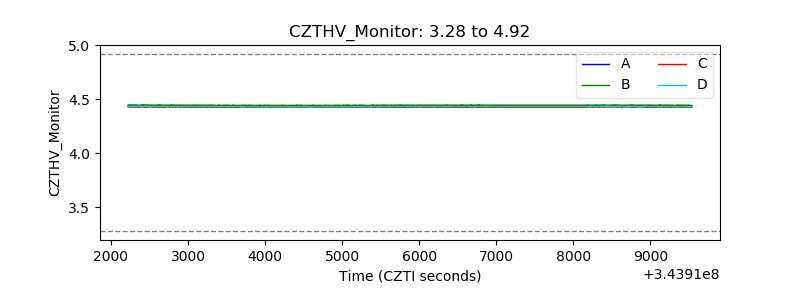 |
| D_VDD | 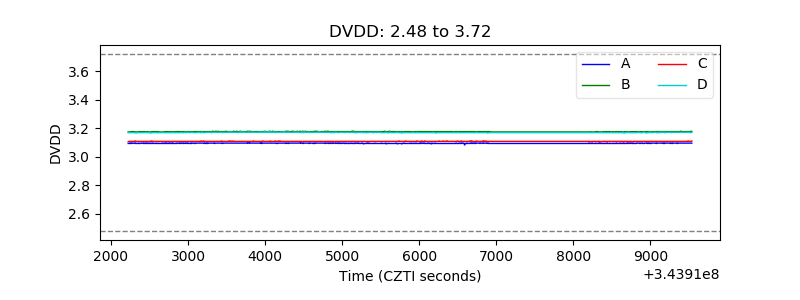 |
| Temperature 1 | 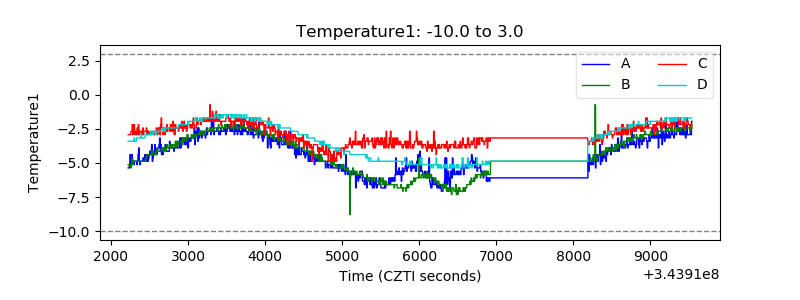 |
| Veto HV Monitor | 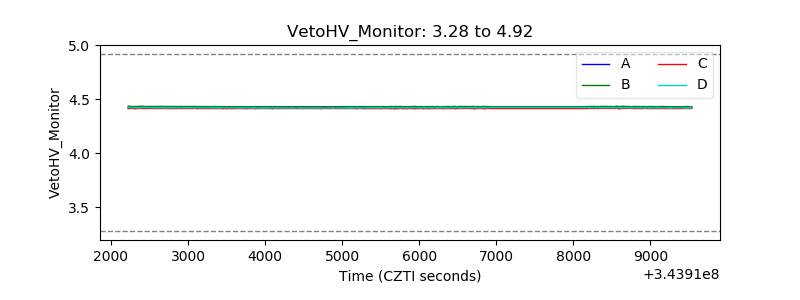 |
| Veto LLD | 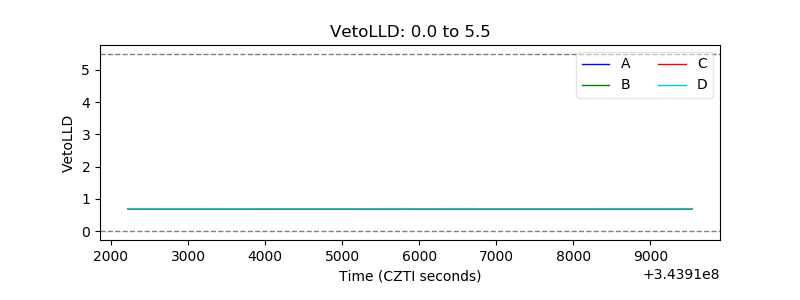 |
| Alpha Counter | 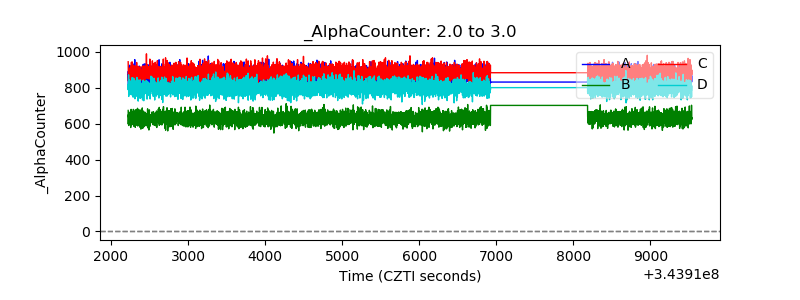 |
| _CPM_Rate | 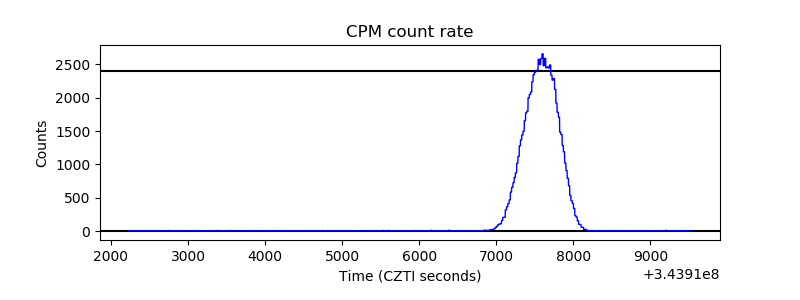 |
| CZT Counter | 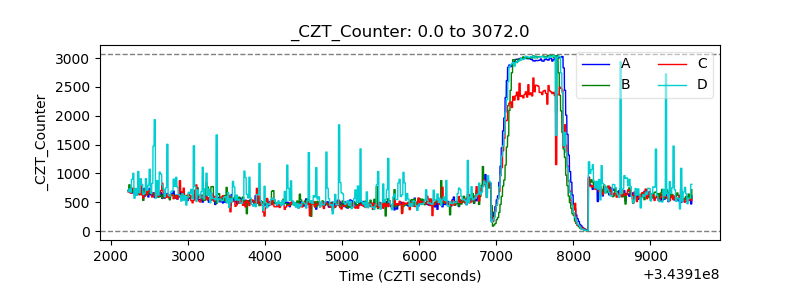 |
| +2.5 Volts monitor |  |
| +5 Volts monitor |  |
| _ROLL_ROT | 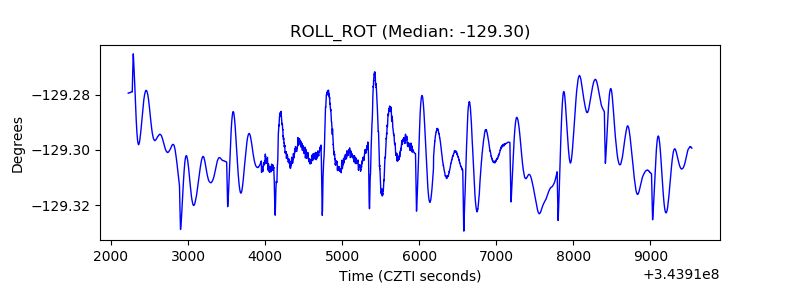 |
| _Roll_DEC | 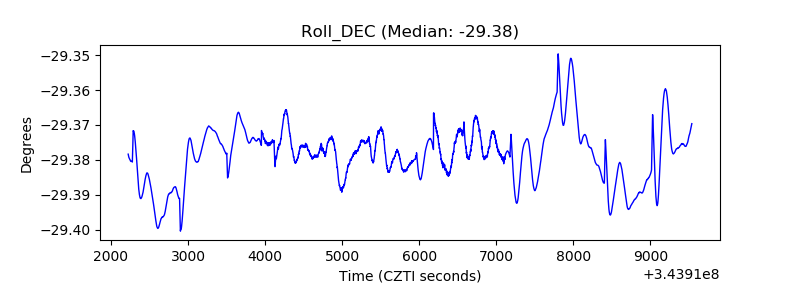 |
| _Roll_RA | 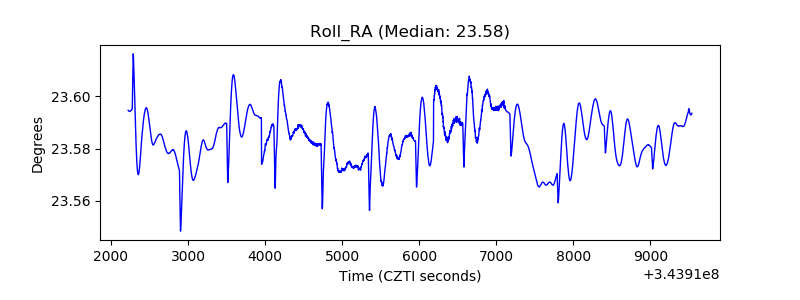 |
| Veto Counter | 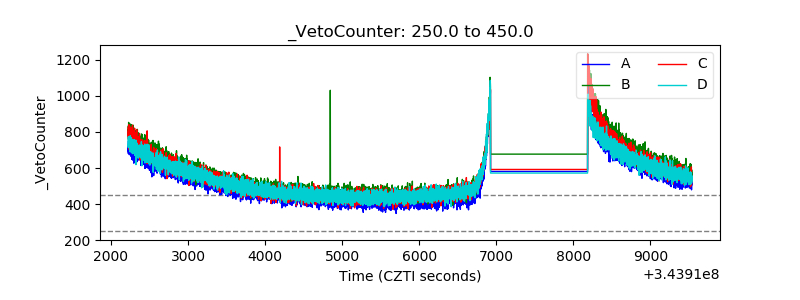 |