| Param | Original file | Final file |
|---|---|---|
| Filename | modeM0/AS1A10_048T01_9000004028_27893cztM0_level2.evt | modeM0/AS1A10_048T01_9000004028_27893cztM0_level2_quad_clean.evt |
| Size (bytes) | 1,613,525,760 | 302,639,040 |
| Size | 1.5 GB | 288.6 MB |
| Events in quadrant A | 10,805,500 | 2,018,717 |
| Events in quadrant B | 10,477,253 | 2,032,182 |
| Events in quadrant C | 10,162,369 | 1,902,880 |
| Events in quadrant D | 16,078,325 | 1,841,510 |
| Mode M0 | |||
|---|---|---|---|
| Quadrant | BADHDUFLAG | Total packets | Discarded packets |
| A | 0 | 44906 | 0 |
| B | 0 | 43618 | 0 |
| C | 0 | 42741 | 0 |
| D | 0 | 61433 | 0 |
| Mode M9 | |||
|---|---|---|---|
| Quadrant | BADHDUFLAG | Total packets | Discarded packets |
| A | 0 | 34 | 0 |
| B | 0 | 34 | 0 |
| C | 0 | 34 | 0 |
| D | 0 | 34 | 0 |
| Quadrant | Total seconds | Saturated seconds | Saturation percentage |
|---|---|---|---|
| A | 19919 | 235 | 1.179778% |
| B | 19920 | 232 | 1.164659% |
| C | 19920 | 308 | 1.546185% |
| D | 19920 | 1016 | 5.100402% |
Noise dominated data is calculated using 1-second bins in cleaned event files. If a bin has >2000 counts, and if more than 50% of those come from <1% of pixels, then it is considered to be noise-dominated and hence unusable.
| Quadrant | # 1 sec bins | Bins with >0 counts | Bins with >2000 counts | High rate bins dominated by noise | Noise dominated (total time) | Noise dominated (detector-on time) | Marked lightcurve |
|---|---|---|---|---|---|---|---|
| A | 32953 | 19920 | 10 | 10 | 0.03% | 0.05% | 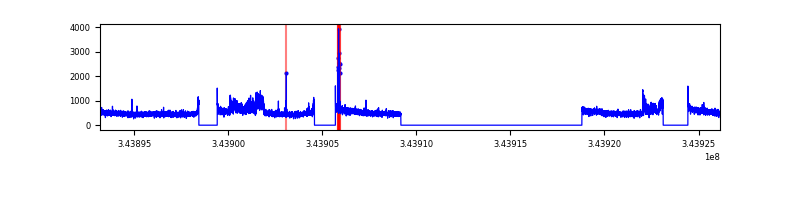 |
| B | 32954 | 19921 | 6 | 6 | 0.02% | 0.03% | 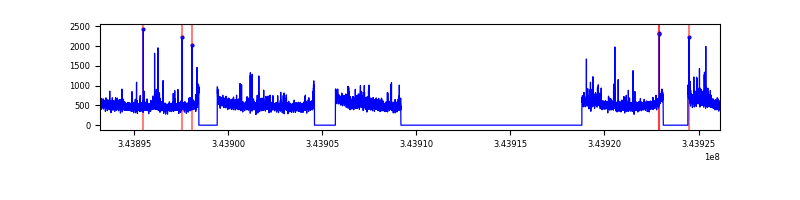 |
| C | 32954 | 19921 | 0 | 0 | 0.00% | 0.00% | 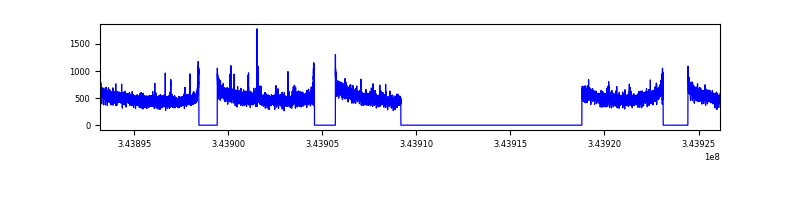 |
| D | 32954 | 19921 | 809 | 809 | 2.45% | 4.06% | 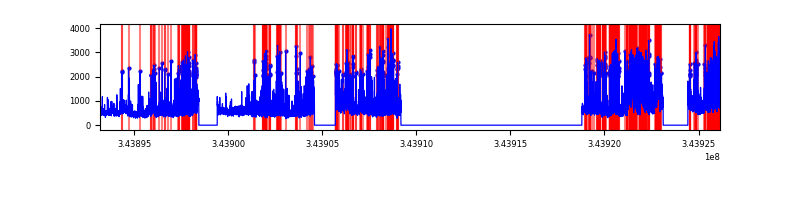 |
Top three noisy pixels from each quadrant. If the there are fewer than three noisy pixels in the level2.evt file, extra rows are filled as -1
| Pixel properties | Quadrant properties | ||||||
|---|---|---|---|---|---|---|---|
| Quadrant | DetID | PixID | Counts | Sigma | Mean | Median | Sigma |
| A | 6 | 16 | 729507 | 1418.4 | 2599 | 2552 | 512.5 |
| A | 4 | 2 | 32926 | 59.26 | 2599 | 2552 | 512.5 |
| A | 13 | 254 | 30700 | 54.92 | 2599 | 2552 | 512.5 |
| B | 0 | 230 | 209219 | 432.77 | 2574 | 2519 | 477.6 |
| B | 10 | 245 | 136383 | 280.27 | 2574 | 2519 | 477.6 |
| B | 12 | 111 | 58266 | 116.72 | 2574 | 2519 | 477.6 |
| C | 14 | 238 | 398415 | 700.55 | 2450 | 2471 | 565.2 |
| C | 3 | 233 | 142368 | 247.52 | 2450 | 2471 | 565.2 |
| C | 6 | 112 | 66245 | 112.84 | 2450 | 2471 | 565.2 |
| D | 1 | 52 | 3607826 | 6251.83 | 2455 | 2390 | 576.7 |
| D | 13 | 104 | 1588128 | 2749.67 | 2455 | 2390 | 576.7 |
| D | 7 | 238 | 857356 | 1482.51 | 2455 | 2390 | 576.7 |
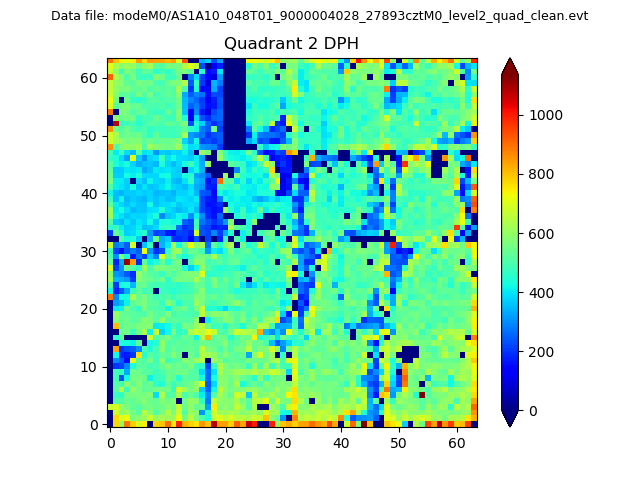
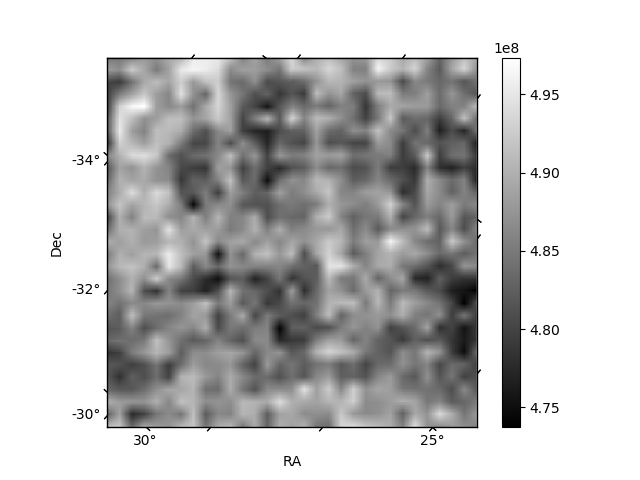
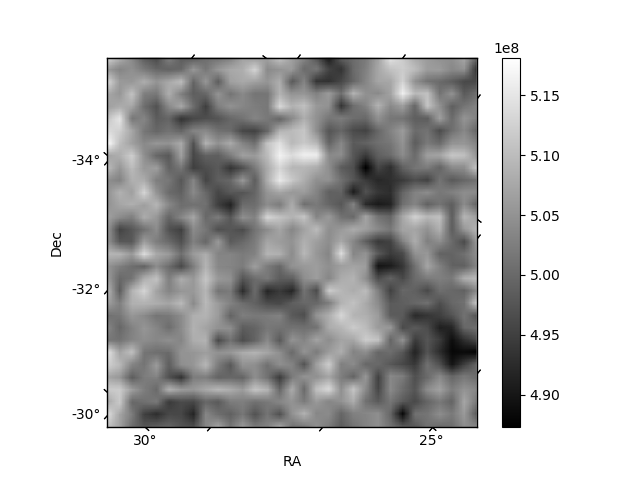
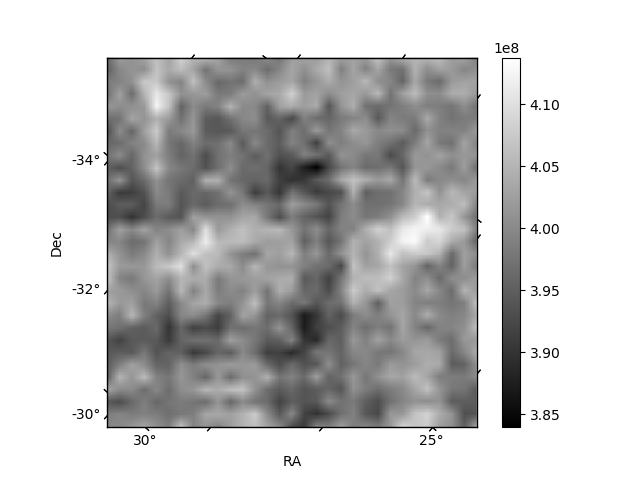
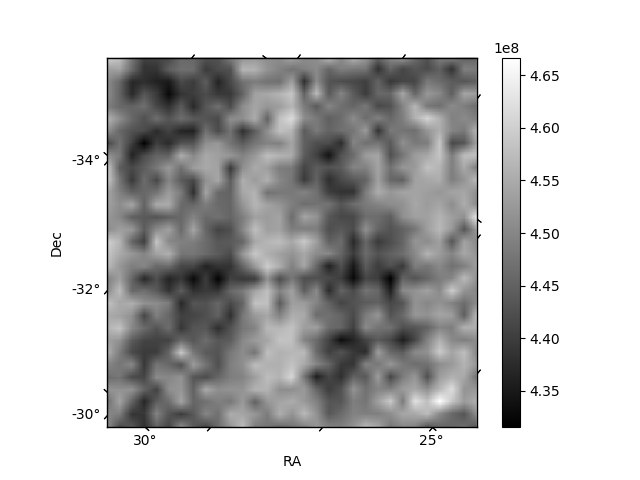
Histogram calculated using DETX and DETY for each event in the final _common_clean file
| Quadrant A | 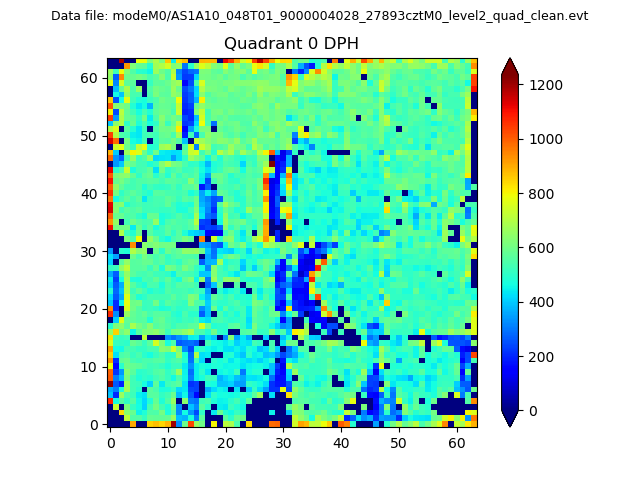 |
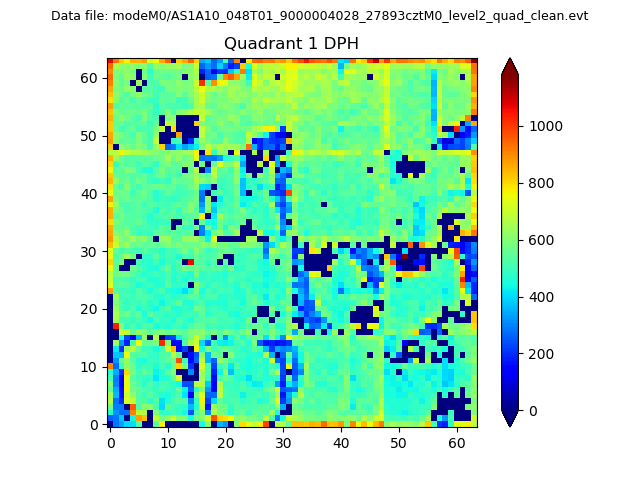 |
Quadrant B |
|---|---|---|---|
| Quadrant D | 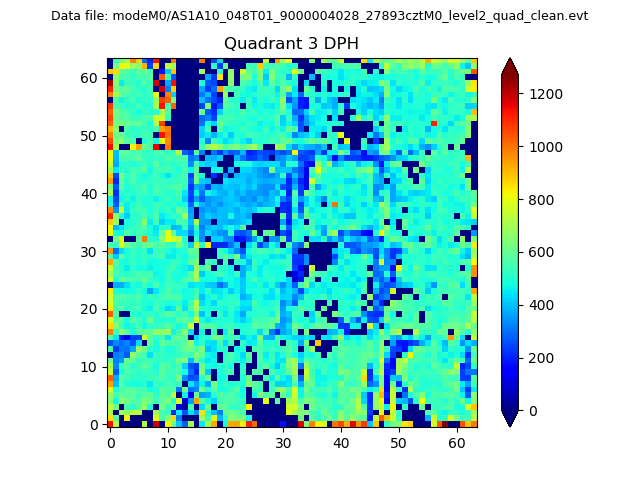 |
 |
Quadrant C |
| Plot type | Count rate plots | Images |
|---|---|---|
| Comparison with Poisson distribution Blue bars denote a histogram of data divided into 1 sec bins. Red curve is a Poisson curve with rate = median count rate of data. |
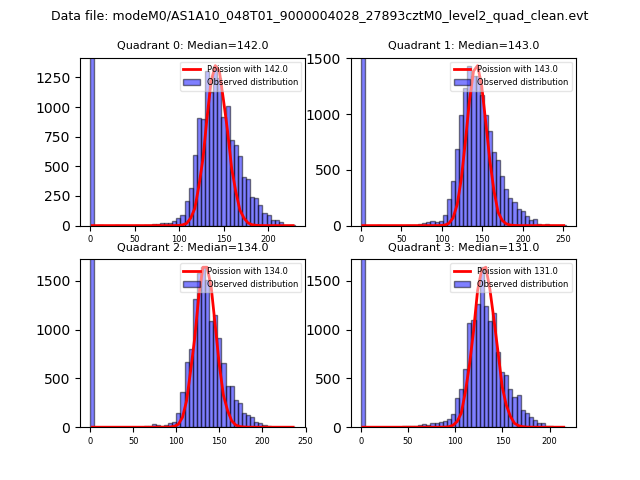 |
 |
| Quadrant-wise count rates Data is divided into 100 sec bins |
 |
|
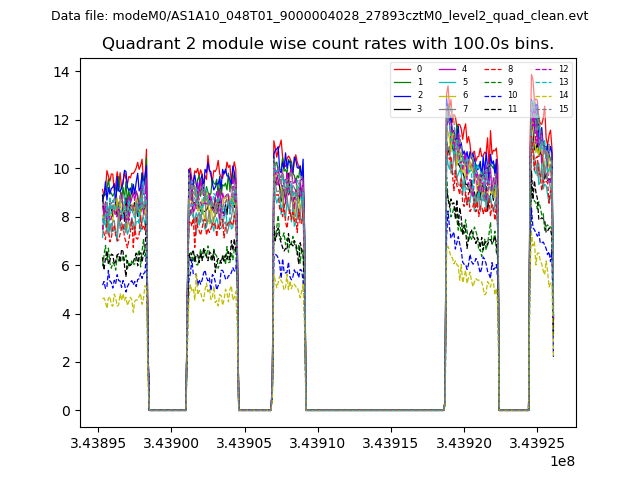
| Module-wise count rates for Quadrant A Data is divided into 100 sec bins |
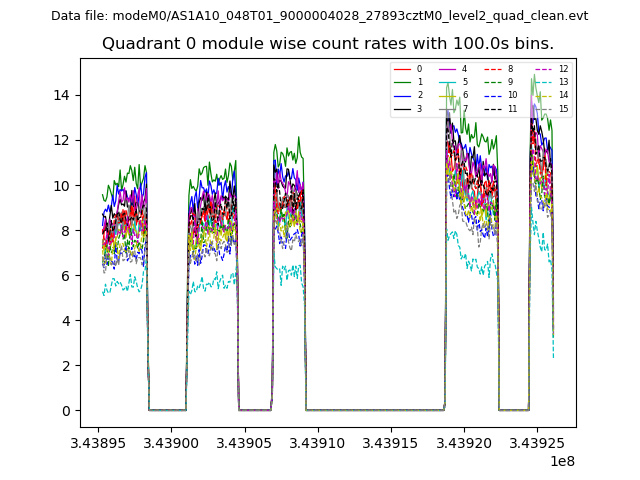 |
 |
| Module-wise count rates for Quadrant B Data is divided into 100 sec bins |
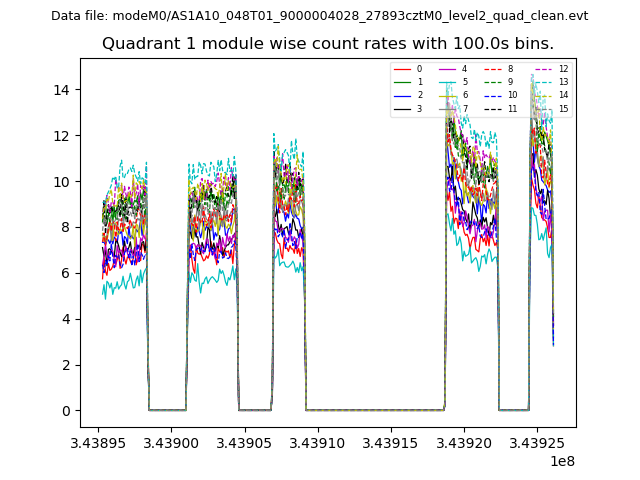 |
 |
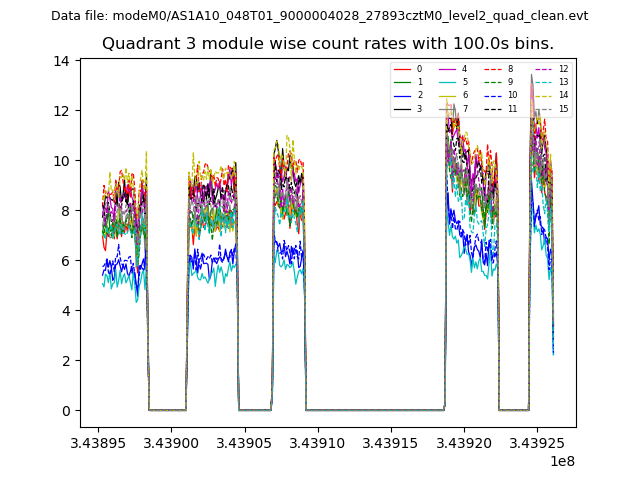
| Module-wise count rates for Quadrant C Data is divided into 100 sec bins |
 |
 |
| Module-wise count rates for Quadrant D Data is divided into 100 sec bins |
 |
 |
| Parameter | Plot |
|---|---|
| CZT HV Monitor | 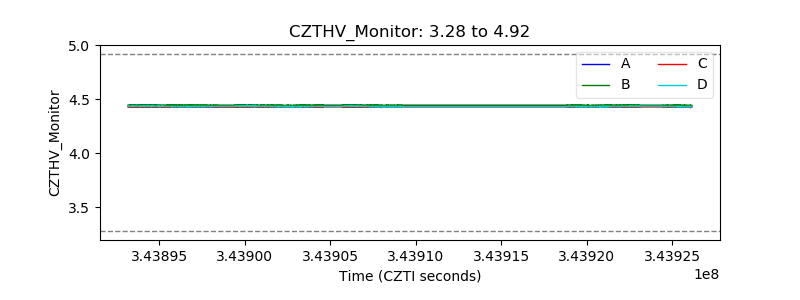 |
| D_VDD | 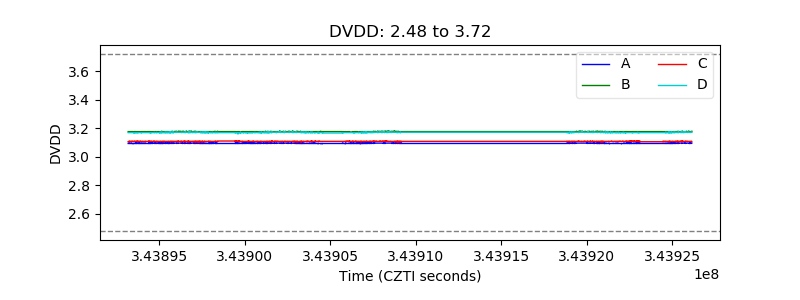 |
| Temperature 1 | 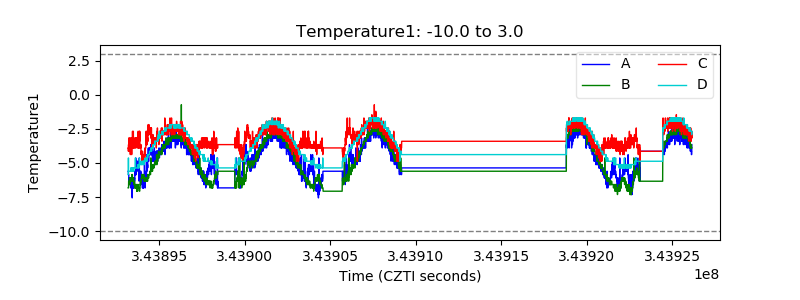 |
| Veto HV Monitor | 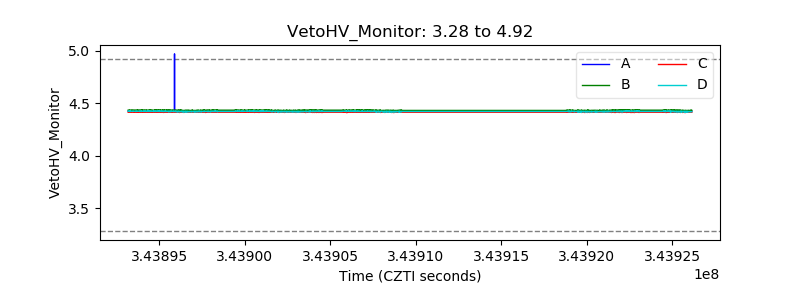 |
| Veto LLD |  |
| Alpha Counter | 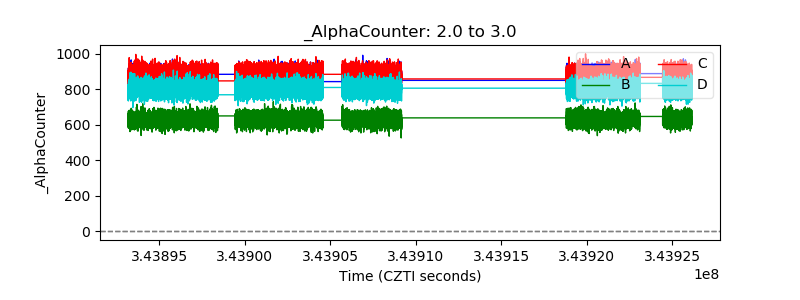 |
| _CPM_Rate | 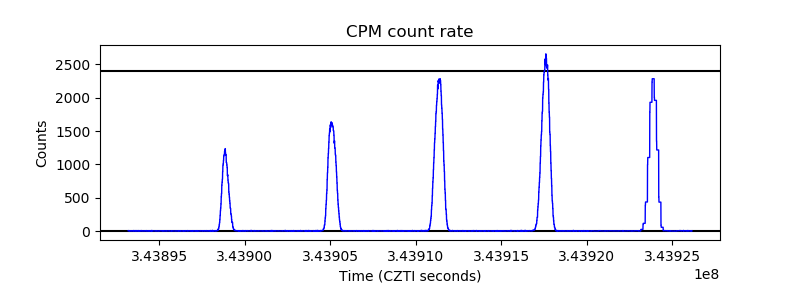 |
| CZT Counter | 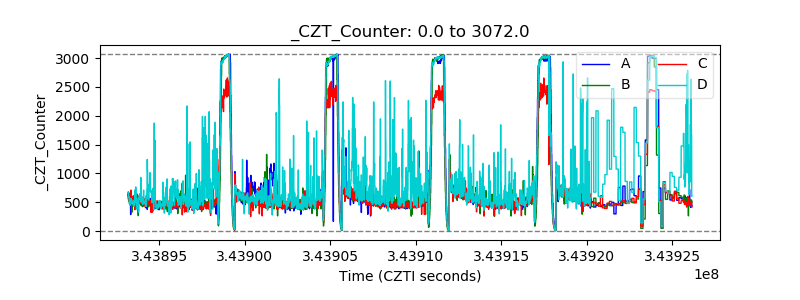 |
| +2.5 Volts monitor |  |
| +5 Volts monitor |  |
| _ROLL_ROT | 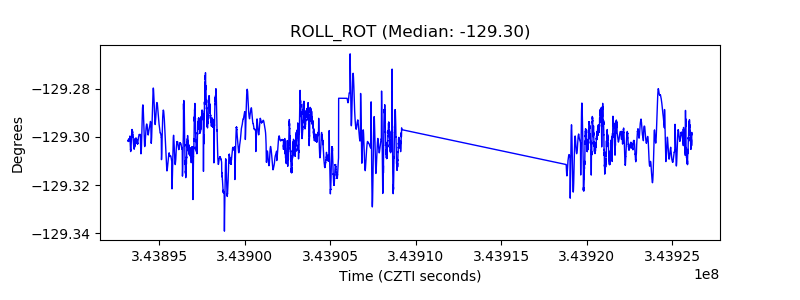 |
| _Roll_DEC | 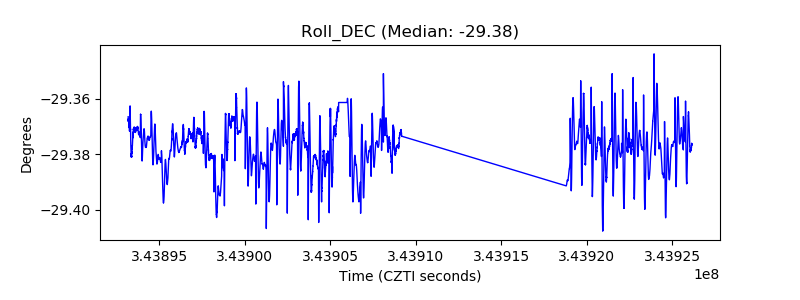 |
| _Roll_RA |  |
| Veto Counter | 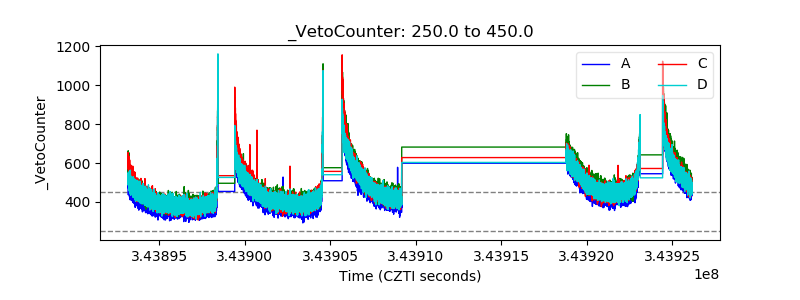 |