| Param | Original file | Final file |
|---|---|---|
| Filename | modeM0/AS1A10_048T01_9000004028_27894cztM0_level2.evt | modeM0/AS1A10_048T01_9000004028_27894cztM0_level2_quad_clean.evt |
| Size (bytes) | 512,559,360 | 108,040,320 |
| Size | 488.8 MB | 103.0 MB |
| Events in quadrant A | 3,106,434 | 747,009 |
| Events in quadrant B | 3,193,310 | 754,692 |
| Events in quadrant C | 3,064,651 | 689,584 |
| Events in quadrant D | 5,750,419 | 660,416 |
| Mode M0 | |||
|---|---|---|---|
| Quadrant | BADHDUFLAG | Total packets | Discarded packets |
| A | 0 | 12861 | 0 |
| B | 0 | 13150 | 0 |
| C | 0 | 12772 | 0 |
| D | 0 | 21326 | 0 |
| Mode M9 | |||
|---|---|---|---|
| Quadrant | BADHDUFLAG | Total packets | Discarded packets |
| A | 0 | 13 | 0 |
| B | 0 | 13 | 0 |
| C | 0 | 13 | 0 |
| D | 0 | 13 | 0 |
| Quadrant | Total seconds | Saturated seconds | Saturation percentage |
|---|---|---|---|
| A | 6026 | 122 | 2.024560% |
| B | 6027 | 125 | 2.074000% |
| C | 6027 | 116 | 1.924672% |
| D | 6026 | 555 | 9.210090% |
Noise dominated data is calculated using 1-second bins in cleaned event files. If a bin has >2000 counts, and if more than 50% of those come from <1% of pixels, then it is considered to be noise-dominated and hence unusable.
| Quadrant | # 1 sec bins | Bins with >0 counts | Bins with >2000 counts | High rate bins dominated by noise | Noise dominated (total time) | Noise dominated (detector-on time) | Marked lightcurve |
|---|---|---|---|---|---|---|---|
| A | 7266 | 6026 | 0 | 0 | 0.00% | 0.00% | 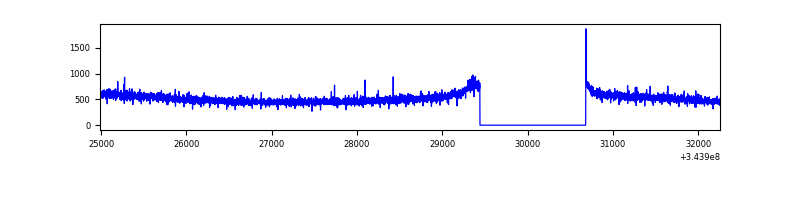 |
| B | 7267 | 6027 | 2 | 2 | 0.03% | 0.03% | 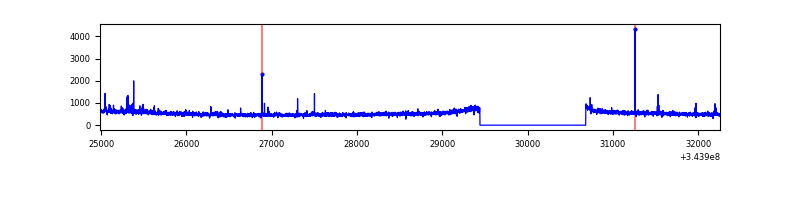 |
| C | 7267 | 6027 | 0 | 0 | 0.00% | 0.00% | 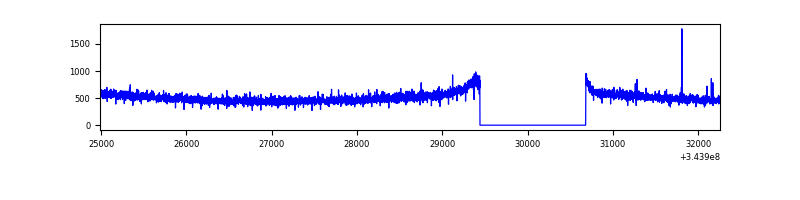 |
| D | 7266 | 6026 | 369 | 369 | 5.08% | 6.12% | 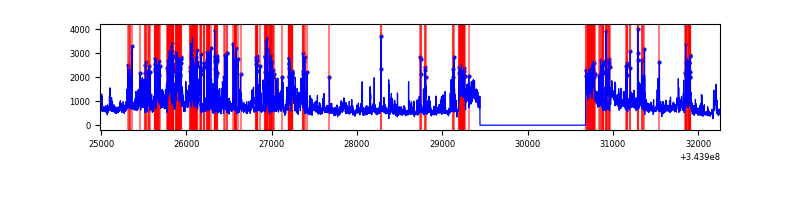 |
Top three noisy pixels from each quadrant. If the there are fewer than three noisy pixels in the level2.evt file, extra rows are filled as -1
| Pixel properties | Quadrant properties | ||||||
|---|---|---|---|---|---|---|---|
| Quadrant | DetID | PixID | Counts | Sigma | Mean | Median | Sigma |
| A | 13 | 254 | 10275 | 59.47 | 804 | 791 | 159.5 |
| A | 3 | 137 | 7291 | 40.76 | 804 | 791 | 159.5 |
| A | 0 | 226 | 6934 | 38.52 | 804 | 791 | 159.5 |
| B | 0 | 230 | 41740 | 270.35 | 795 | 776 | 151.5 |
| B | 10 | 245 | 26320 | 168.59 | 795 | 776 | 151.5 |
| B | 12 | 111 | 17813 | 112.44 | 795 | 776 | 151.5 |
| C | 14 | 238 | 123623 | 709.63 | 747 | 752 | 173.1 |
| C | 3 | 233 | 19165 | 106.34 | 747 | 752 | 173.1 |
| C | 2 | 16 | 5353 | 26.57 | 747 | 752 | 173.1 |
| D | 1 | 52 | 1656198 | 9444.46 | 737 | 716 | 175.3 |
| D | 8 | 195 | 737629 | 4204.06 | 737 | 716 | 175.3 |
| D | 13 | 104 | 448700 | 2555.73 | 737 | 716 | 175.3 |
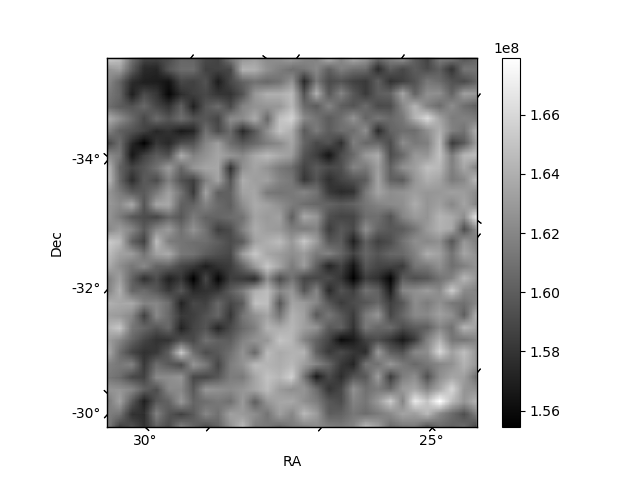
Histogram calculated using DETX and DETY for each event in the final _common_clean file
| Quadrant A | 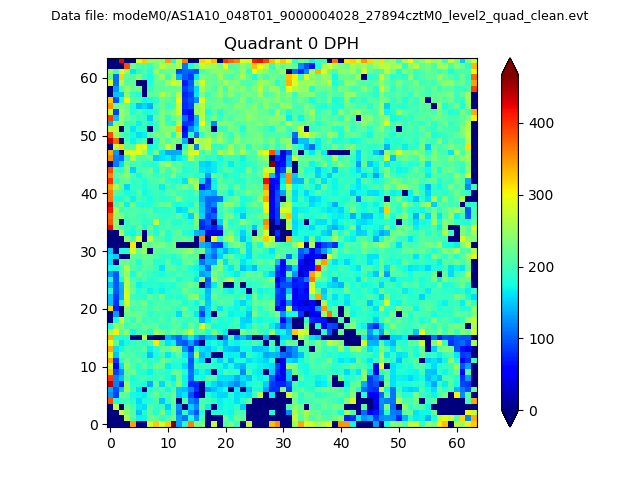 |
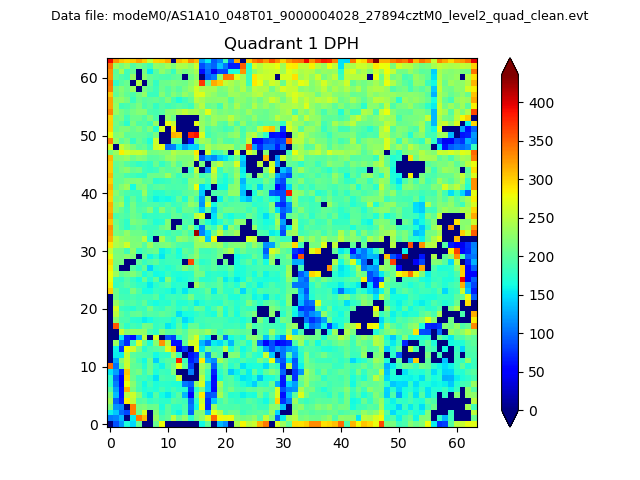 |
Quadrant B |
|---|---|---|---|
| Quadrant D | 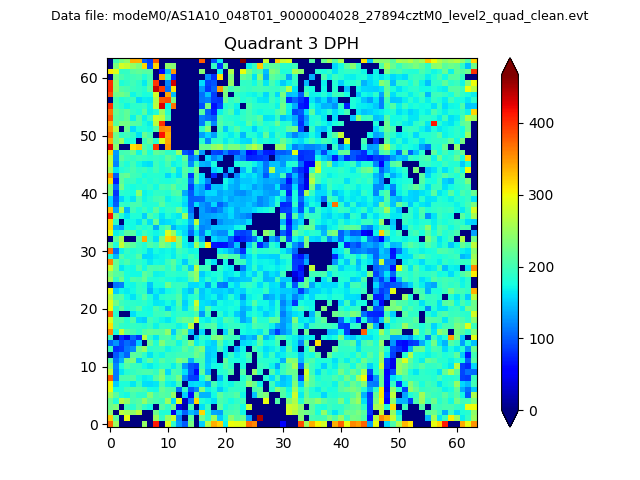 |
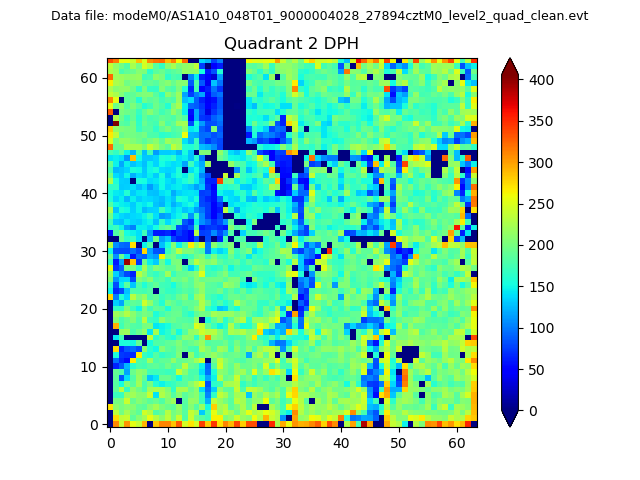 |
Quadrant C |
| Plot type | Count rate plots | Images |
|---|---|---|
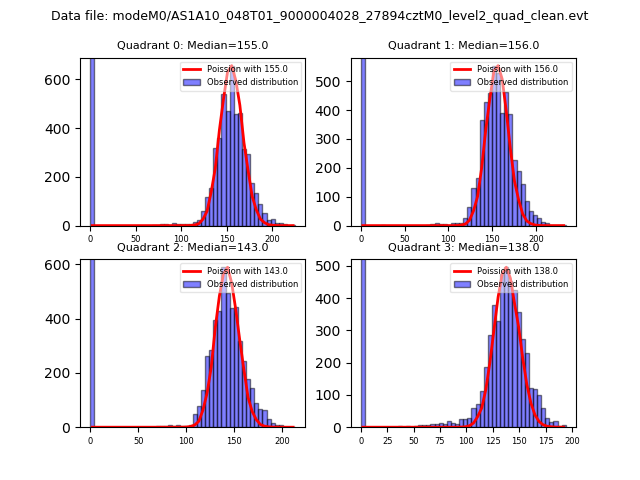
| Comparison with Poisson distribution Blue bars denote a histogram of data divided into 1 sec bins. Red curve is a Poisson curve with rate = median count rate of data. |
 |
 |
| Quadrant-wise count rates Data is divided into 100 sec bins |
 |
|
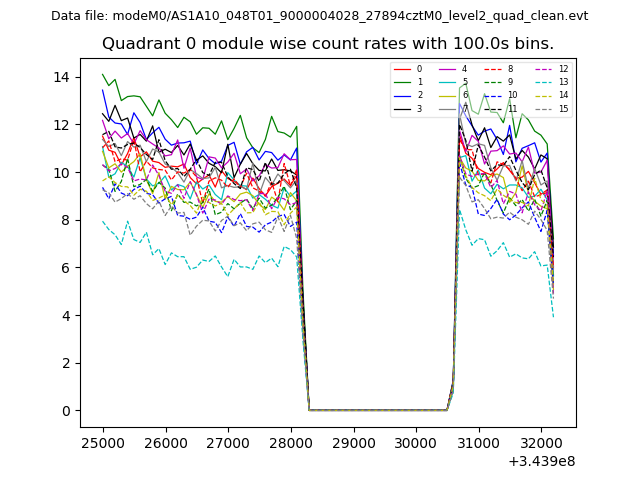
| Module-wise count rates for Quadrant A Data is divided into 100 sec bins |
 |
 |
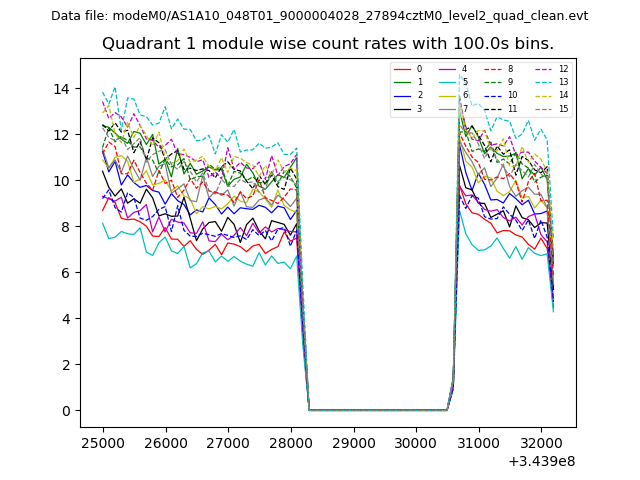
| Module-wise count rates for Quadrant B Data is divided into 100 sec bins |
 |
 |
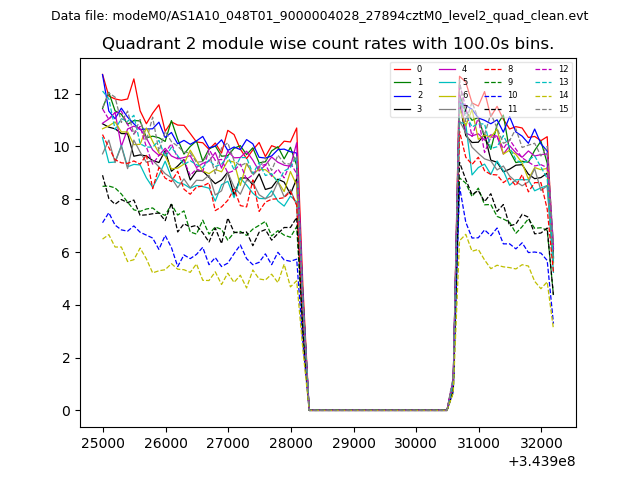
| Module-wise count rates for Quadrant C Data is divided into 100 sec bins |
 |
 |
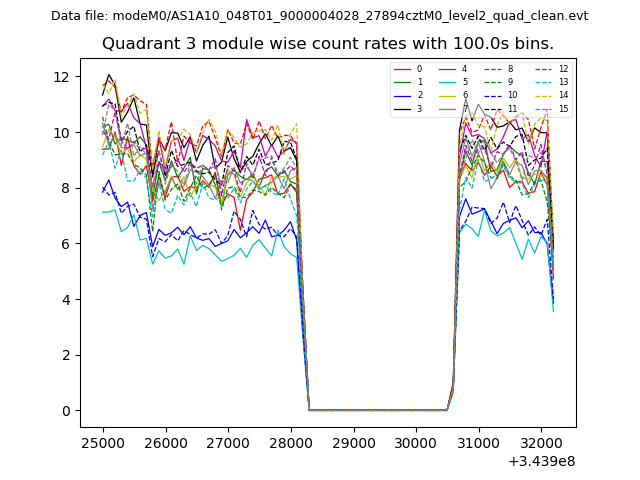
| Module-wise count rates for Quadrant D Data is divided into 100 sec bins |
 |
 |
| Parameter | Plot |
|---|---|
| CZT HV Monitor | 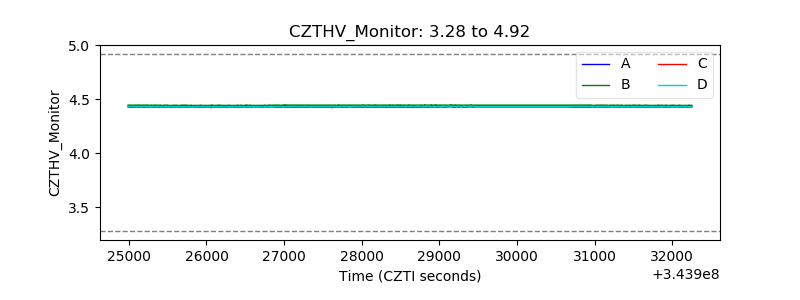 |
| D_VDD | 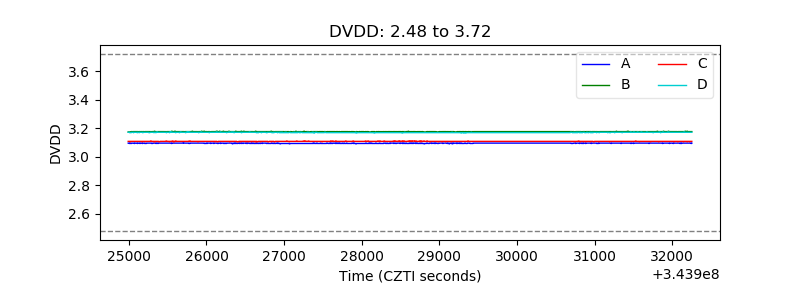 |
| Temperature 1 | 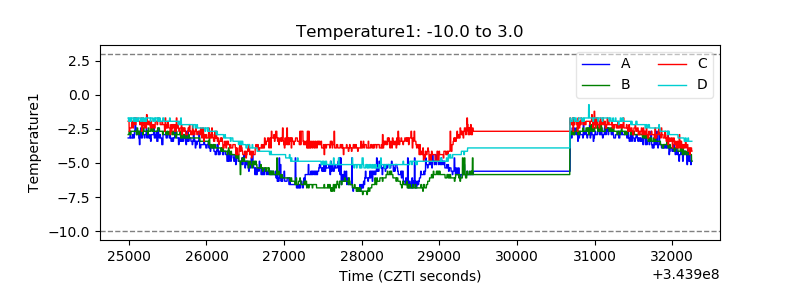 |
| Veto HV Monitor | 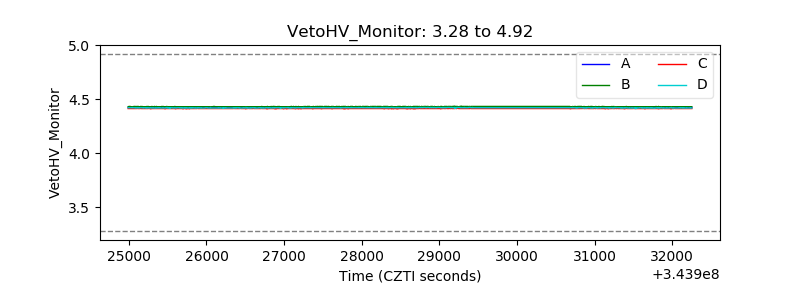 |
| Veto LLD | 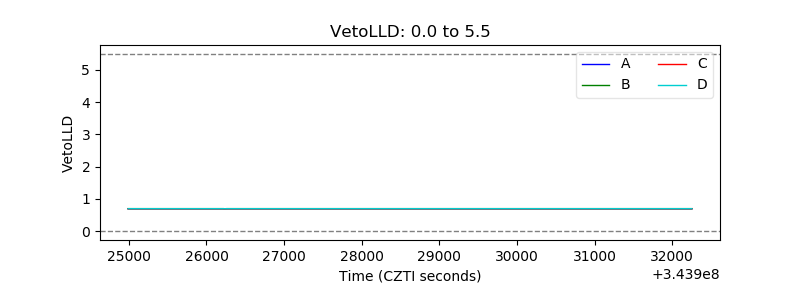 |
| Alpha Counter | 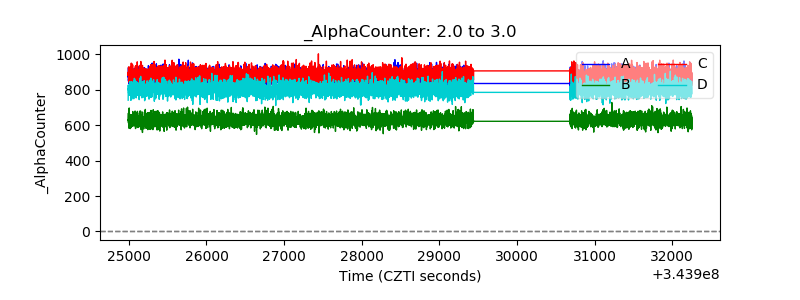 |
| _CPM_Rate | 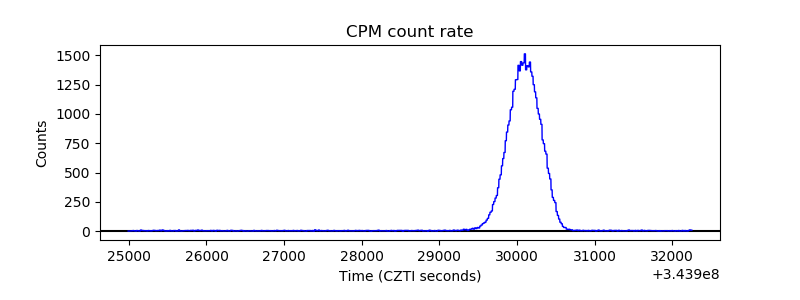 |
| CZT Counter | 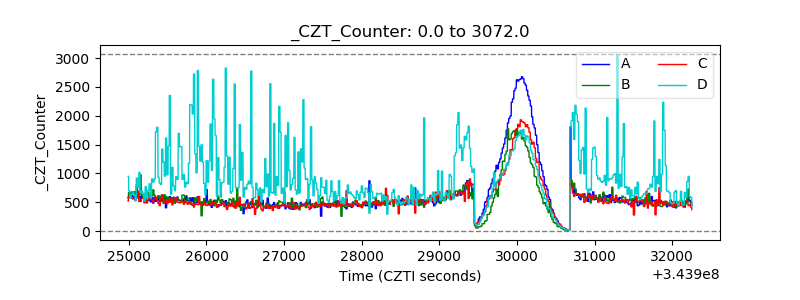 |
| +2.5 Volts monitor |  |
| +5 Volts monitor |  |
| _ROLL_ROT | 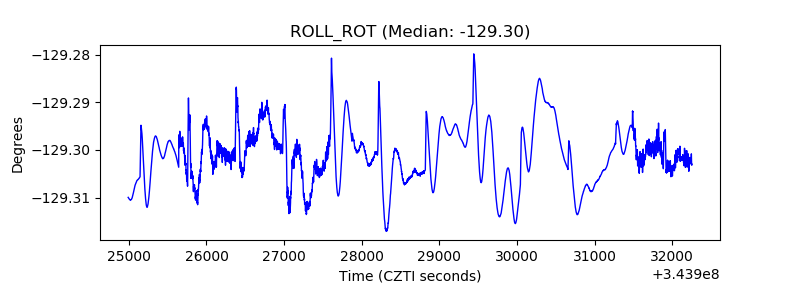 |
| _Roll_DEC | 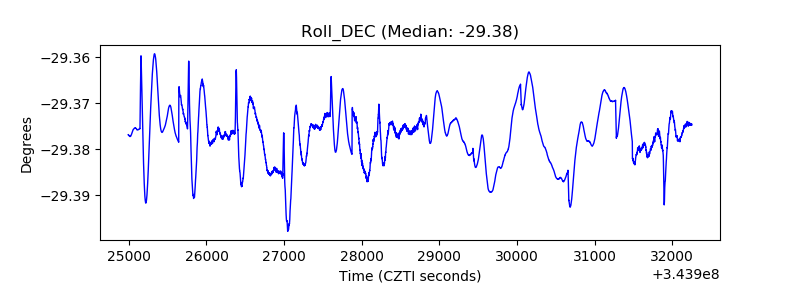 |
| _Roll_RA |  |
| Veto Counter | 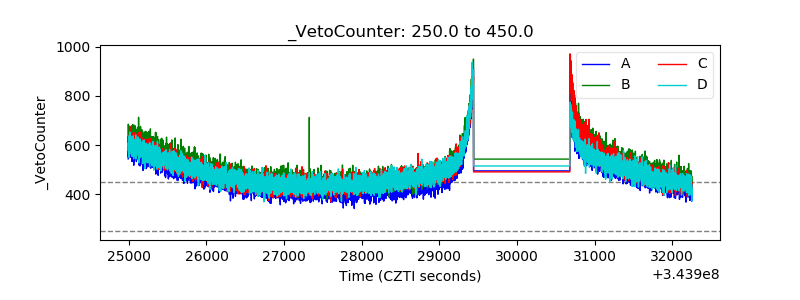 |