| Param | Original file | Final file |
|---|---|---|
| Filename | modeM0/AS1A10_048T01_9000004028_27895cztM0_level2.evt | modeM0/AS1A10_048T01_9000004028_27895cztM0_level2_quad_clean.evt |
| Size (bytes) | 890,282,880 | 166,501,440 |
| Size | 849.0 MB | 158.8 MB |
| Events in quadrant A | 5,302,402 | 1,130,429 |
| Events in quadrant B | 5,444,771 | 1,136,749 |
| Events in quadrant C | 5,467,272 | 1,041,738 |
| Events in quadrant D | 10,025,557 | 993,974 |
| Mode M0 | |||
|---|---|---|---|
| Quadrant | BADHDUFLAG | Total packets | Discarded packets |
| A | 0 | 22495 | 0 |
| B | 0 | 22771 | 0 |
| C | 0 | 23187 | 0 |
| D | 0 | 37208 | 0 |
| Mode M9 | |||
|---|---|---|---|
| Quadrant | BADHDUFLAG | Total packets | Discarded packets |
| A | 0 | 24 | 0 |
| B | 0 | 24 | 0 |
| C | 0 | 24 | 0 |
| D | 0 | 24 | 0 |
| Quadrant | Total seconds | Saturated seconds | Saturation percentage |
|---|---|---|---|
| A | 10694 | 171 | 1.599027% |
| B | 10694 | 179 | 1.673836% |
| C | 10694 | 211 | 1.973069% |
| D | 10694 | 1020 | 9.538059% |
Noise dominated data is calculated using 1-second bins in cleaned event files. If a bin has >2000 counts, and if more than 50% of those come from <1% of pixels, then it is considered to be noise-dominated and hence unusable.
| Quadrant | # 1 sec bins | Bins with >0 counts | Bins with >2000 counts | High rate bins dominated by noise | Noise dominated (total time) | Noise dominated (detector-on time) | Marked lightcurve |
|---|---|---|---|---|---|---|---|
| A | 13004 | 10694 | 1 | 1 | 0.01% | 0.01% | 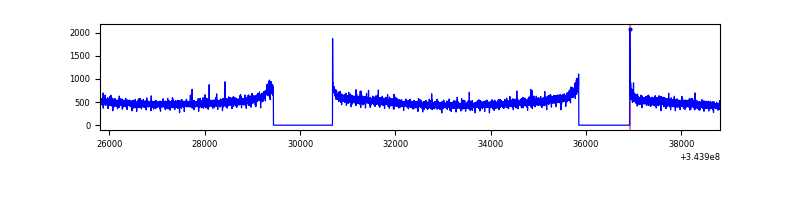 |
| B | 13004 | 10694 | 3 | 3 | 0.02% | 0.03% | 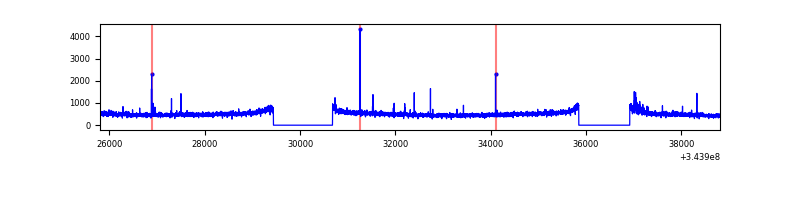 |
| C | 13004 | 10695 | 7 | 7 | 0.05% | 0.07% | 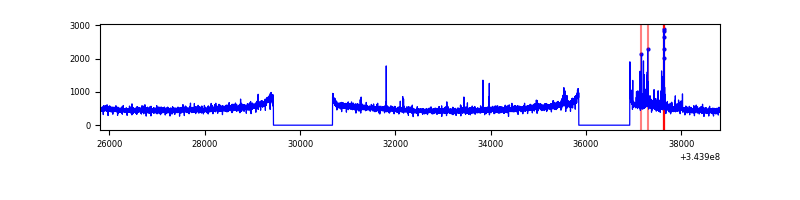 |
| D | 13004 | 10695 | 689 | 689 | 5.30% | 6.44% | 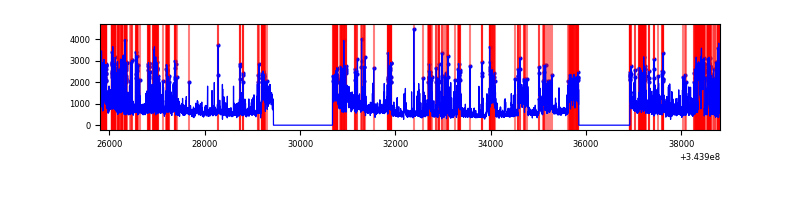 |
Top three noisy pixels from each quadrant. If the there are fewer than three noisy pixels in the level2.evt file, extra rows are filled as -1
| Pixel properties | Quadrant properties | ||||||
|---|---|---|---|---|---|---|---|
| Quadrant | DetID | PixID | Counts | Sigma | Mean | Median | Sigma |
| A | 13 | 254 | 18675 | 63.62 | 1372 | 1352 | 272.3 |
| A | 3 | 137 | 12833 | 42.17 | 1372 | 1352 | 272.3 |
| A | 0 | 226 | 11651 | 37.82 | 1372 | 1352 | 272.3 |
| B | 0 | 230 | 66751 | 255.24 | 1360 | 1328 | 256.3 |
| B | 12 | 111 | 31128 | 116.26 | 1360 | 1328 | 256.3 |
| B | 11 | 111 | 27973 | 103.95 | 1360 | 1328 | 256.3 |
| C | 14 | 238 | 210718 | 706.51 | 1284 | 1295 | 296.4 |
| C | 2 | 16 | 134411 | 449.08 | 1284 | 1295 | 296.4 |
| C | 3 | 233 | 115017 | 383.65 | 1284 | 1295 | 296.4 |
| D | 1 | 52 | 2812564 | 9389.43 | 1257 | 1225 | 299.4 |
| D | 13 | 104 | 1531815 | 5111.93 | 1257 | 1225 | 299.4 |
| D | 8 | 195 | 700168 | 2334.36 | 1257 | 1225 | 299.4 |
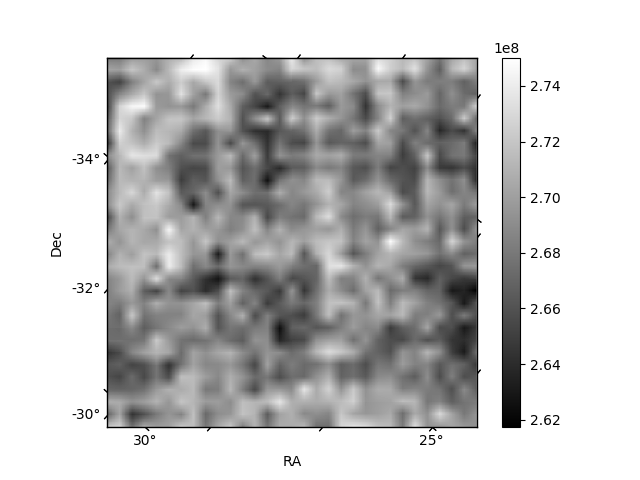
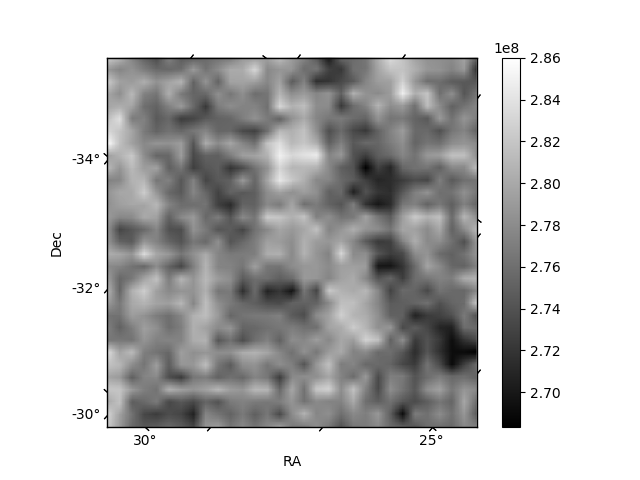
Histogram calculated using DETX and DETY for each event in the final _common_clean file
| Quadrant A |  |
 |
Quadrant B |
|---|---|---|---|
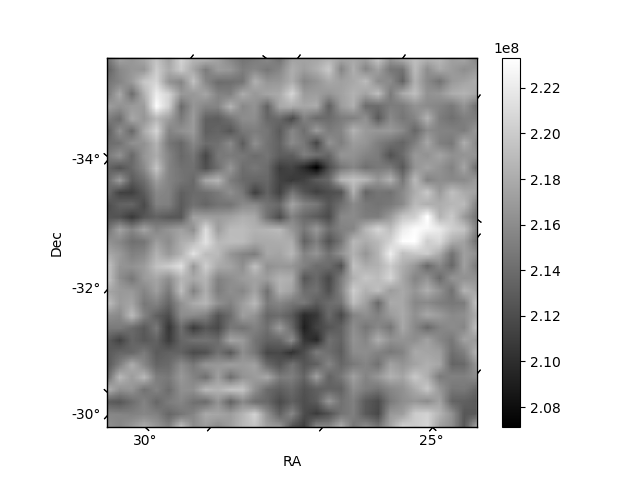
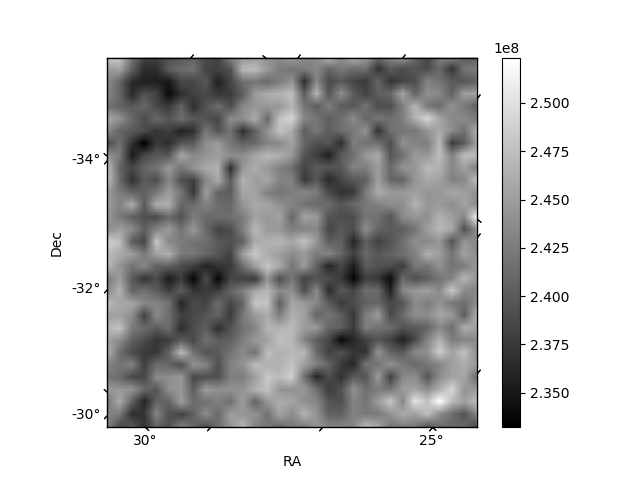
| Quadrant D |  |
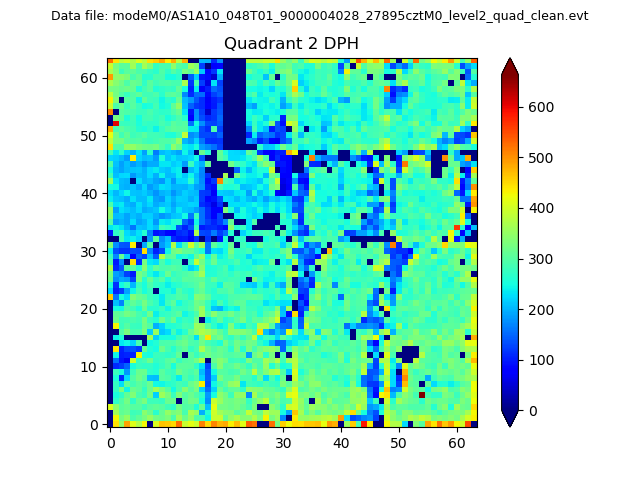 |
Quadrant C |
| Plot type | Count rate plots | Images |
|---|---|---|
| Comparison with Poisson distribution Blue bars denote a histogram of data divided into 1 sec bins. Red curve is a Poisson curve with rate = median count rate of data. |
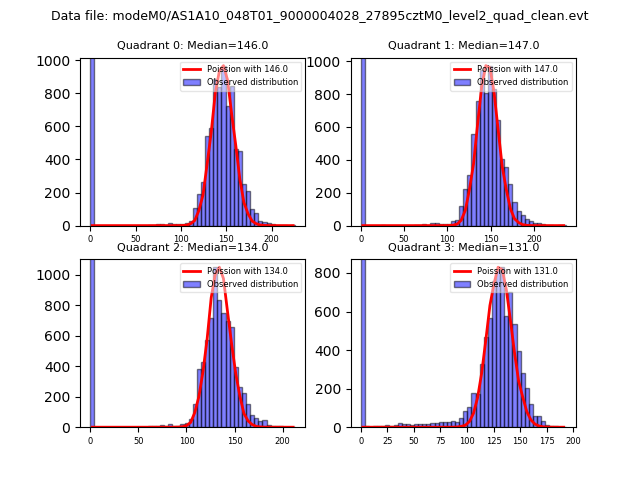 |
 |
| Quadrant-wise count rates Data is divided into 100 sec bins |
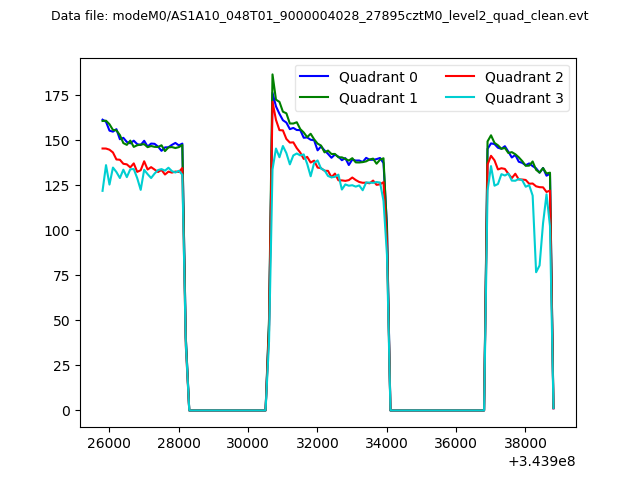 |
|
| Module-wise count rates for Quadrant A Data is divided into 100 sec bins |
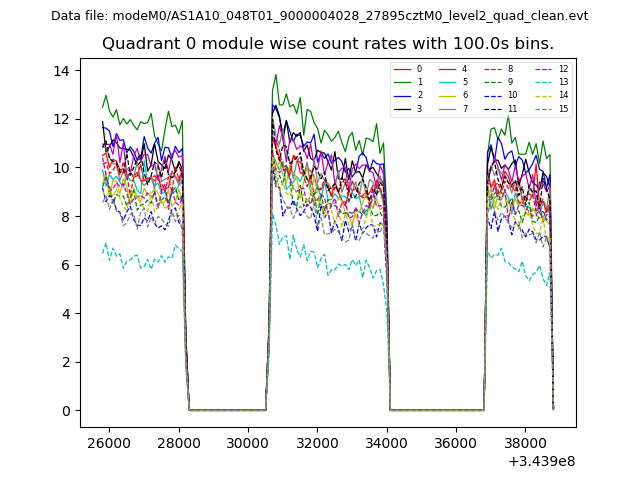 |
 |
| Module-wise count rates for Quadrant B Data is divided into 100 sec bins |
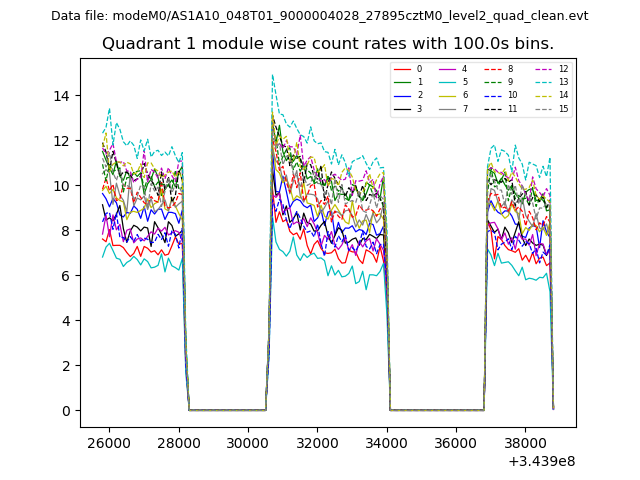 |
 |
| Module-wise count rates for Quadrant C Data is divided into 100 sec bins |
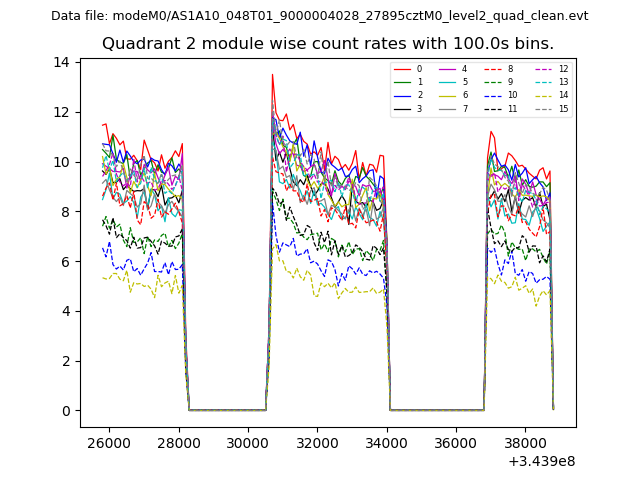 |
 |
| Module-wise count rates for Quadrant D Data is divided into 100 sec bins |
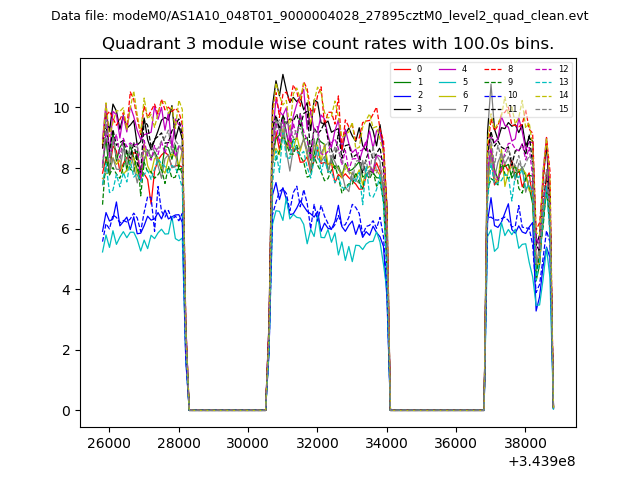 |
 |
| Parameter | Plot |
|---|---|
| CZT HV Monitor | 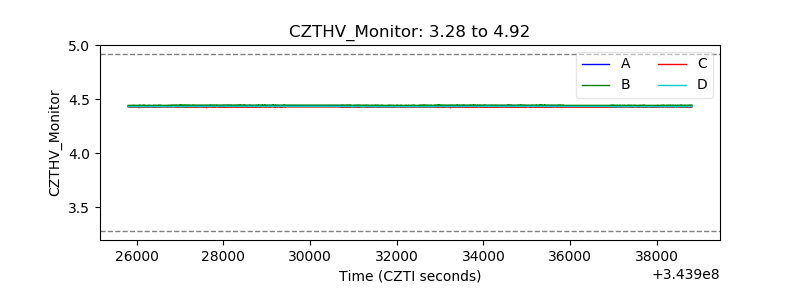 |
| D_VDD |  |
| Temperature 1 | 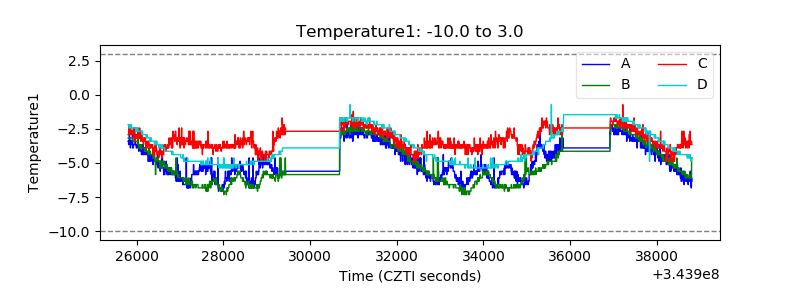 |
| Veto HV Monitor | 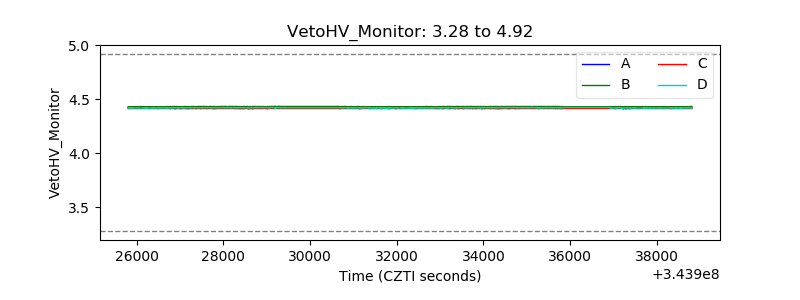 |
| Veto LLD | 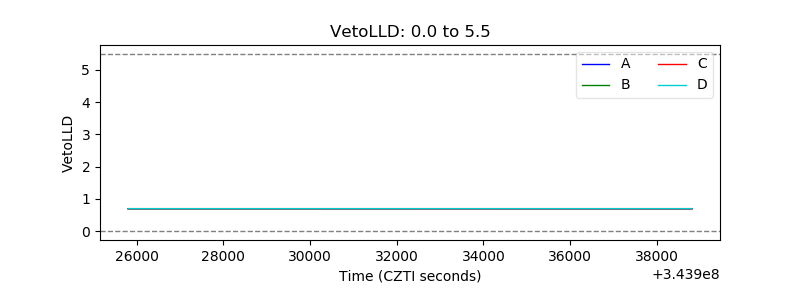 |
| Alpha Counter | 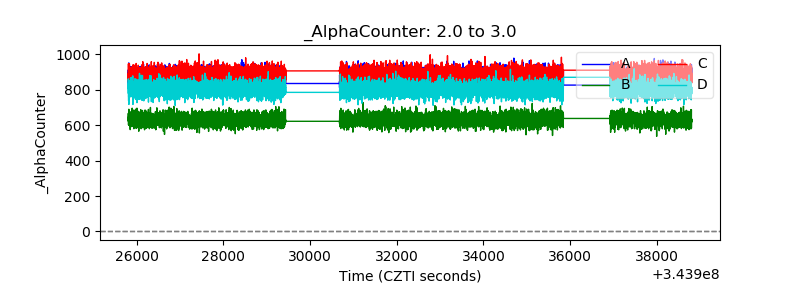 |
| _CPM_Rate | 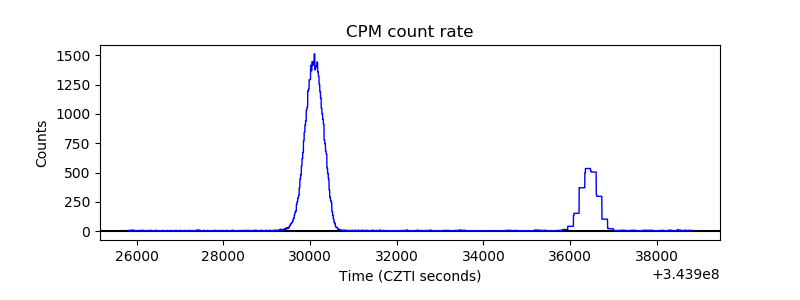 |
| CZT Counter | 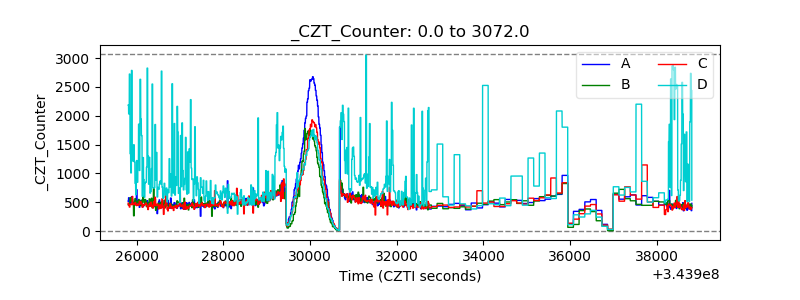 |
| +2.5 Volts monitor |  |
| +5 Volts monitor | 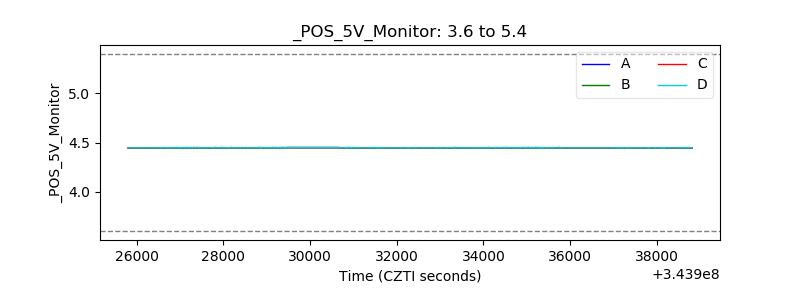 |
| _ROLL_ROT | 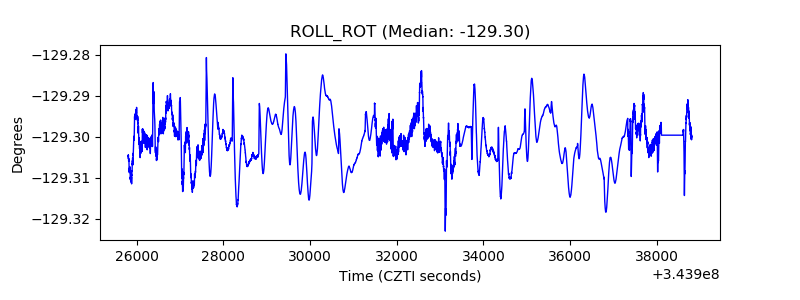 |
| _Roll_DEC | 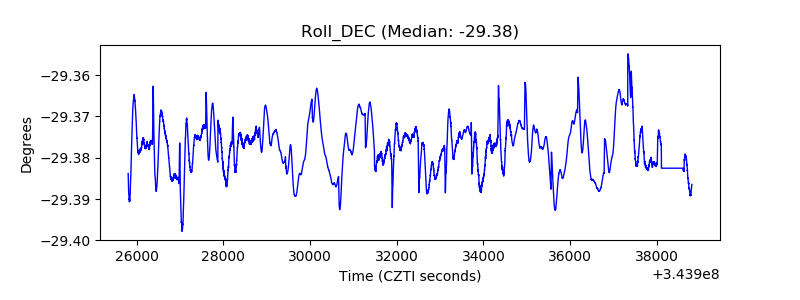 |
| _Roll_RA | 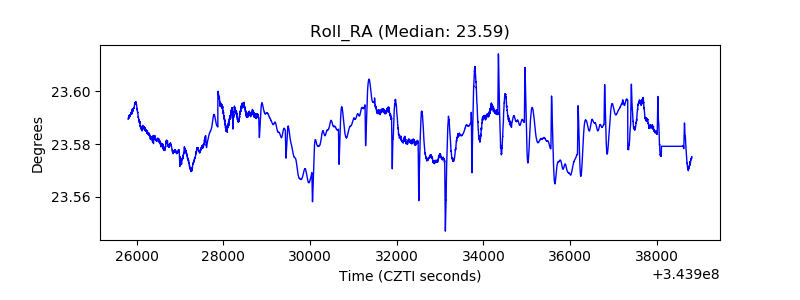 |
| Veto Counter | 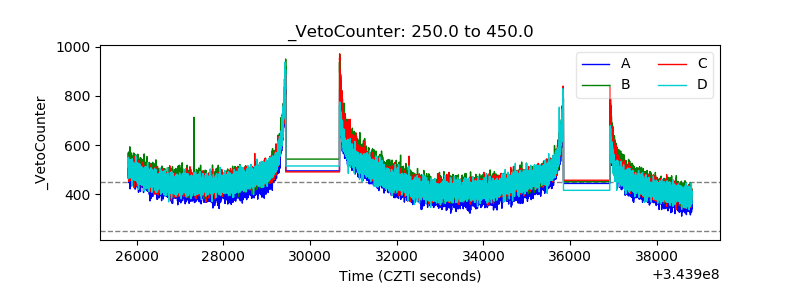 |