| Param | Original file | Final file |
|---|---|---|
| Filename | modeM0/AS1A10_048T01_9000004028_27896cztM0_level2.evt | modeM0/AS1A10_048T01_9000004028_27896cztM0_level2_quad_clean.evt |
| Size (bytes) | 515,013,120 | 87,744,960 |
| Size | 491.2 MB | 83.7 MB |
| Events in quadrant A | 3,083,936 | 578,313 |
| Events in quadrant B | 3,181,250 | 583,898 |
| Events in quadrant C | 3,308,182 | 539,566 |
| Events in quadrant D | 5,594,267 | 513,189 |
| Mode M0 | |||
|---|---|---|---|
| Quadrant | BADHDUFLAG | Total packets | Discarded packets |
| A | 0 | 13217 | 0 |
| B | 0 | 13490 | 0 |
| C | 0 | 13853 | 0 |
| D | 0 | 21055 | 0 |
| Mode M9 | |||
|---|---|---|---|
| Quadrant | BADHDUFLAG | Total packets | Discarded packets |
| A | 0 | 8 | 0 |
| B | 0 | 9 | 0 |
| C | 0 | 9 | 0 |
| D | 0 | 9 | 0 |
| Quadrant | Total seconds | Saturated seconds | Saturation percentage |
|---|---|---|---|
| A | 6337 | 49 | 0.773237% |
| B | 6337 | 43 | 0.678555% |
| C | 6337 | 87 | 1.372889% |
| D | 6337 | 499 | 7.874389% |
Noise dominated data is calculated using 1-second bins in cleaned event files. If a bin has >2000 counts, and if more than 50% of those come from <1% of pixels, then it is considered to be noise-dominated and hence unusable.
| Quadrant | # 1 sec bins | Bins with >0 counts | Bins with >2000 counts | High rate bins dominated by noise | Noise dominated (total time) | Noise dominated (detector-on time) | Marked lightcurve |
|---|---|---|---|---|---|---|---|
| A | 7022 | 6338 | 1 | 1 | 0.01% | 0.02% | 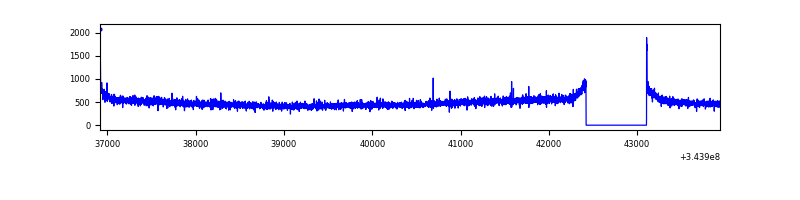 |
| B | 7022 | 6338 | 0 | 0 | 0.00% | 0.00% | 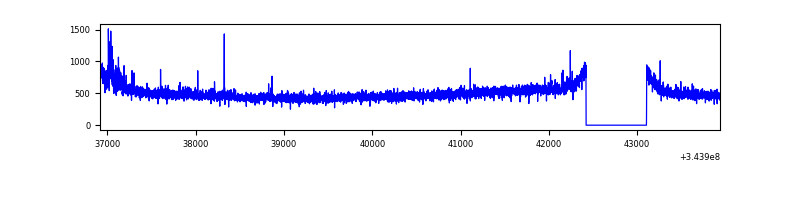 |
| C | 7022 | 6338 | 7 | 7 | 0.10% | 0.11% | 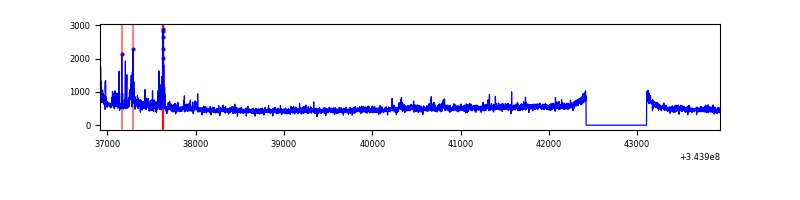 |
| D | 7022 | 6337 | 417 | 417 | 5.94% | 6.58% | 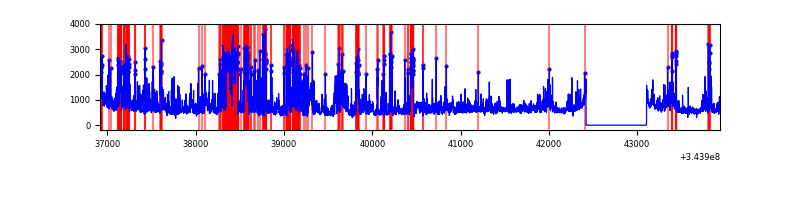 |
Top three noisy pixels from each quadrant. If the there are fewer than three noisy pixels in the level2.evt file, extra rows are filled as -1
| Pixel properties | Quadrant properties | ||||||
|---|---|---|---|---|---|---|---|
| Quadrant | DetID | PixID | Counts | Sigma | Mean | Median | Sigma |
| A | 13 | 254 | 11393 | 65.7 | 797 | 783 | 161.5 |
| A | 8 | 192 | 10478 | 60.04 | 797 | 783 | 161.5 |
| A | 3 | 137 | 7807 | 43.5 | 797 | 783 | 161.5 |
| B | 0 | 230 | 47844 | 307.87 | 793 | 773 | 152.9 |
| B | 12 | 111 | 19022 | 119.36 | 793 | 773 | 152.9 |
| B | 11 | 111 | 16748 | 104.48 | 793 | 773 | 152.9 |
| C | 3 | 233 | 134561 | 754.56 | 750 | 754 | 177.3 |
| C | 2 | 16 | 130335 | 730.73 | 750 | 754 | 177.3 |
| C | 14 | 238 | 121838 | 682.82 | 750 | 754 | 177.3 |
| D | 1 | 52 | 1623105 | 9059.51 | 740 | 720 | 179.1 |
| D | 13 | 104 | 678236 | 3783.3 | 740 | 720 | 179.1 |
| D | 7 | 238 | 227665 | 1267.28 | 740 | 720 | 179.1 |
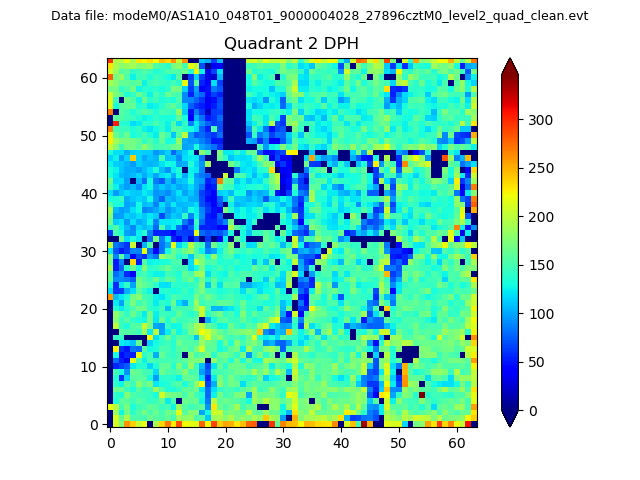
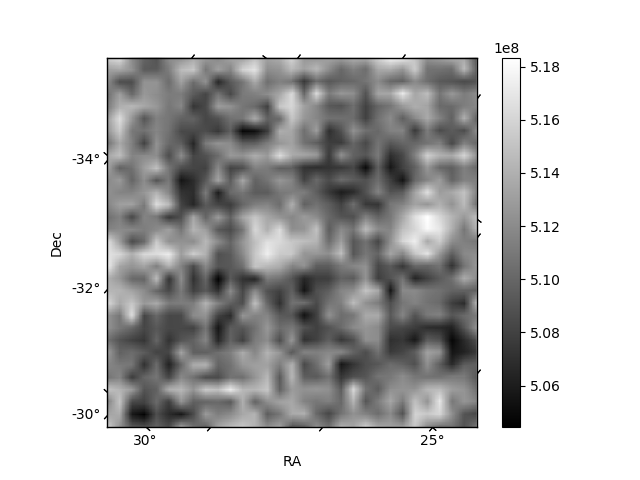
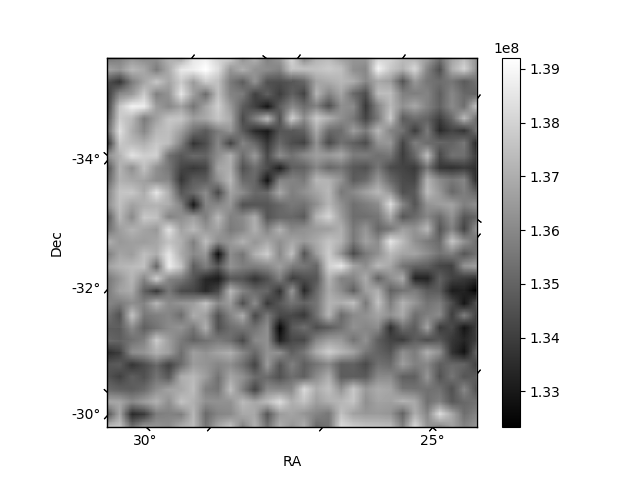
Histogram calculated using DETX and DETY for each event in the final _common_clean file
| Quadrant A | 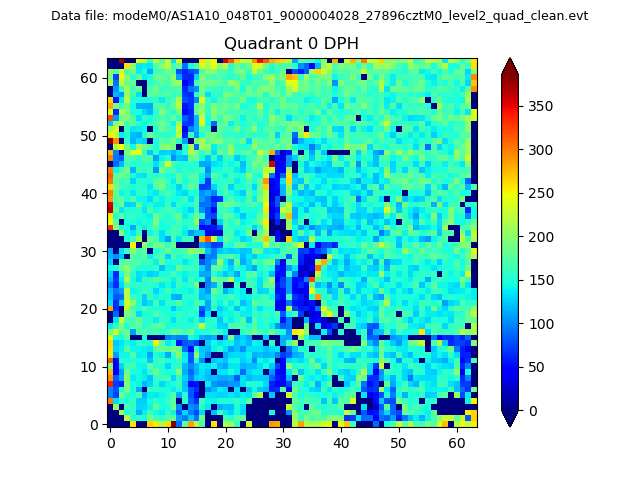 |
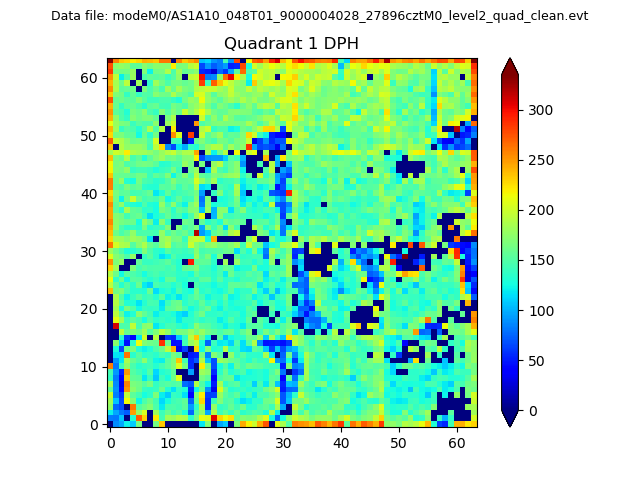 |
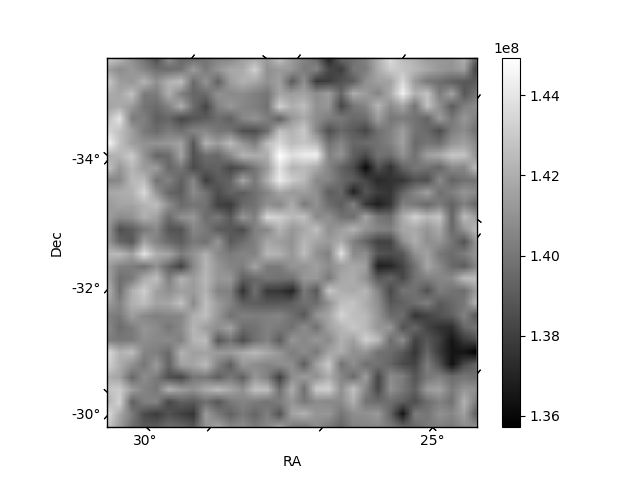
Quadrant B |
|---|---|---|---|
| Quadrant D | 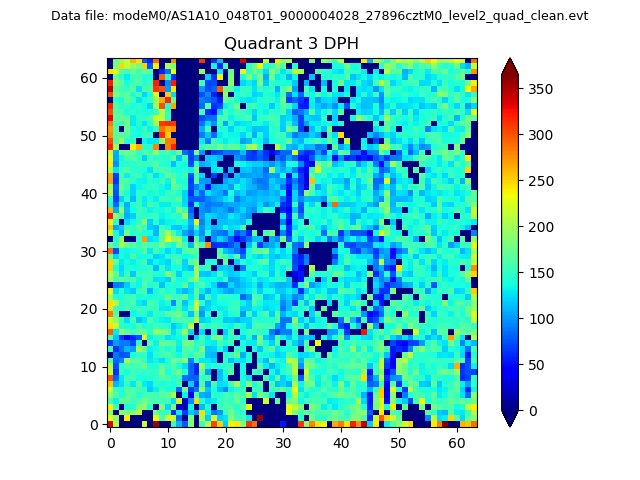 |
 |
Quadrant C |
| Plot type | Count rate plots | Images |
|---|---|---|
| Comparison with Poisson distribution Blue bars denote a histogram of data divided into 1 sec bins. Red curve is a Poisson curve with rate = median count rate of data. |
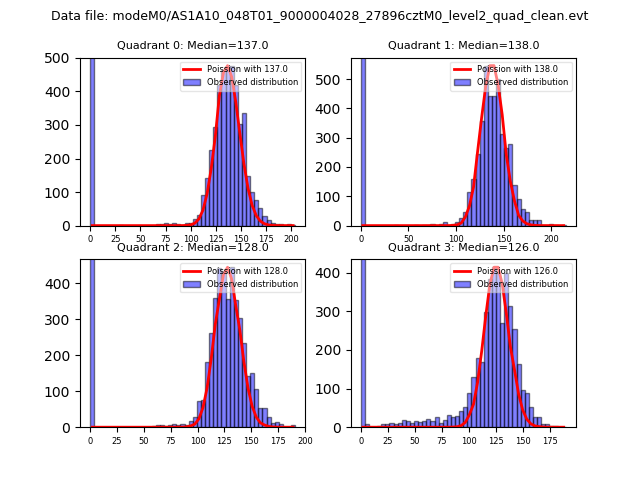 |
 |
| Quadrant-wise count rates Data is divided into 100 sec bins |
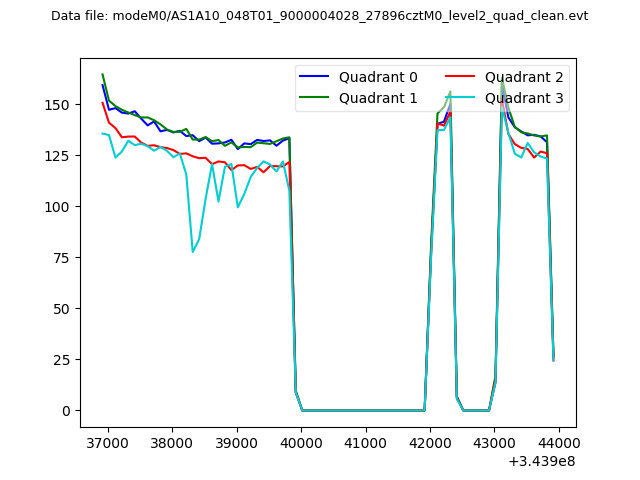 |
|
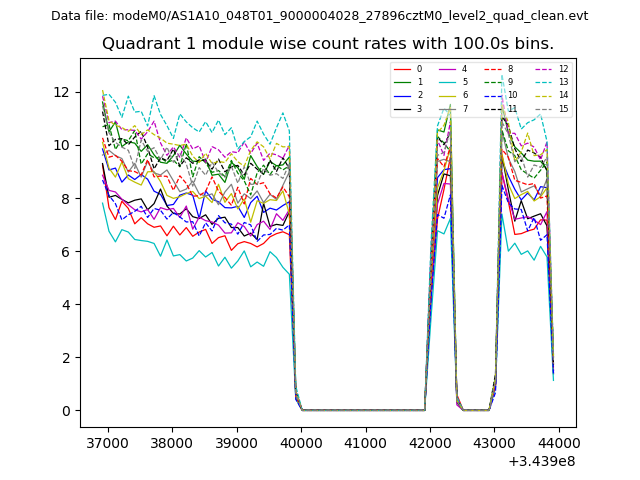
| Module-wise count rates for Quadrant A Data is divided into 100 sec bins |
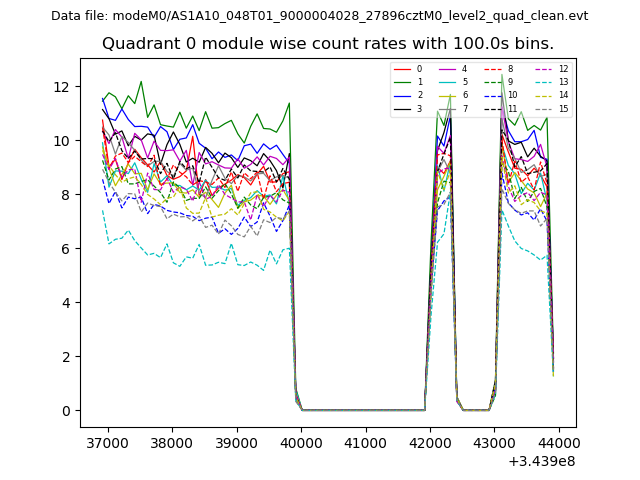 |
 |
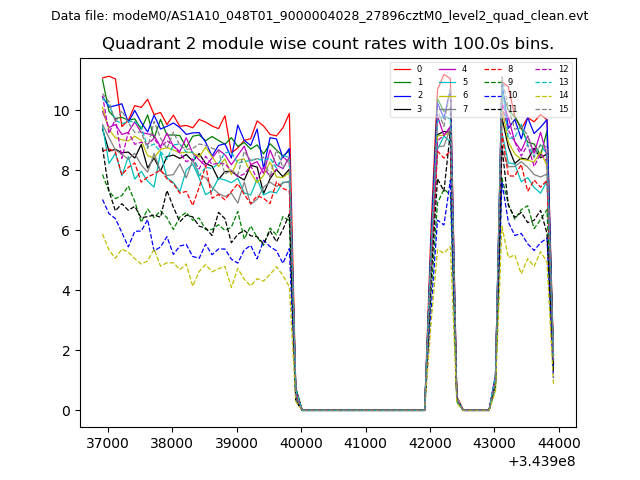
| Module-wise count rates for Quadrant B Data is divided into 100 sec bins |
 |
 |
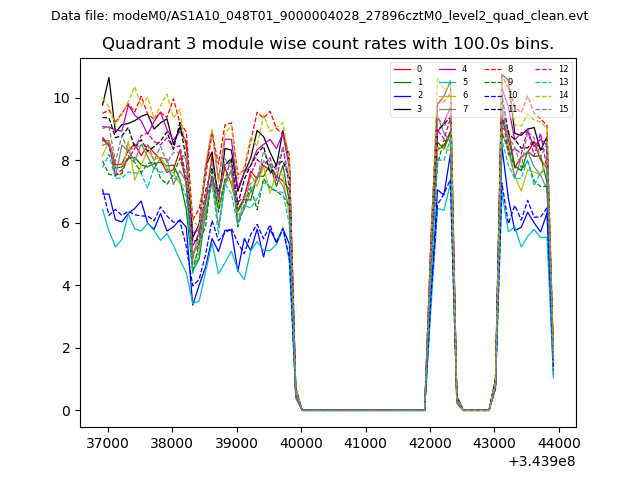
| Module-wise count rates for Quadrant C Data is divided into 100 sec bins |
 |
 |
| Module-wise count rates for Quadrant D Data is divided into 100 sec bins |
 |
 |
| Parameter | Plot |
|---|---|
| CZT HV Monitor | 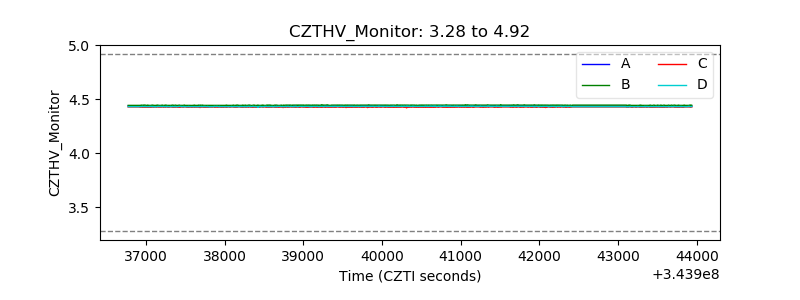 |
| D_VDD | 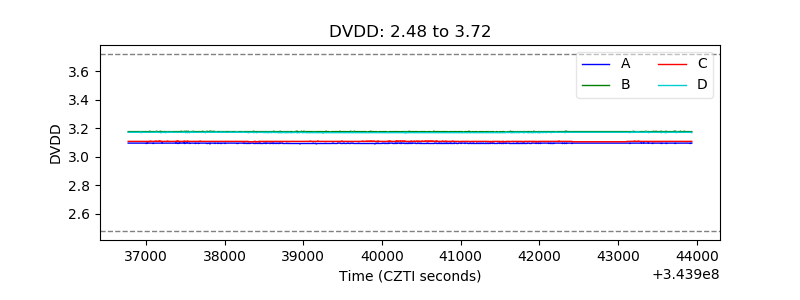 |
| Temperature 1 | 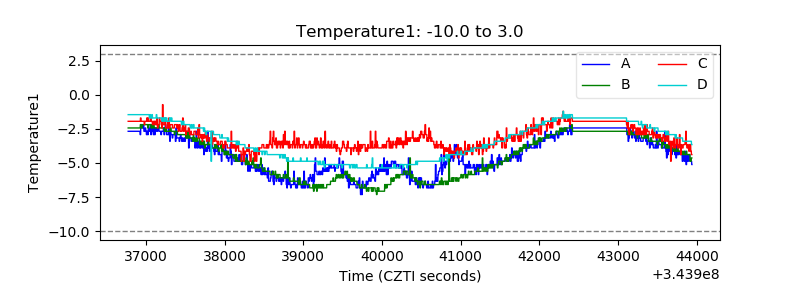 |
| Veto HV Monitor | 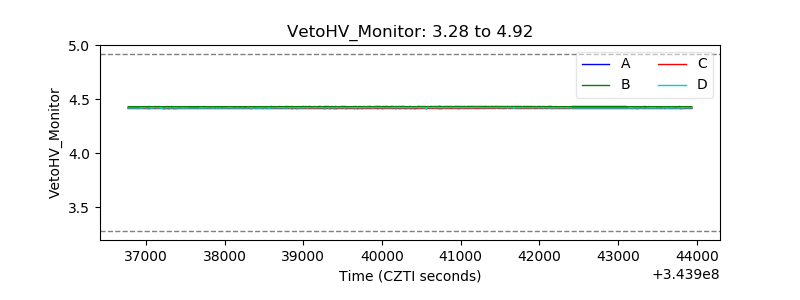 |
| Veto LLD | 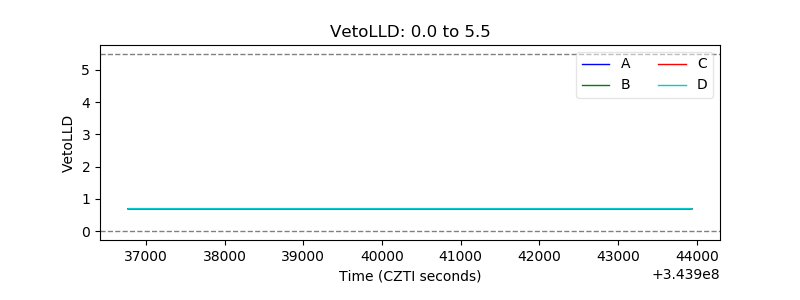 |
| Alpha Counter | 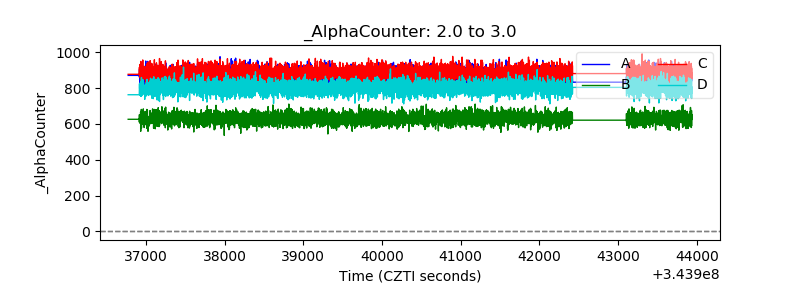 |
| _CPM_Rate | 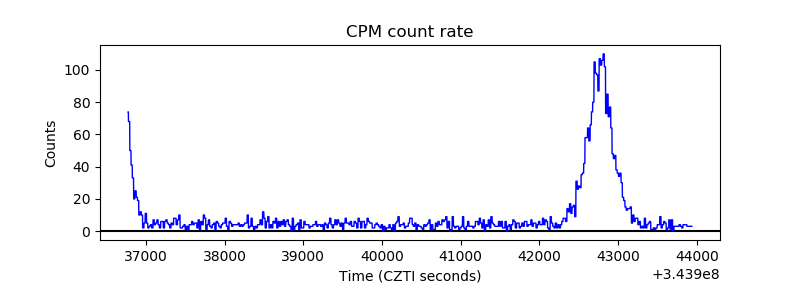 |
| CZT Counter | 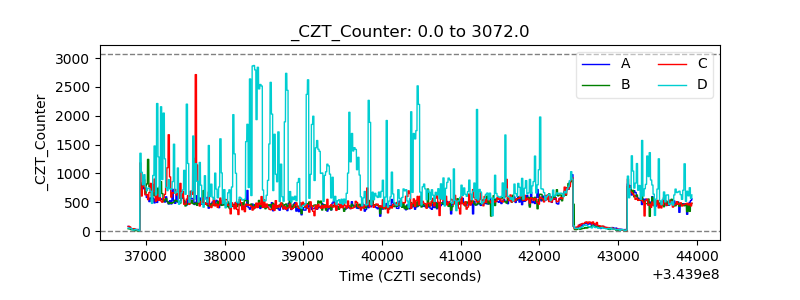 |
| +2.5 Volts monitor |  |
| +5 Volts monitor |  |
| _ROLL_ROT | 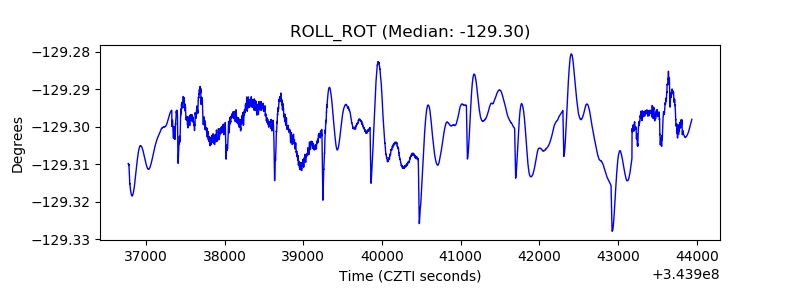 |
| _Roll_DEC | 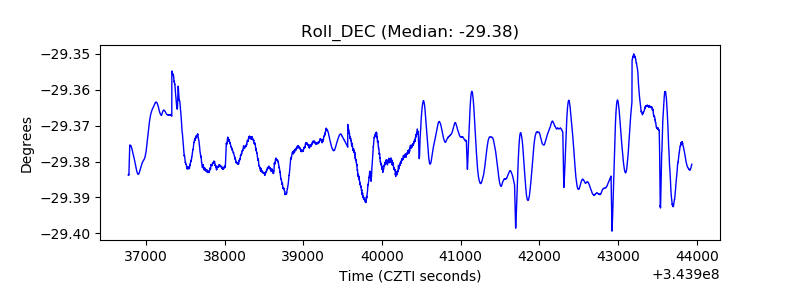 |
| _Roll_RA | 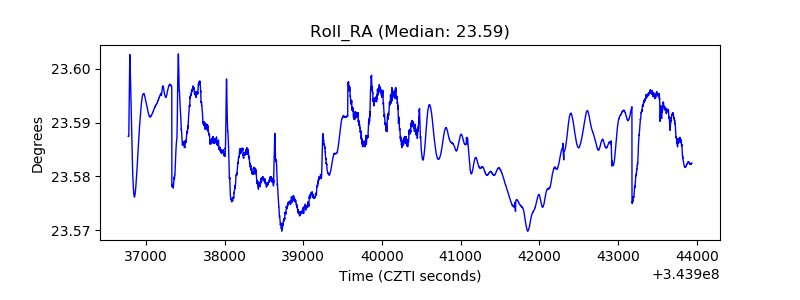 |
| Veto Counter | 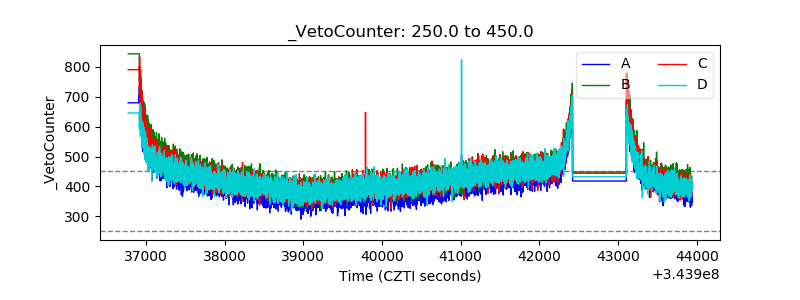 |