| Param | Original file | Final file |
|---|---|---|
| Filename | modeM0/AS1A10_048T01_9000004028_27897cztM0_level2.evt | modeM0/AS1A10_048T01_9000004028_27897cztM0_level2_quad_clean.evt |
| Size (bytes) | 66,625,920 | 17,017,920 |
| Size | 63.5 MB | 16.2 MB |
| Events in quadrant A | 435,318 | 115,376 |
| Events in quadrant B | 435,764 | 117,182 |
| Events in quadrant C | 428,040 | 109,089 |
| Events in quadrant D | 658,968 | 107,799 |
| Mode M0 | |||
|---|---|---|---|
| Quadrant | BADHDUFLAG | Total packets | Discarded packets |
| A | 0 | 1807 | 0 |
| B | 0 | 1802 | 0 |
| C | 0 | 1782 | 0 |
| D | 0 | 2542 | 0 |
| Mode M9 | |||
|---|---|---|---|
| Quadrant | BADHDUFLAG | Total packets | Discarded packets |
| A | 0 | 1 | 0 |
| B | 0 | 2 | 0 |
| C | 0 | 2 | 0 |
| D | 0 | 2 | 0 |
| Quadrant | Total seconds | Saturated seconds | Saturation percentage |
|---|---|---|---|
| A | 832 | 13 | 1.562500% |
| B | 832 | 12 | 1.442308% |
| C | 832 | 13 | 1.562500% |
| D | 832 | 28 | 3.365385% |
Noise dominated data is calculated using 1-second bins in cleaned event files. If a bin has >2000 counts, and if more than 50% of those come from <1% of pixels, then it is considered to be noise-dominated and hence unusable.
| Quadrant | # 1 sec bins | Bins with >0 counts | Bins with >2000 counts | High rate bins dominated by noise | Noise dominated (total time) | Noise dominated (detector-on time) | Marked lightcurve |
|---|---|---|---|---|---|---|---|
| A | 832 | 832 | 0 | 0 | 0.00% | 0.00% | 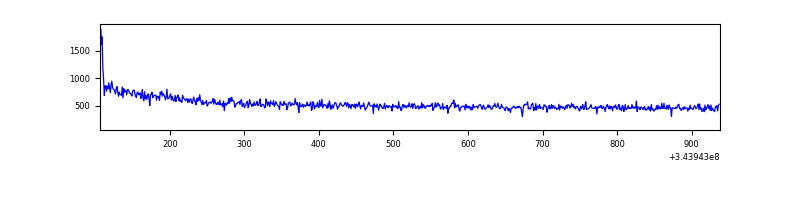 |
| B | 832 | 832 | 0 | 0 | 0.00% | 0.00% | 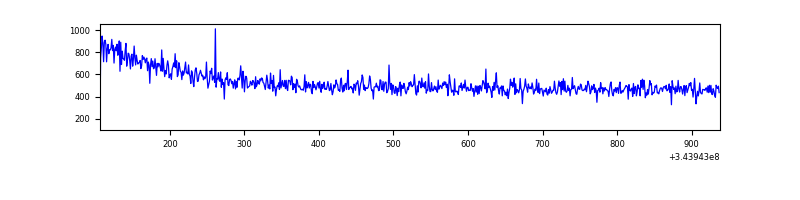 |
| C | 832 | 832 | 0 | 0 | 0.00% | 0.00% | 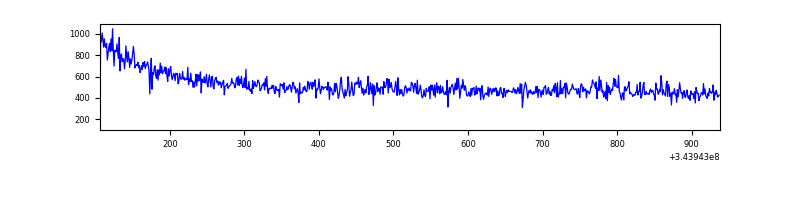 |
| D | 832 | 832 | 17 | 17 | 2.04% | 2.04% | 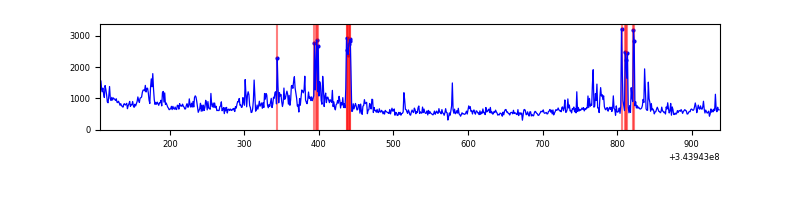 |
Top three noisy pixels from each quadrant. If the there are fewer than three noisy pixels in the level2.evt file, extra rows are filled as -1
| Pixel properties | Quadrant properties | ||||||
|---|---|---|---|---|---|---|---|
| Quadrant | DetID | PixID | Counts | Sigma | Mean | Median | Sigma |
| A | 8 | 192 | 4590 | 182.39 | 111 | 108 | 24.6 |
| A | 13 | 254 | 1430 | 53.8 | 111 | 108 | 24.6 |
| A | 3 | 137 | 1147 | 42.28 | 111 | 108 | 24.6 |
| B | 12 | 111 | 2708 | 109.83 | 110 | 108 | 23.7 |
| B | 11 | 111 | 2322 | 93.53 | 110 | 108 | 23.7 |
| B | 14 | 111 | 2113 | 84.7 | 110 | 108 | 23.7 |
| C | 14 | 238 | 17188 | 657.7 | 102 | 102 | 26.0 |
| C | 3 | 233 | 10075 | 383.89 | 102 | 102 | 26.0 |
| C | 2 | 16 | 1557 | 56.01 | 102 | 102 | 26.0 |
| D | 13 | 104 | 82166 | 3024.68 | 103 | 99 | 27.1 |
| D | 2 | 250 | 70068 | 2578.8 | 103 | 99 | 27.1 |
| D | 1 | 52 | 58341 | 2146.58 | 103 | 99 | 27.1 |
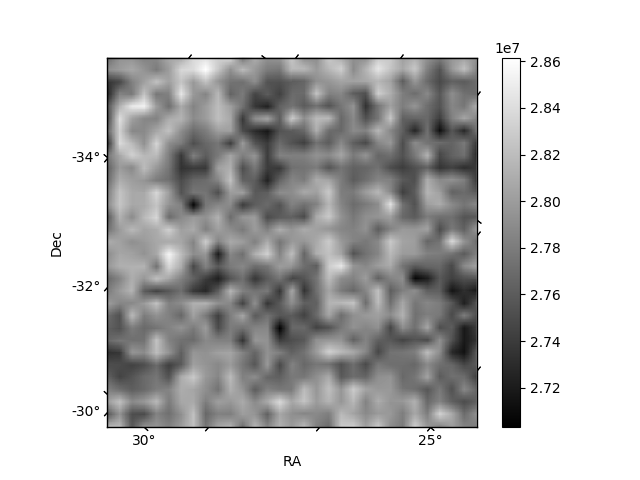
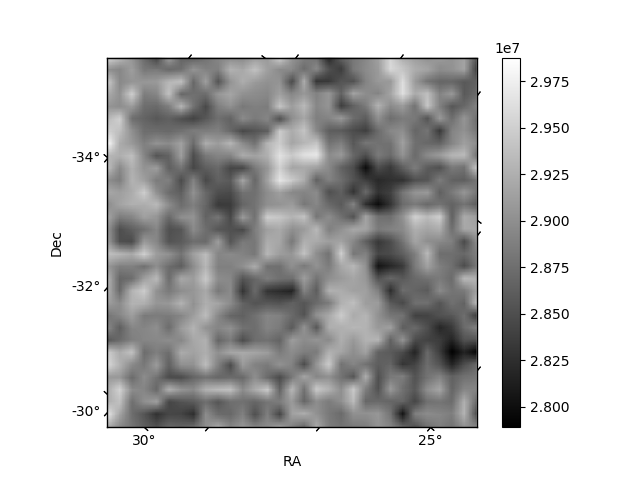
Histogram calculated using DETX and DETY for each event in the final _common_clean file
| Quadrant A |  |
 |
Quadrant B |
|---|---|---|---|
| Quadrant D |  |
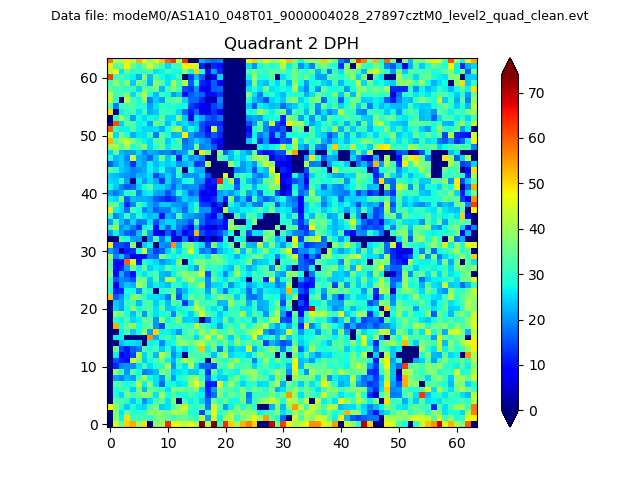 |
Quadrant C |
| Plot type | Count rate plots | Images |
|---|---|---|
| Comparison with Poisson distribution Blue bars denote a histogram of data divided into 1 sec bins. Red curve is a Poisson curve with rate = median count rate of data. |
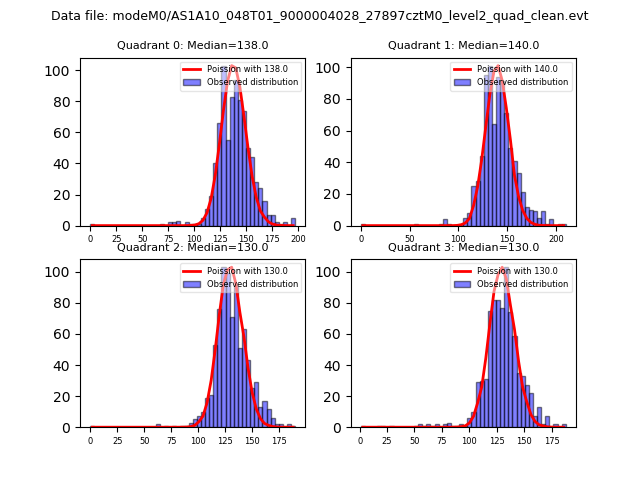 |
 |
| Quadrant-wise count rates Data is divided into 100 sec bins |
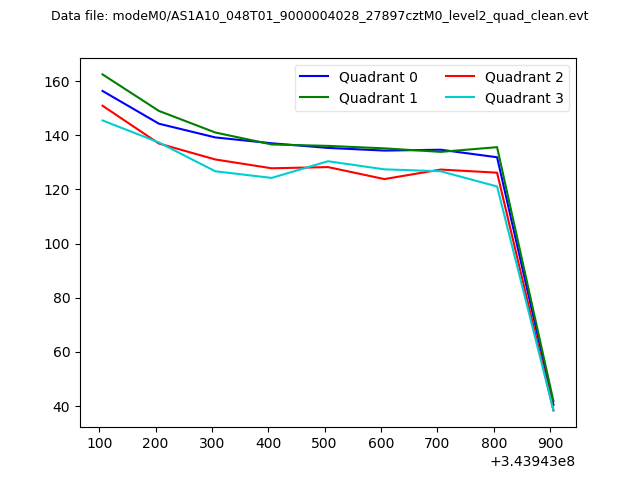 |
|
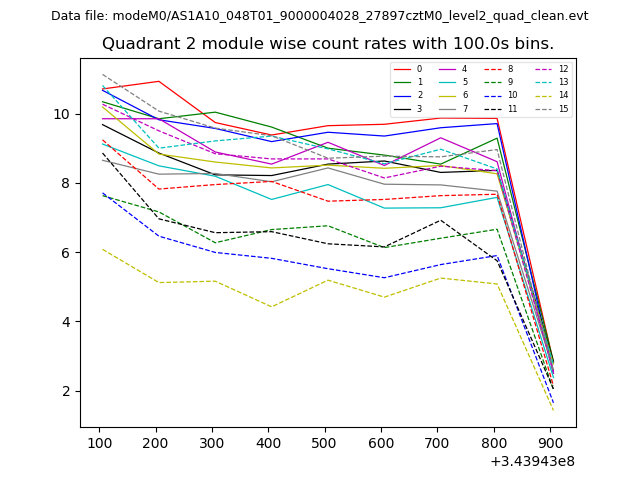
| Module-wise count rates for Quadrant A Data is divided into 100 sec bins |
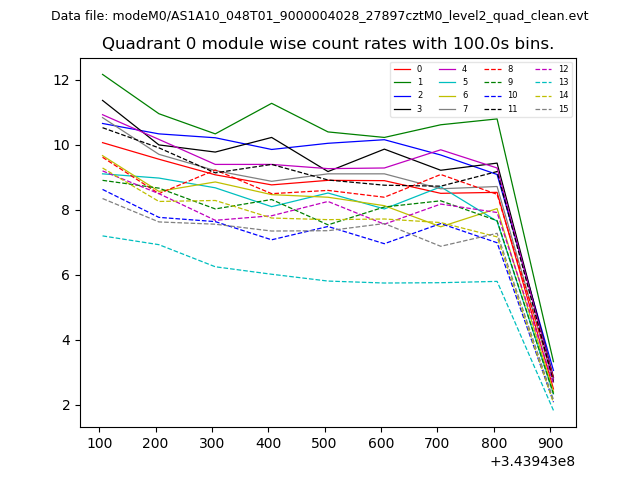 |
 |
| Module-wise count rates for Quadrant B Data is divided into 100 sec bins |
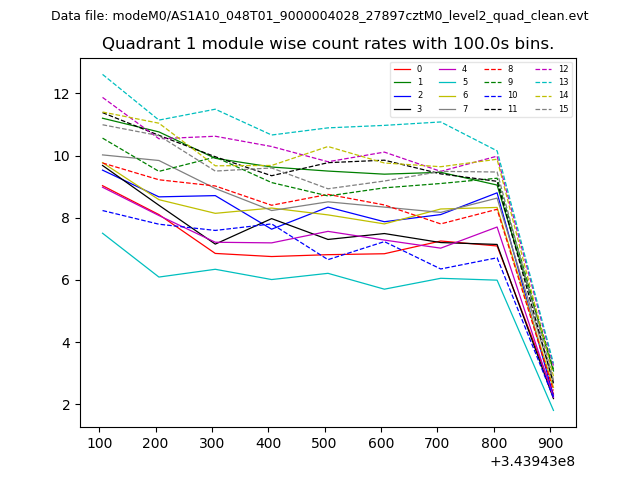 |
 |
| Module-wise count rates for Quadrant C Data is divided into 100 sec bins |
 |
 |
| Module-wise count rates for Quadrant D Data is divided into 100 sec bins |
 |
 |
| Parameter | Plot |
|---|---|
| CZT HV Monitor | 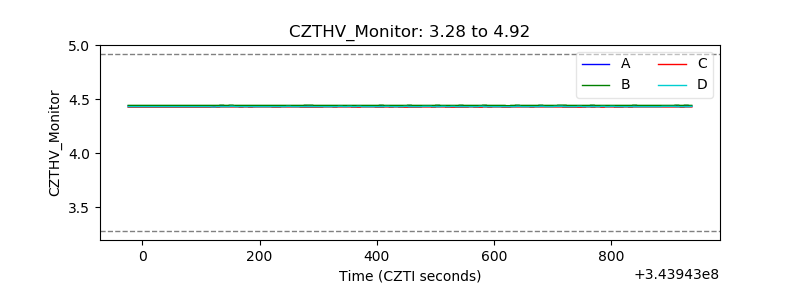 |
| D_VDD | 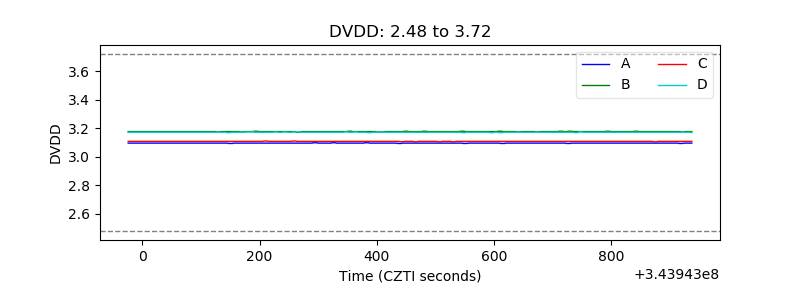 |
| Temperature 1 | 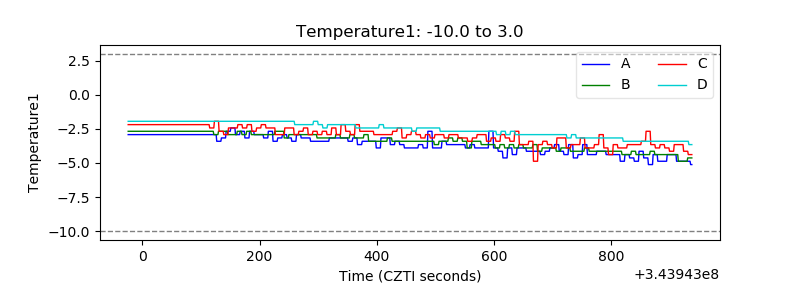 |
| Veto HV Monitor | 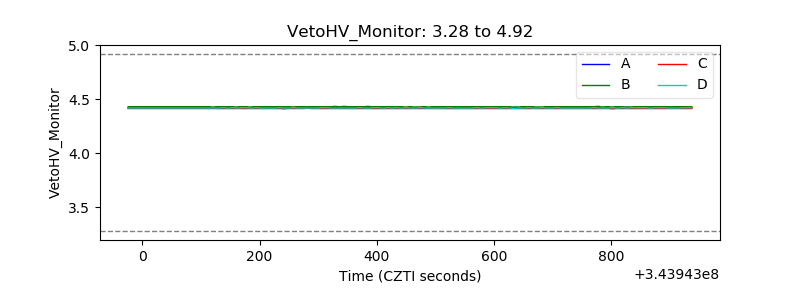 |
| Veto LLD |  |
| Alpha Counter | 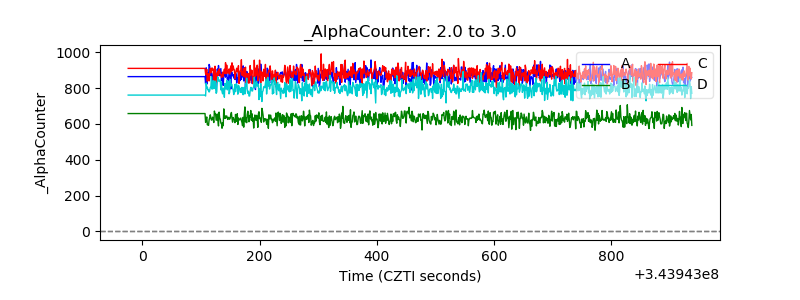 |
| _CPM_Rate | 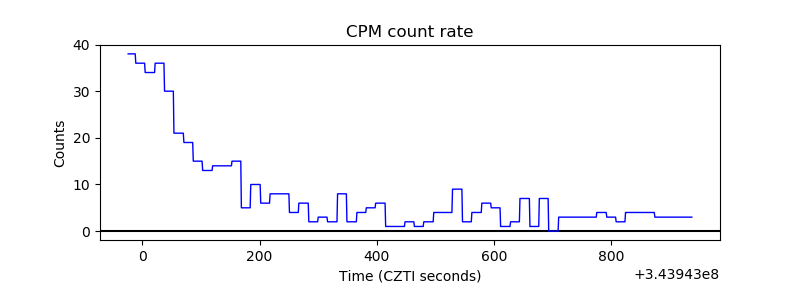 |
| CZT Counter | 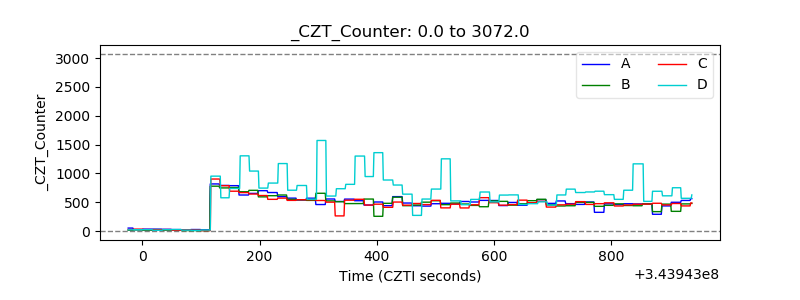 |
| +2.5 Volts monitor | 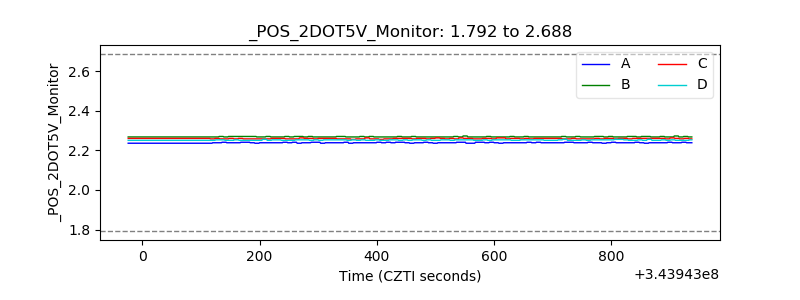 |
| +5 Volts monitor |  |
| _ROLL_ROT | 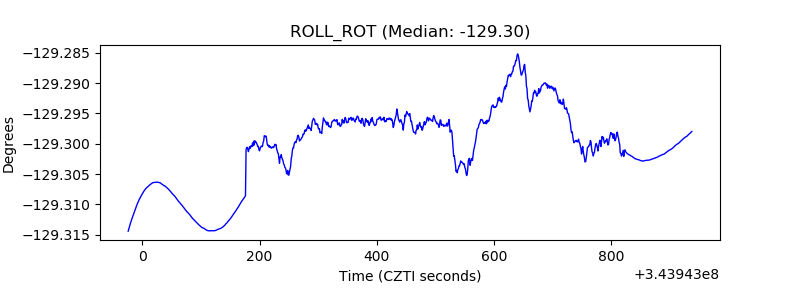 |
| _Roll_DEC | 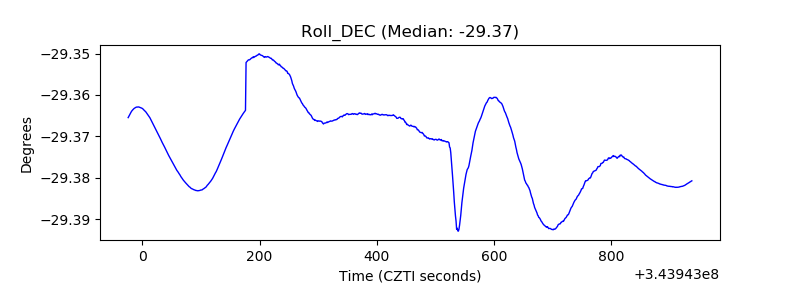 |
| _Roll_RA | 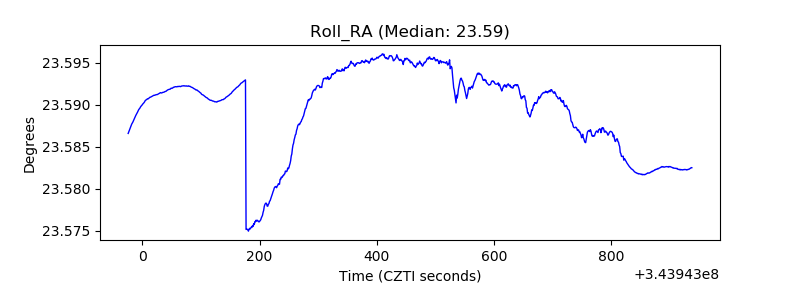 |
| Veto Counter | 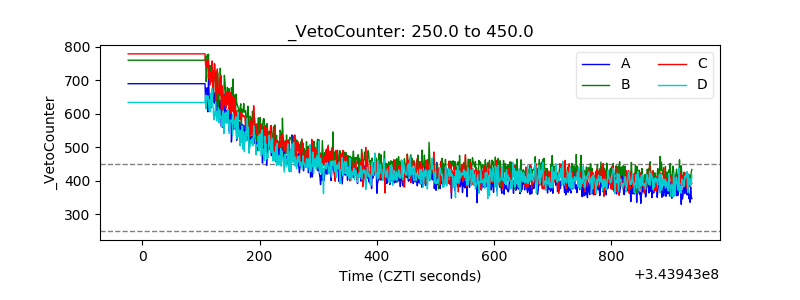 |