| Param | Original file | Final file |
|---|---|---|
| Filename | modeM0/AS1A10_048T06_9000004030_27897cztM0_level2.evt | modeM0/AS1A10_048T06_9000004030_27897cztM0_level2_quad_clean.evt |
| Size (bytes) | 570,055,680 | 82,851,840 |
| Size | 543.6 MB | 79.0 MB |
| Events in quadrant A | 2,971,341 | 553,775 |
| Events in quadrant B | 3,176,354 | 557,314 |
| Events in quadrant C | 3,066,454 | 525,537 |
| Events in quadrant D | 7,620,518 | 429,919 |
| Mode M0 | |||
|---|---|---|---|
| Quadrant | BADHDUFLAG | Total packets | Discarded packets |
| A | 0 | 13024 | 0 |
| B | 0 | 13593 | 0 |
| C | 0 | 13121 | 0 |
| D | 0 | 27140 | 0 |
| Mode M9 | |||
|---|---|---|---|
| Quadrant | BADHDUFLAG | Total packets | Discarded packets |
| A | 0 | 3 | 0 |
| B | 0 | 3 | 0 |
| C | 0 | 3 | 0 |
| D | 0 | 3 | 0 |
| Quadrant | Total seconds | Saturated seconds | Saturation percentage |
|---|---|---|---|
| A | 6334 | 37 | 0.584149% |
| B | 6334 | 87 | 1.373540% |
| C | 6333 | 104 | 1.642192% |
| D | 6333 | 1590 | 25.106585% |
Noise dominated data is calculated using 1-second bins in cleaned event files. If a bin has >2000 counts, and if more than 50% of those come from <1% of pixels, then it is considered to be noise-dominated and hence unusable.
| Quadrant | # 1 sec bins | Bins with >0 counts | Bins with >2000 counts | High rate bins dominated by noise | Noise dominated (total time) | Noise dominated (detector-on time) | Marked lightcurve |
|---|---|---|---|---|---|---|---|
| A | 6579 | 6334 | 1 | 1 | 0.02% | 0.02% | 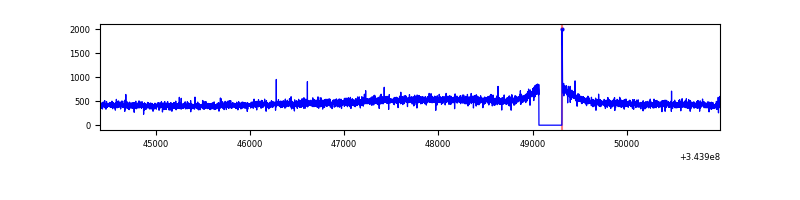 |
| B | 6579 | 6334 | 6 | 6 | 0.09% | 0.09% | 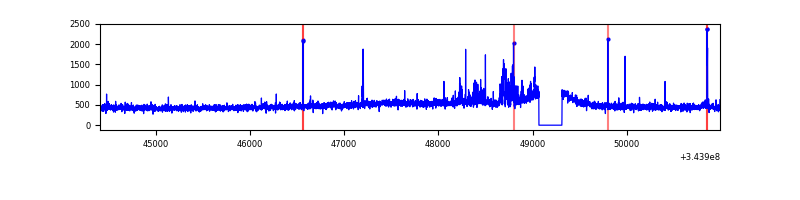 |
| C | 6578 | 6334 | 0 | 0 | 0.00% | 0.00% | 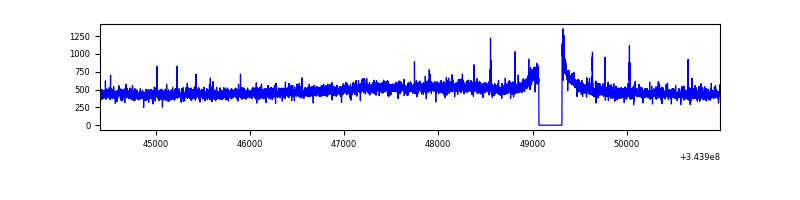 |
| D | 6578 | 6333 | 1287 | 1287 | 19.57% | 20.32% | 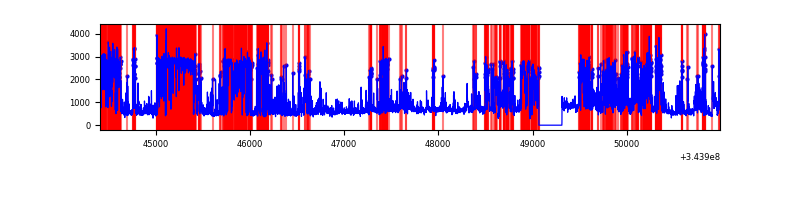 |
Top three noisy pixels from each quadrant. If the there are fewer than three noisy pixels in the level2.evt file, extra rows are filled as -1
| Pixel properties | Quadrant properties | ||||||
|---|---|---|---|---|---|---|---|
| Quadrant | DetID | PixID | Counts | Sigma | Mean | Median | Sigma |
| A | 13 | 254 | 10811 | 64.83 | 767 | 751 | 155.2 |
| A | 3 | 137 | 7551 | 43.82 | 767 | 751 | 155.2 |
| A | 8 | 192 | 6900 | 39.63 | 767 | 751 | 155.2 |
| B | 0 | 230 | 90056 | 606.15 | 766 | 746 | 147.3 |
| B | 10 | 245 | 32221 | 213.62 | 766 | 746 | 147.3 |
| B | 12 | 111 | 18160 | 118.19 | 766 | 746 | 147.3 |
| C | 14 | 238 | 119802 | 686.9 | 731 | 734 | 173.3 |
| C | 3 | 233 | 78777 | 450.23 | 731 | 734 | 173.3 |
| C | 2 | 16 | 8346 | 43.91 | 731 | 734 | 173.3 |
| D | 1 | 52 | 3803766 | 24814.74 | 629 | 611 | 153.3 |
| D | 8 | 195 | 515637 | 3360.43 | 629 | 611 | 153.3 |
| D | 13 | 104 | 431062 | 2808.6 | 629 | 611 | 153.3 |
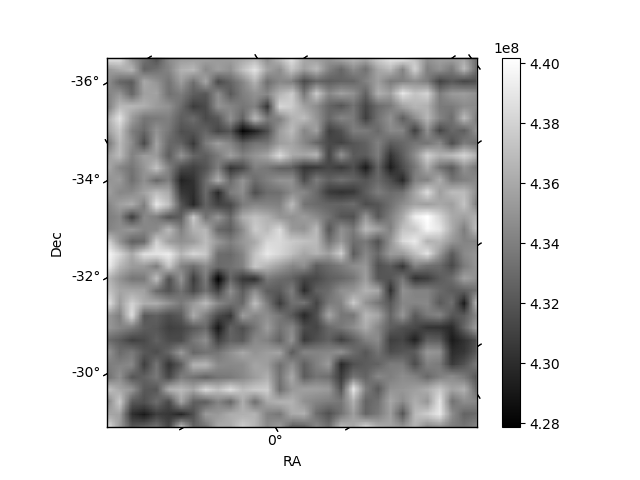
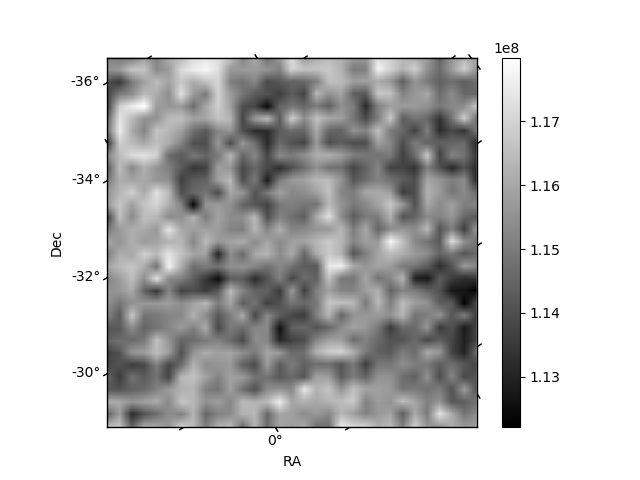
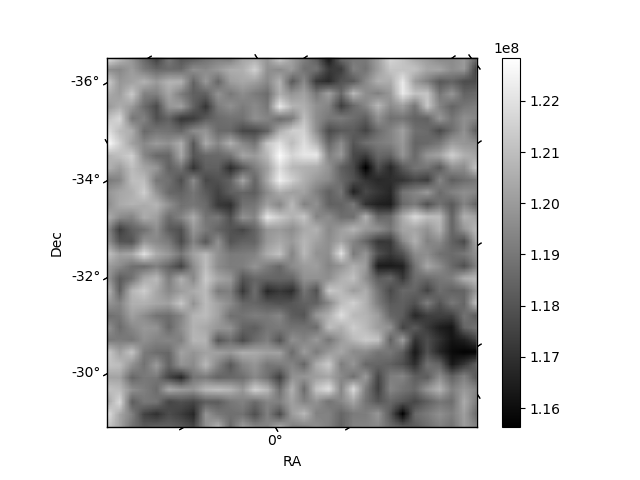
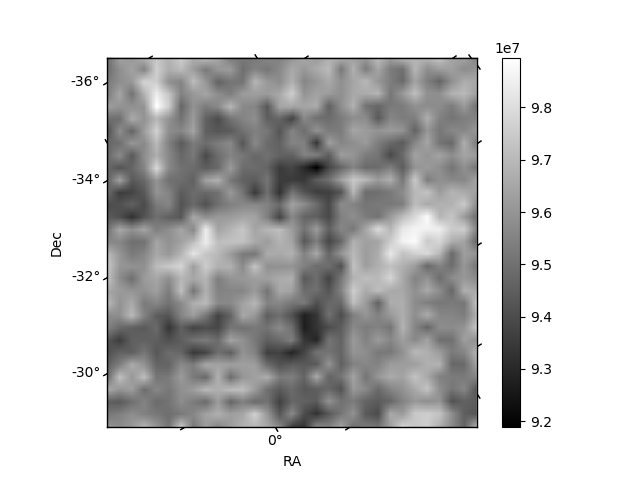
Histogram calculated using DETX and DETY for each event in the final _common_clean file
| Quadrant A | 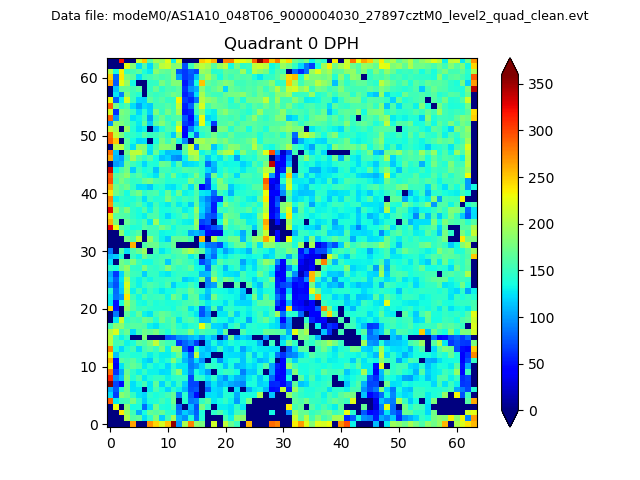 |
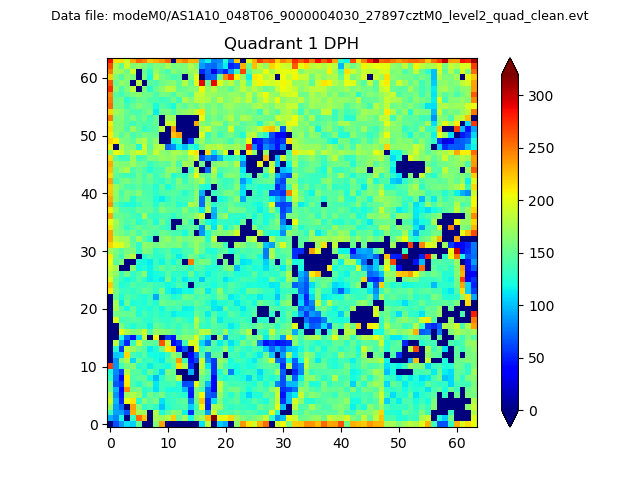 |
Quadrant B |
|---|---|---|---|
| Quadrant D |  |
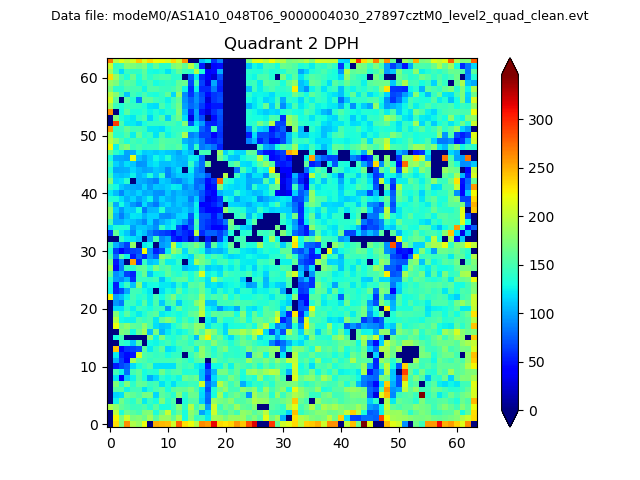 |
Quadrant C |
| Plot type | Count rate plots | Images |
|---|---|---|
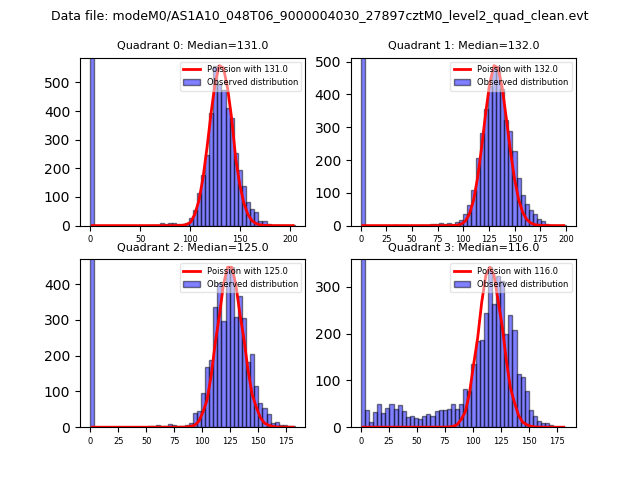
| Comparison with Poisson distribution Blue bars denote a histogram of data divided into 1 sec bins. Red curve is a Poisson curve with rate = median count rate of data. |
 |
 |
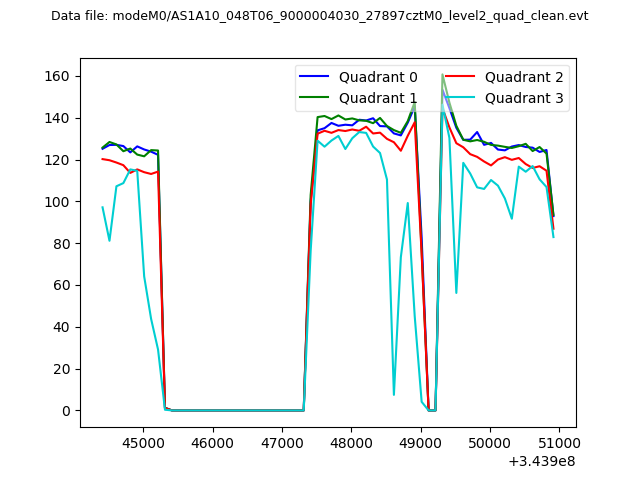
| Quadrant-wise count rates Data is divided into 100 sec bins |
 |
|
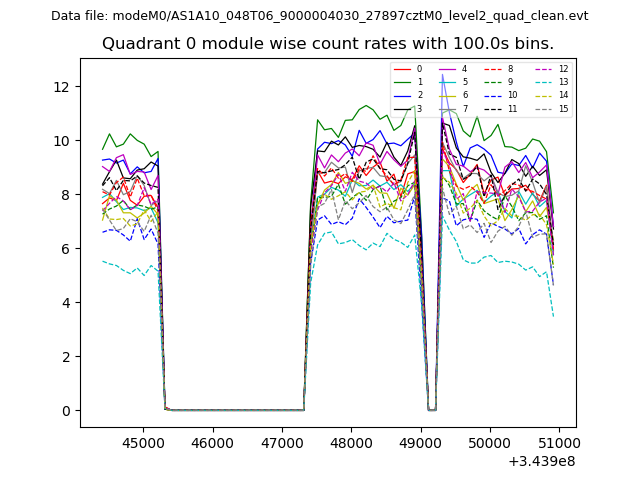
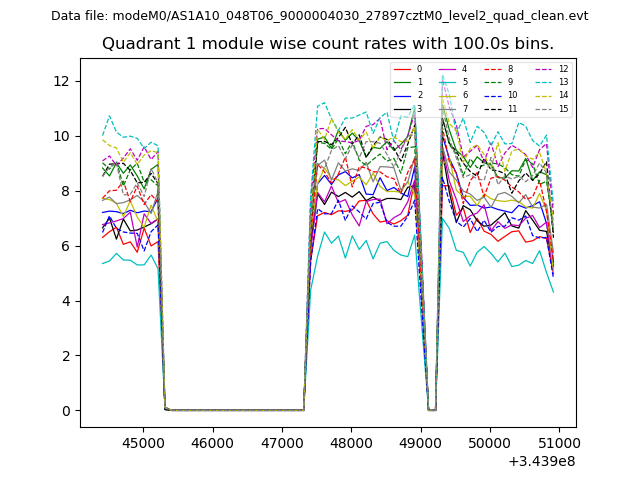
| Module-wise count rates for Quadrant A Data is divided into 100 sec bins |
 |
 |
| Module-wise count rates for Quadrant B Data is divided into 100 sec bins |
 |
 |
| Module-wise count rates for Quadrant C Data is divided into 100 sec bins |
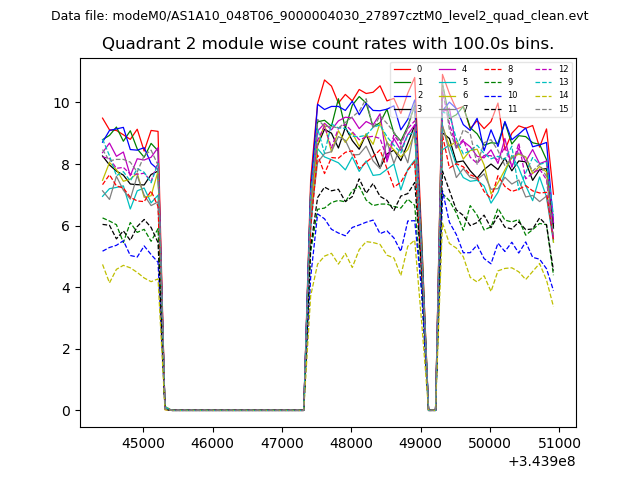 |
 |
| Module-wise count rates for Quadrant D Data is divided into 100 sec bins |
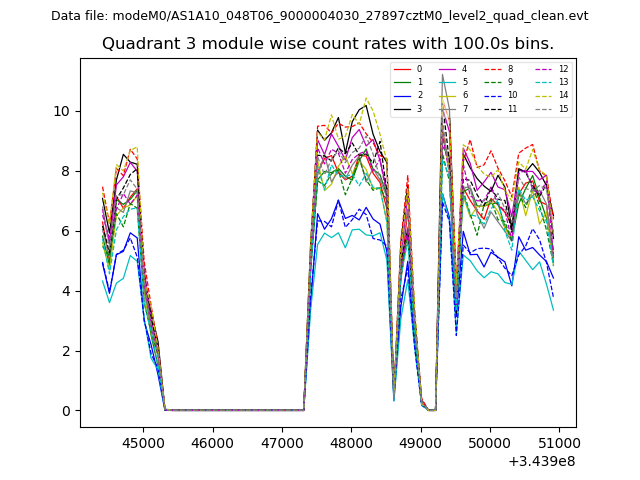 |
 |
| Parameter | Plot |
|---|---|
| CZT HV Monitor | 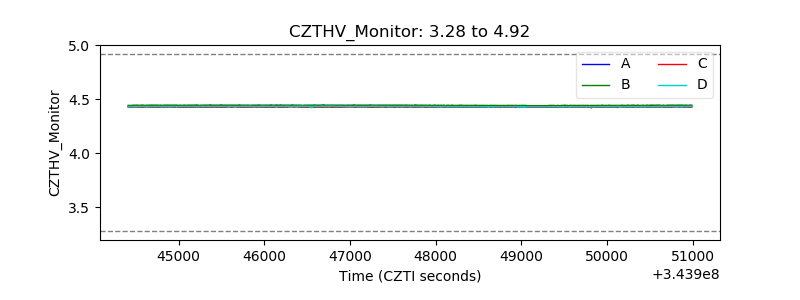 |
| D_VDD | 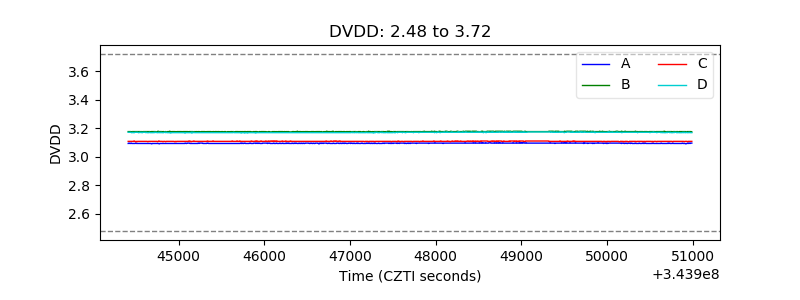 |
| Temperature 1 | 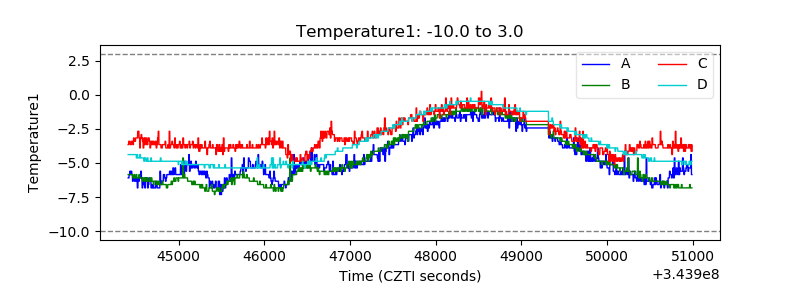 |
| Veto HV Monitor | 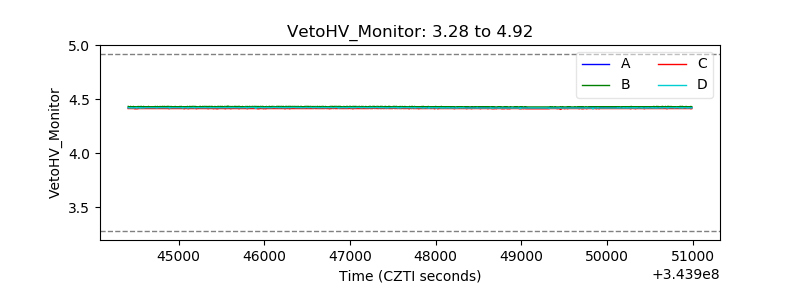 |
| Veto LLD | 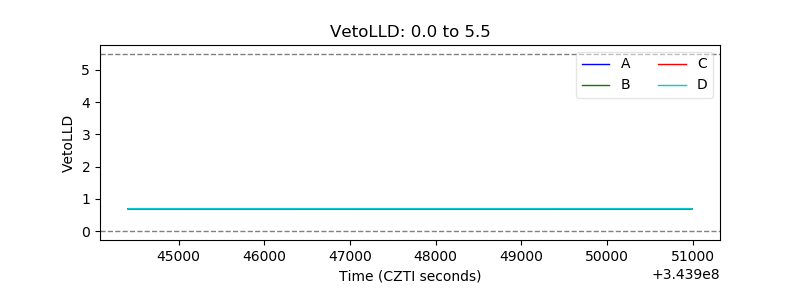 |
| Alpha Counter | 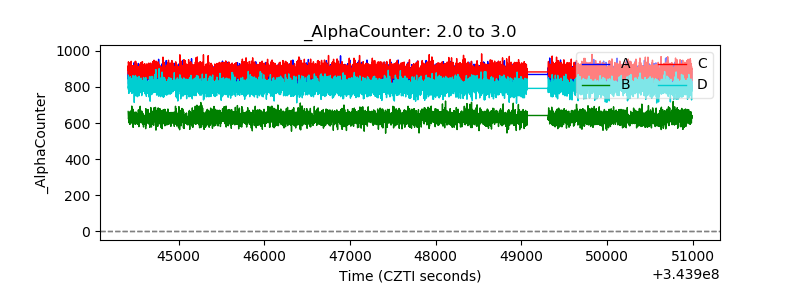 |
| _CPM_Rate | 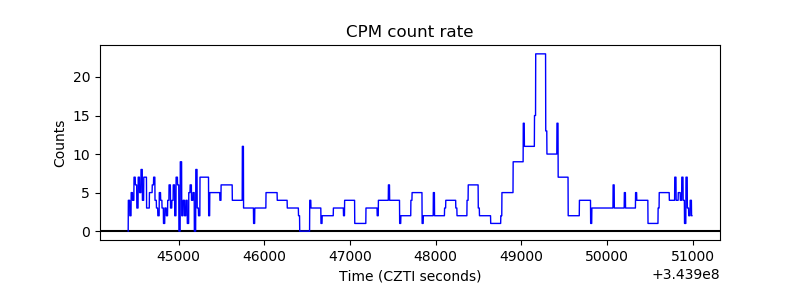 |
| CZT Counter | 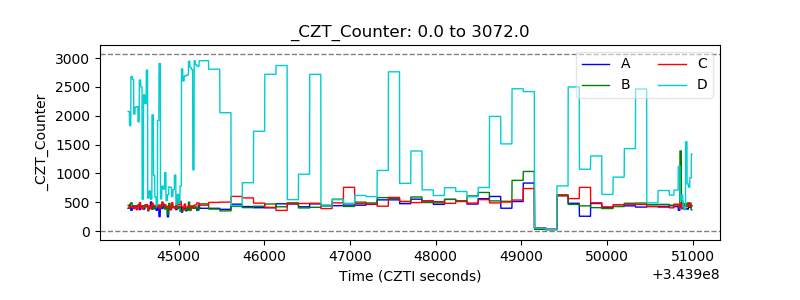 |
| +2.5 Volts monitor |  |
| +5 Volts monitor |  |
| _ROLL_ROT | 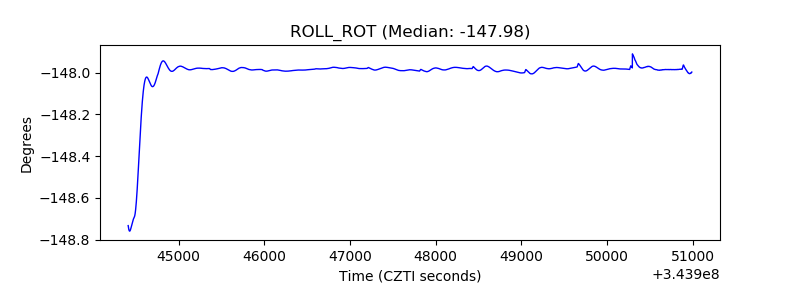 |
| _Roll_DEC | 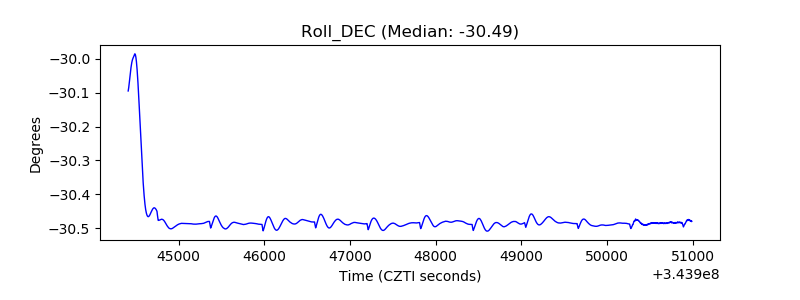 |
| _Roll_RA | 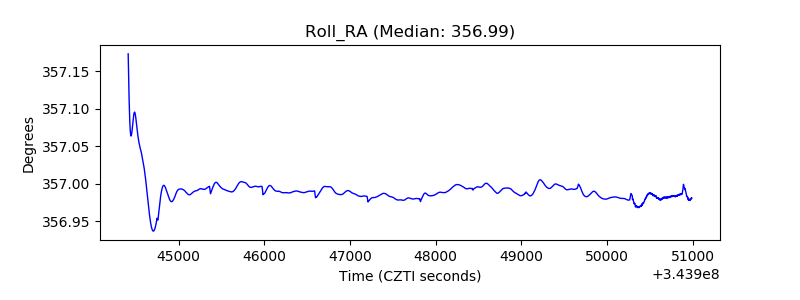 |
| Veto Counter | 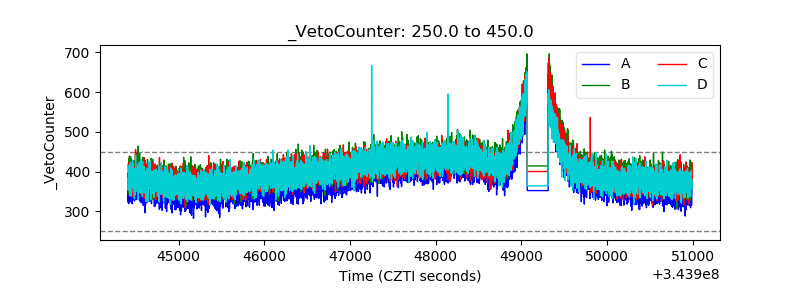 |