| Param | Original file | Final file |
|---|---|---|
| Filename | modeM0/AS1A10_048T06_9000004030_27898cztM0_level2.evt | modeM0/AS1A10_048T06_9000004030_27898cztM0_level2_quad_clean.evt |
| Size (bytes) | 688,132,800 | 103,538,880 |
| Size | 656.3 MB | 98.7 MB |
| Events in quadrant A | 3,561,315 | 693,124 |
| Events in quadrant B | 3,753,176 | 699,629 |
| Events in quadrant C | 3,849,832 | 655,314 |
| Events in quadrant D | 9,159,993 | 556,775 |
| Mode M0 | |||
|---|---|---|---|
| Quadrant | BADHDUFLAG | Total packets | Discarded packets |
| A | 0 | 15636 | 0 |
| B | 0 | 16114 | 0 |
| C | 0 | 16316 | 0 |
| D | 0 | 32616 | 0 |
| Mode M9 | |||
|---|---|---|---|
| Quadrant | BADHDUFLAG | Total packets | Discarded packets |
| A | 0 | 2 | 0 |
| B | 0 | 2 | 0 |
| C | 0 | 2 | 0 |
| D | 0 | 2 | 0 |
| Quadrant | Total seconds | Saturated seconds | Saturation percentage |
|---|---|---|---|
| A | 7615 | 55 | 0.722259% |
| B | 7616 | 90 | 1.181723% |
| C | 7616 | 190 | 2.494748% |
| D | 7616 | 1506 | 19.774160% |
Noise dominated data is calculated using 1-second bins in cleaned event files. If a bin has >2000 counts, and if more than 50% of those come from <1% of pixels, then it is considered to be noise-dominated and hence unusable.
| Quadrant | # 1 sec bins | Bins with >0 counts | Bins with >2000 counts | High rate bins dominated by noise | Noise dominated (total time) | Noise dominated (detector-on time) | Marked lightcurve |
|---|---|---|---|---|---|---|---|
| A | 7815 | 7616 | 1 | 1 | 0.01% | 0.01% | 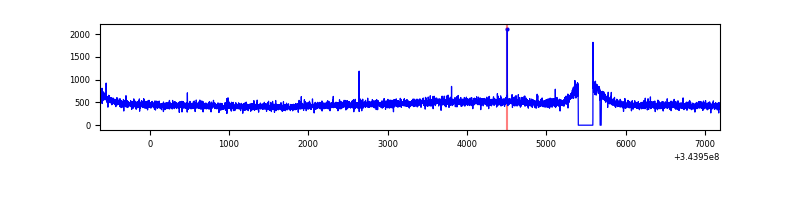 |
| B | 7816 | 7618 | 6 | 6 | 0.08% | 0.08% | 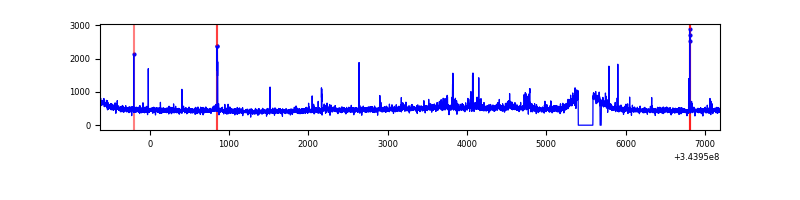 |
| C | 7816 | 7618 | 1 | 1 | 0.01% | 0.01% | 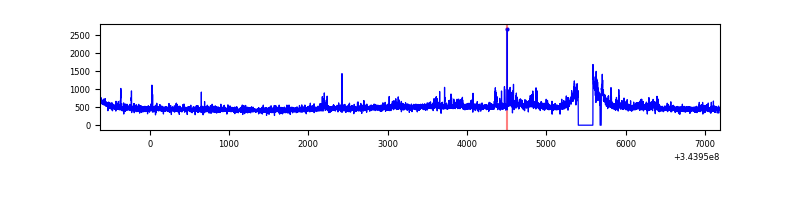 |
| D | 7816 | 7617 | 1217 | 1217 | 15.57% | 15.98% | 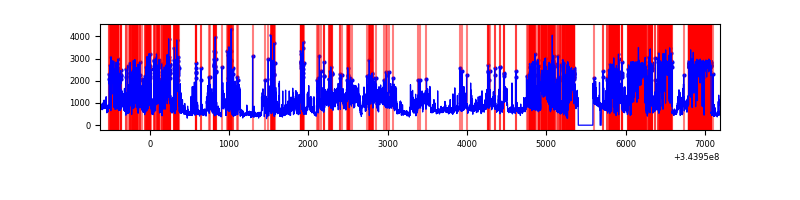 |
Top three noisy pixels from each quadrant. If the there are fewer than three noisy pixels in the level2.evt file, extra rows are filled as -1
| Pixel properties | Quadrant properties | ||||||
|---|---|---|---|---|---|---|---|
| Quadrant | DetID | PixID | Counts | Sigma | Mean | Median | Sigma |
| A | 13 | 254 | 12410 | 62.65 | 918 | 899 | 183.7 |
| A | 3 | 137 | 8985 | 44.01 | 918 | 899 | 183.7 |
| A | 0 | 226 | 7755 | 37.31 | 918 | 899 | 183.7 |
| B | 10 | 245 | 87121 | 488.82 | 917 | 892 | 176.4 |
| B | 12 | 111 | 21986 | 119.58 | 917 | 892 | 176.4 |
| B | 0 | 189 | 19564 | 105.85 | 917 | 892 | 176.4 |
| C | 3 | 233 | 249068 | 1205.11 | 872 | 873 | 206.0 |
| C | 14 | 238 | 157226 | 759.17 | 872 | 873 | 206.0 |
| C | 14 | 94 | 24332 | 113.91 | 872 | 873 | 206.0 |
| D | 1 | 52 | 2710423 | 13995.18 | 797 | 772 | 193.6 |
| D | 13 | 104 | 1576553 | 8138.81 | 797 | 772 | 193.6 |
| D | 7 | 238 | 872551 | 4502.69 | 797 | 772 | 193.6 |
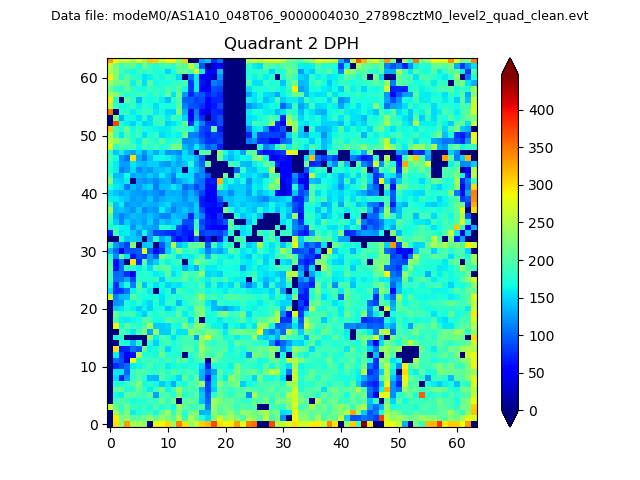
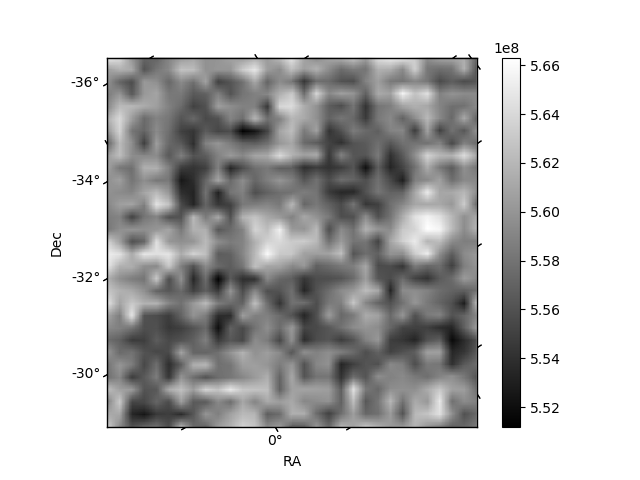
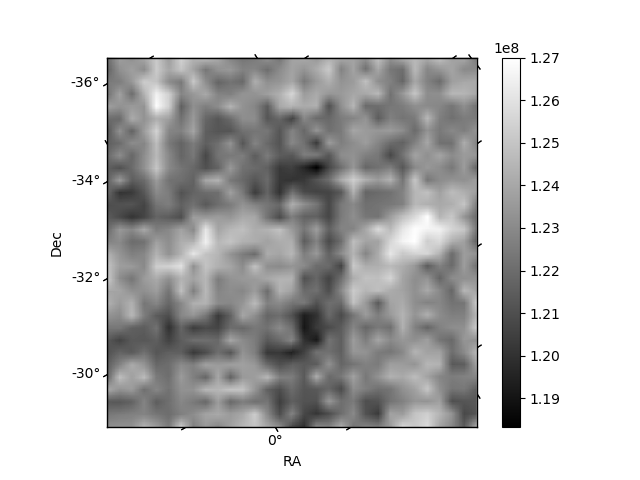
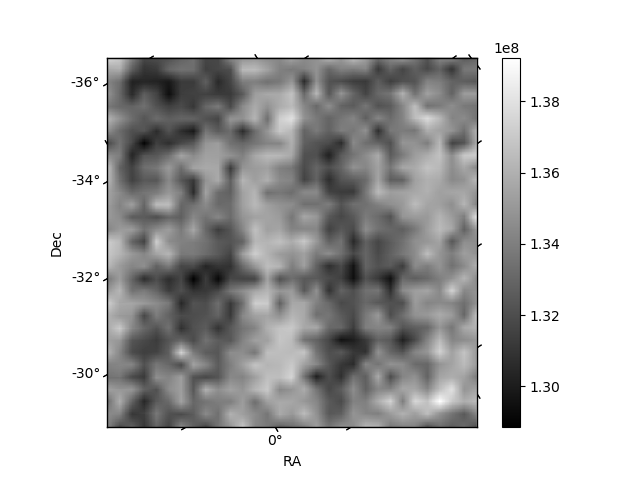
Histogram calculated using DETX and DETY for each event in the final _common_clean file
| Quadrant A | 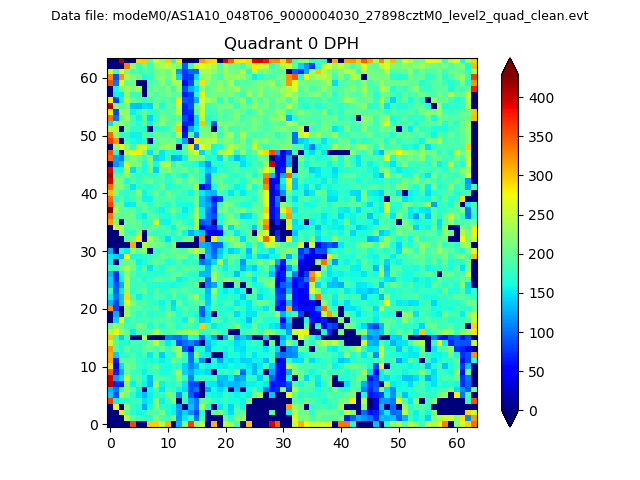 |
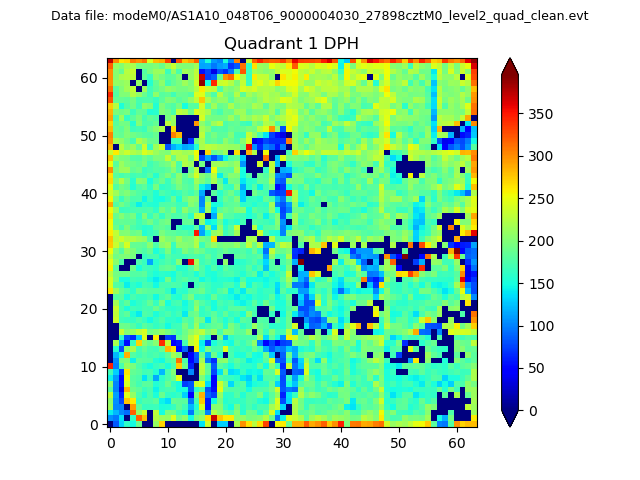 |
Quadrant B |
|---|---|---|---|
| Quadrant D | 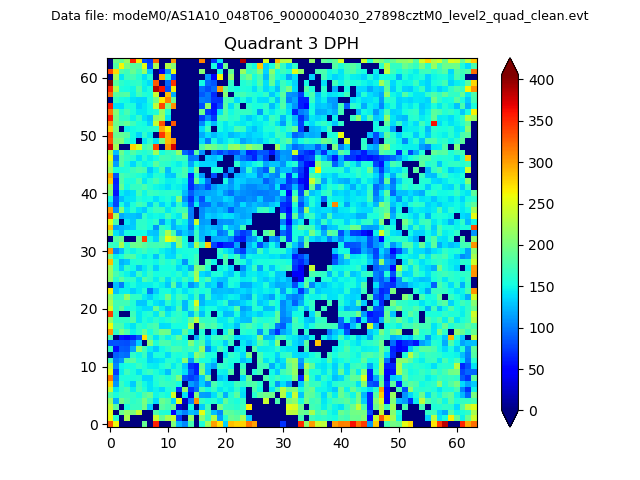 |
 |
Quadrant C |
| Plot type | Count rate plots | Images |
|---|---|---|
| Comparison with Poisson distribution Blue bars denote a histogram of data divided into 1 sec bins. Red curve is a Poisson curve with rate = median count rate of data. |
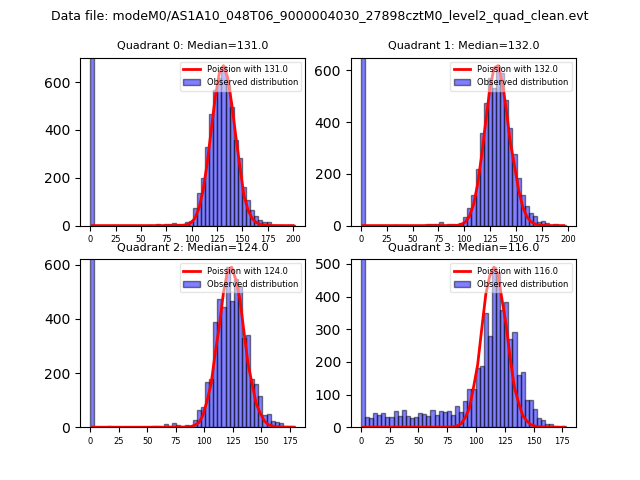 |
 |
| Quadrant-wise count rates Data is divided into 100 sec bins |
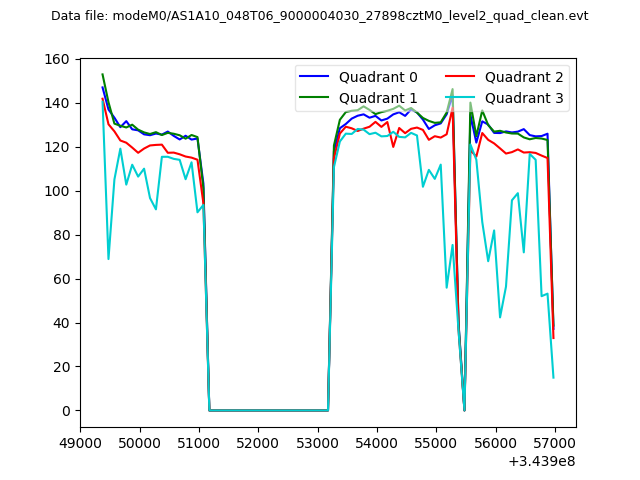 |
|
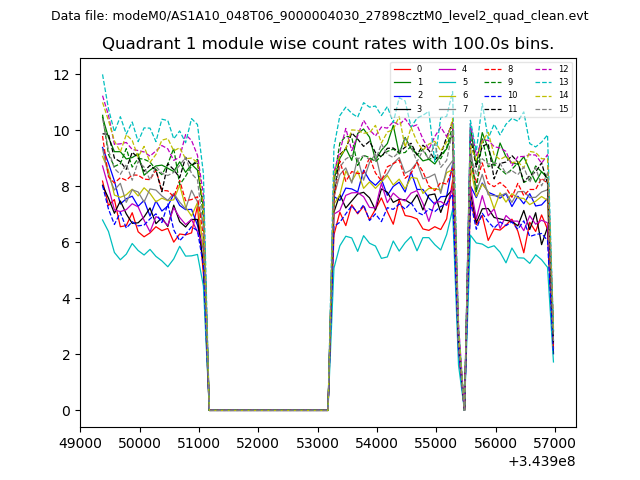
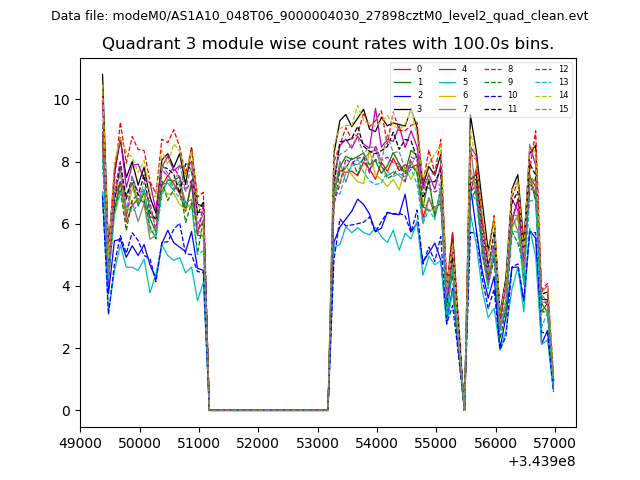
| Module-wise count rates for Quadrant A Data is divided into 100 sec bins |
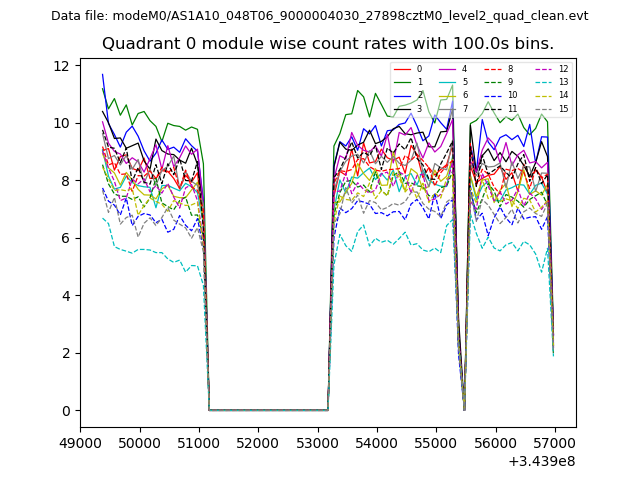 |
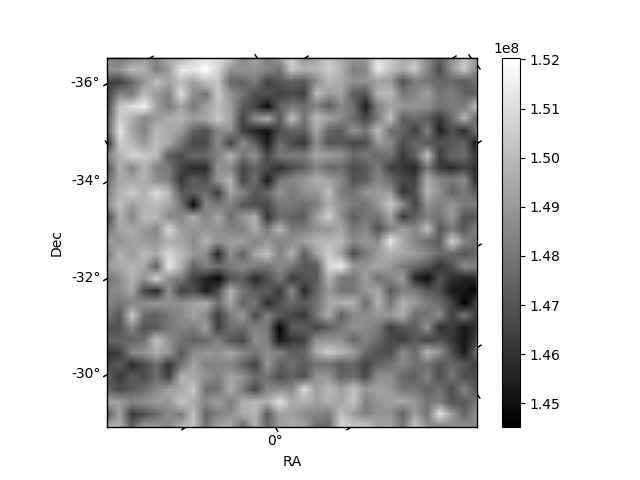 |
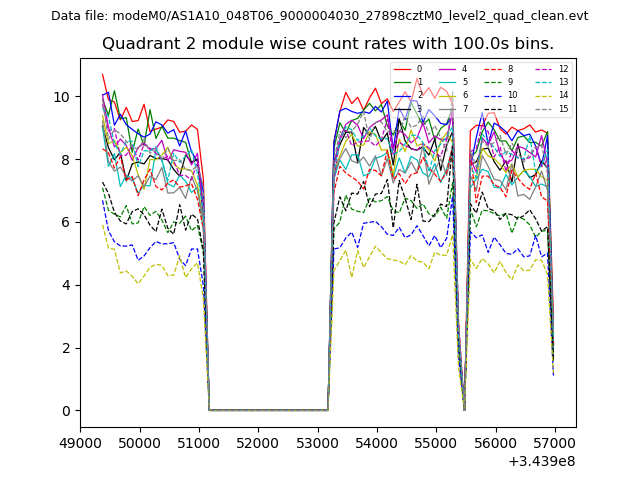
| Module-wise count rates for Quadrant B Data is divided into 100 sec bins |
 |
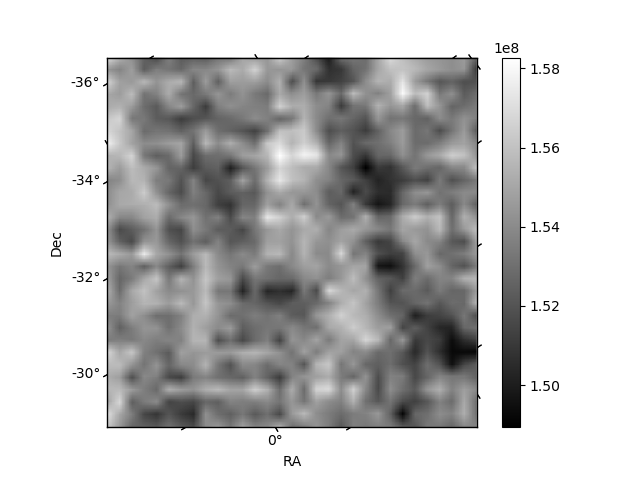 |
| Module-wise count rates for Quadrant C Data is divided into 100 sec bins |
 |
 |
| Module-wise count rates for Quadrant D Data is divided into 100 sec bins |
 |
 |
| Parameter | Plot |
|---|---|
| CZT HV Monitor | 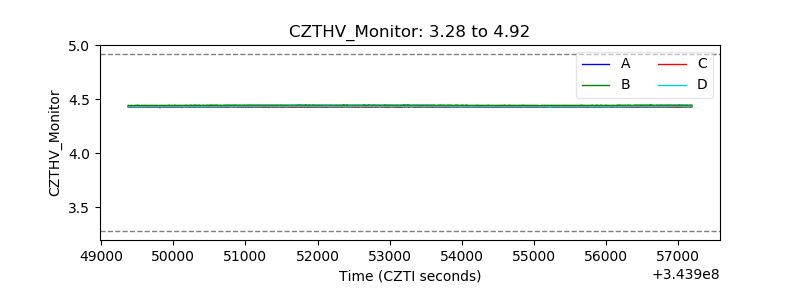 |
| D_VDD | 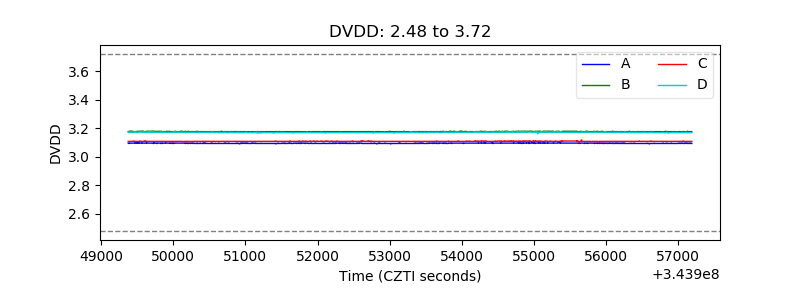 |
| Temperature 1 | 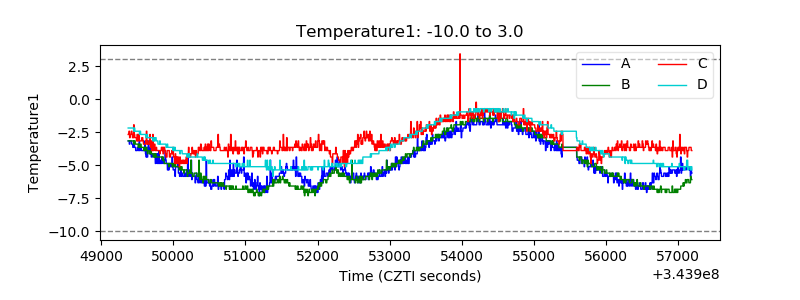 |
| Veto HV Monitor | 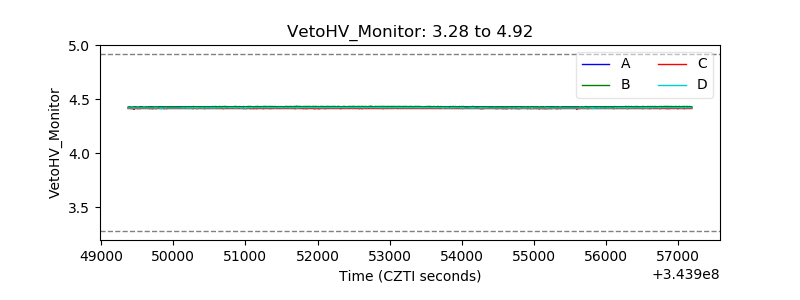 |
| Veto LLD | 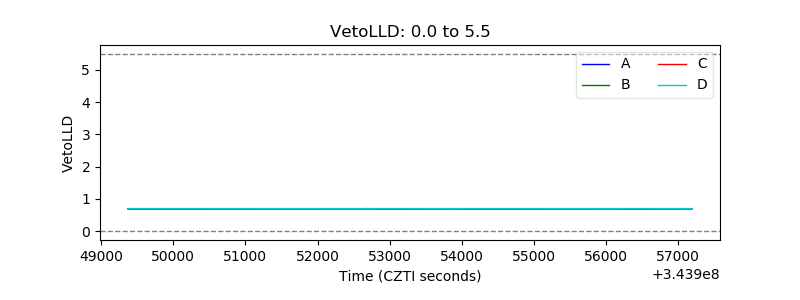 |
| Alpha Counter | 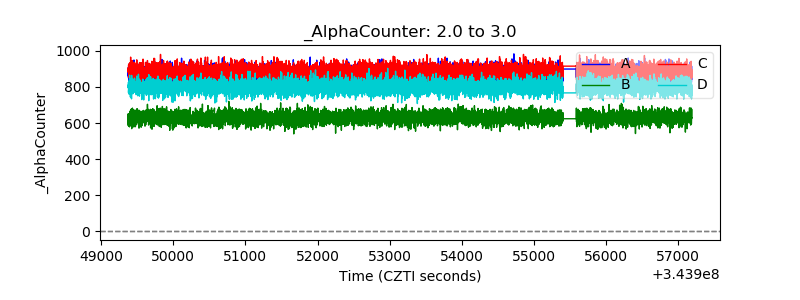 |
| _CPM_Rate | 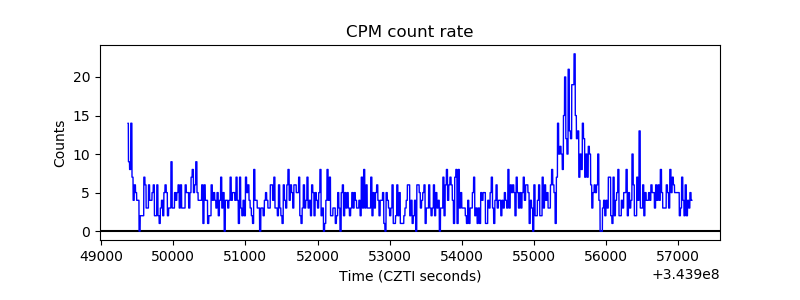 |
| CZT Counter | 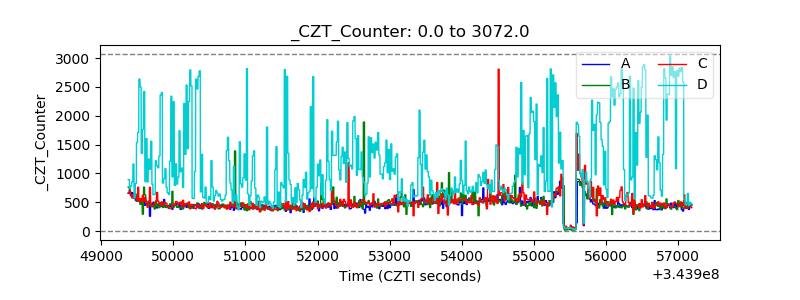 |
| +2.5 Volts monitor | 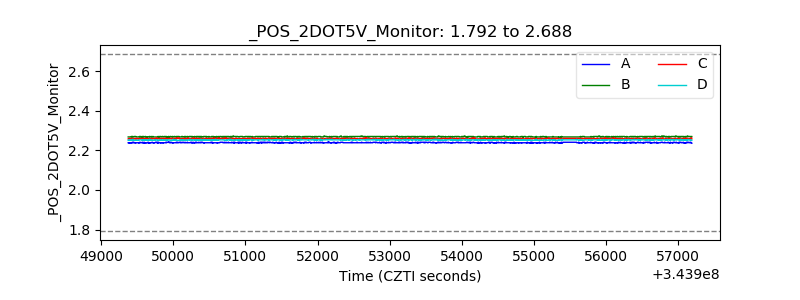 |
| +5 Volts monitor |  |
| _ROLL_ROT | 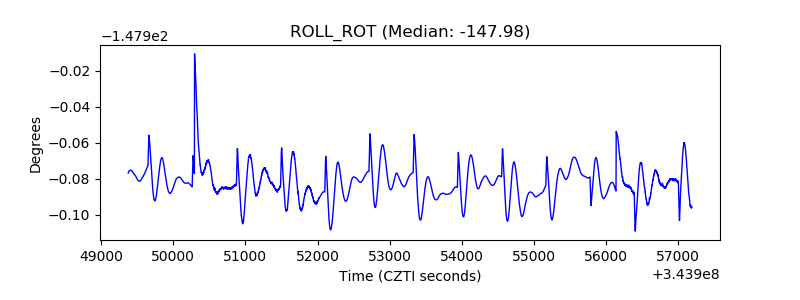 |
| _Roll_DEC | 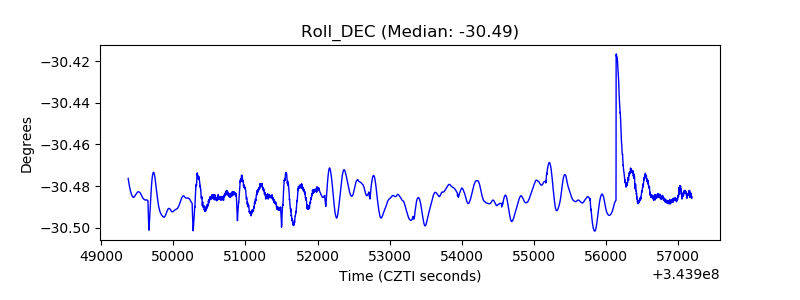 |
| _Roll_RA | 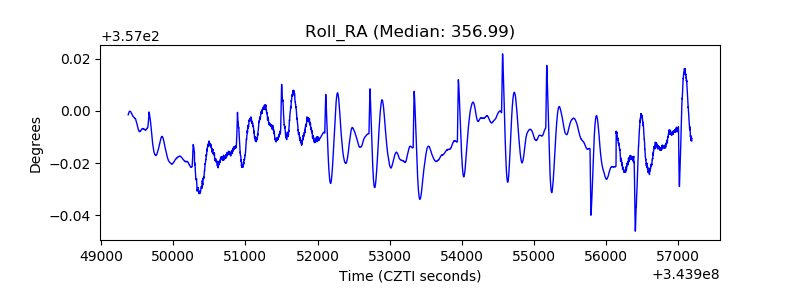 |
| Veto Counter | 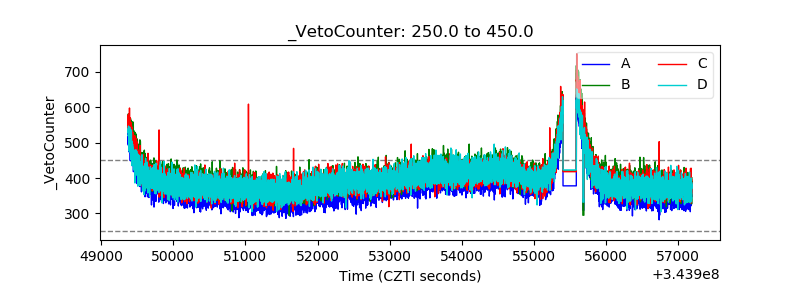 |