| Param | Original file | Final file |
|---|---|---|
| Filename | modeM0/AS1A10_048T06_9000004030_27899cztM0_level2.evt | modeM0/AS1A10_048T06_9000004030_27899cztM0_level2_quad_clean.evt |
| Size (bytes) | 630,250,560 | 86,999,040 |
| Size | 601.1 MB | 83.0 MB |
| Events in quadrant A | 3,303,590 | 571,697 |
| Events in quadrant B | 3,498,629 | 573,228 |
| Events in quadrant C | 3,476,545 | 543,903 |
| Events in quadrant D | 8,319,048 | 442,354 |
| Mode M0 | |||
|---|---|---|---|
| Quadrant | BADHDUFLAG | Total packets | Discarded packets |
| A | 0 | 14645 | 0 |
| B | 0 | 15103 | 0 |
| C | 0 | 14871 | 0 |
| D | 0 | 29722 | 0 |
| Mode M9 | |||
|---|---|---|---|
| Quadrant | BADHDUFLAG | Total packets | Discarded packets |
| A | 0 | 4 | 0 |
| B | 0 | 4 | 0 |
| C | 0 | 4 | 0 |
| D | 0 | 4 | 0 |
| Quadrant | Total seconds | Saturated seconds | Saturation percentage |
|---|---|---|---|
| A | 7221 | 26 | 0.360061% |
| B | 7221 | 39 | 0.540091% |
| C | 7221 | 76 | 1.052486% |
| D | 7221 | 1647 | 22.808475% |
Noise dominated data is calculated using 1-second bins in cleaned event files. If a bin has >2000 counts, and if more than 50% of those come from <1% of pixels, then it is considered to be noise-dominated and hence unusable.
| Quadrant | # 1 sec bins | Bins with >0 counts | Bins with >2000 counts | High rate bins dominated by noise | Noise dominated (total time) | Noise dominated (detector-on time) | Marked lightcurve |
|---|---|---|---|---|---|---|---|
| A | 7656 | 7222 | 1 | 1 | 0.01% | 0.01% | 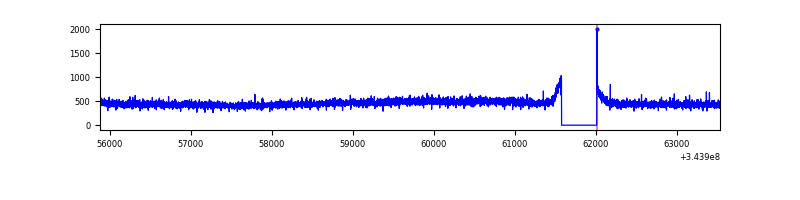 |
| B | 7656 | 7221 | 3 | 3 | 0.04% | 0.04% | 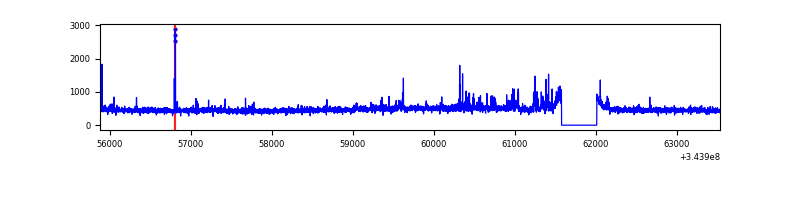 |
| C | 7656 | 7221 | 1 | 1 | 0.01% | 0.01% | 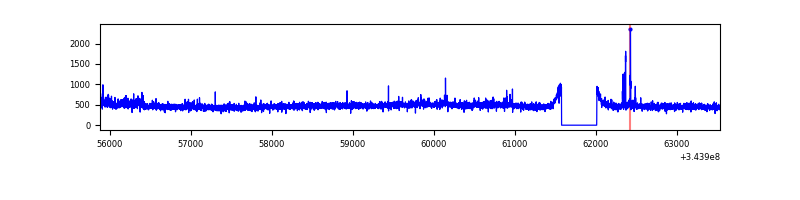 |
| D | 7656 | 7221 | 1382 | 1382 | 18.05% | 19.14% | 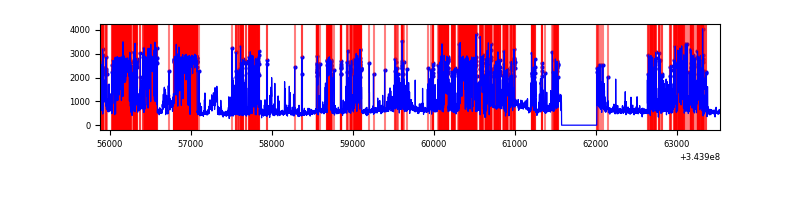 |
Top three noisy pixels from each quadrant. If the there are fewer than three noisy pixels in the level2.evt file, extra rows are filled as -1
| Pixel properties | Quadrant properties | ||||||
|---|---|---|---|---|---|---|---|
| Quadrant | DetID | PixID | Counts | Sigma | Mean | Median | Sigma |
| A | 13 | 254 | 10814 | 57.59 | 854 | 836 | 173.2 |
| A | 3 | 137 | 8356 | 43.41 | 854 | 836 | 173.2 |
| A | 0 | 226 | 7254 | 37.04 | 854 | 836 | 173.2 |
| B | 0 | 230 | 99753 | 602.98 | 849 | 828 | 164.1 |
| B | 10 | 245 | 29617 | 175.48 | 849 | 828 | 164.1 |
| B | 12 | 111 | 20603 | 120.54 | 849 | 828 | 164.1 |
| C | 14 | 238 | 131205 | 678.22 | 817 | 821 | 192.2 |
| C | 3 | 233 | 120450 | 622.27 | 817 | 821 | 192.2 |
| C | 2 | 16 | 39453 | 200.95 | 817 | 821 | 192.2 |
| D | 1 | 52 | 3978544 | 23040.17 | 720 | 700 | 172.6 |
| D | 8 | 195 | 987985 | 5718.48 | 720 | 700 | 172.6 |
| D | 7 | 238 | 335670 | 1940.19 | 720 | 700 | 172.6 |
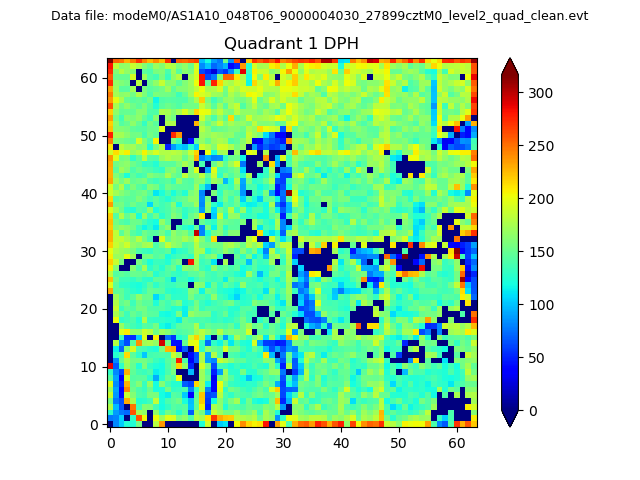
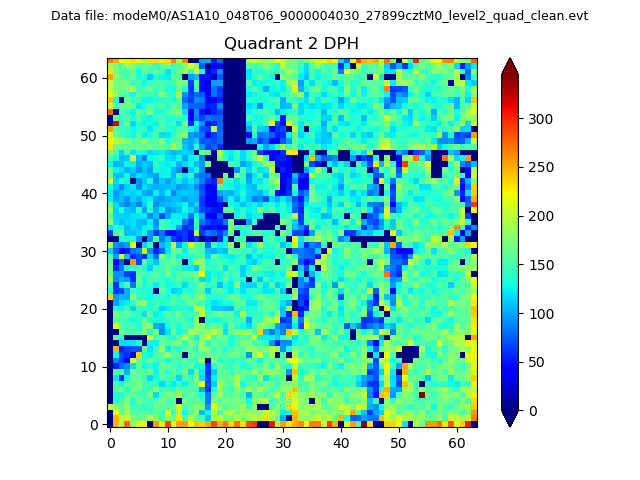
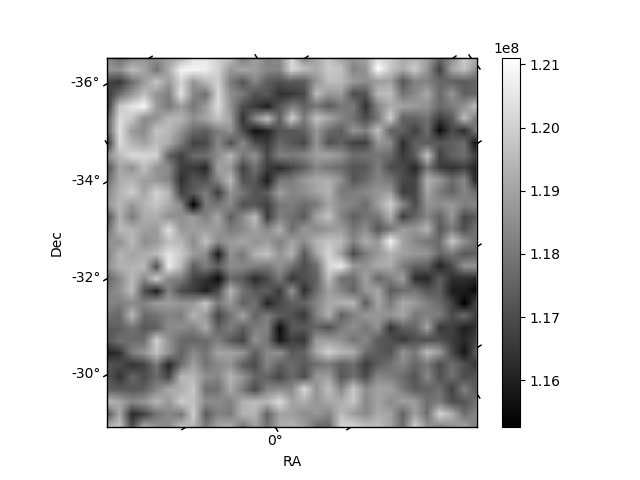
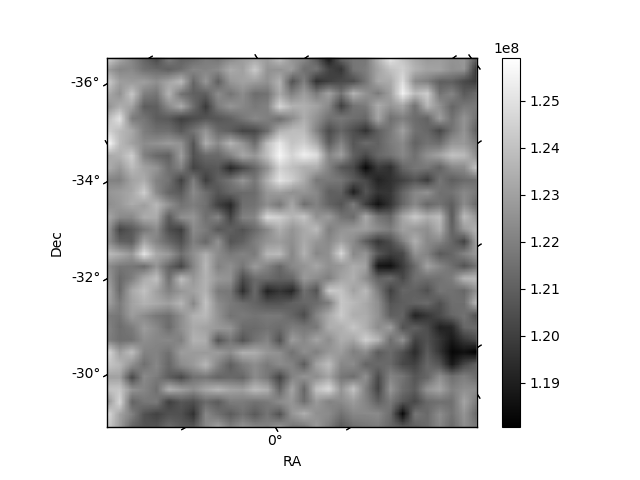
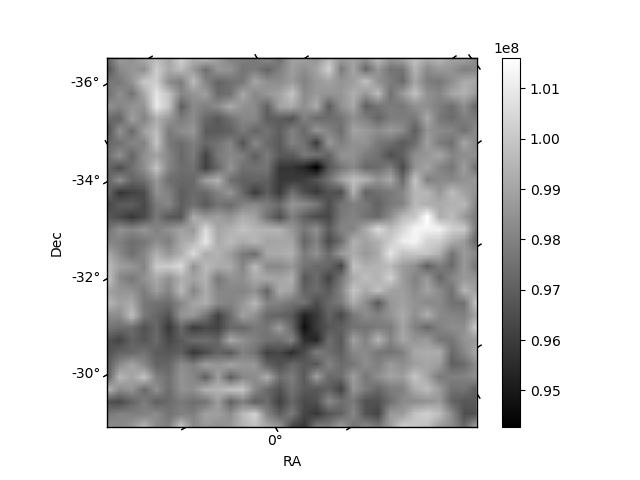
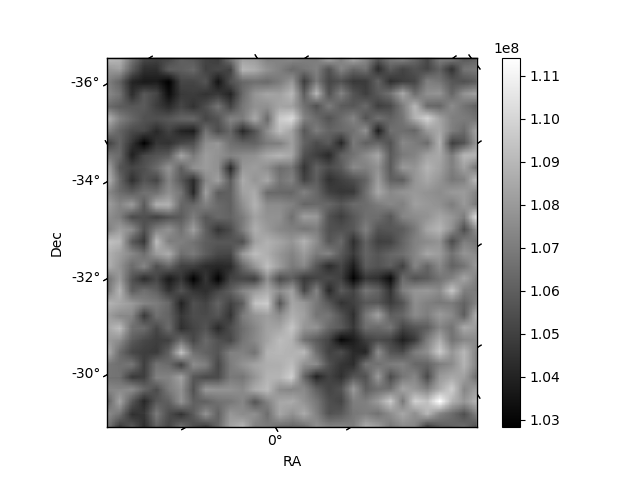
Histogram calculated using DETX and DETY for each event in the final _common_clean file
| Quadrant A |  |
 |
Quadrant B |
|---|---|---|---|
| Quadrant D | 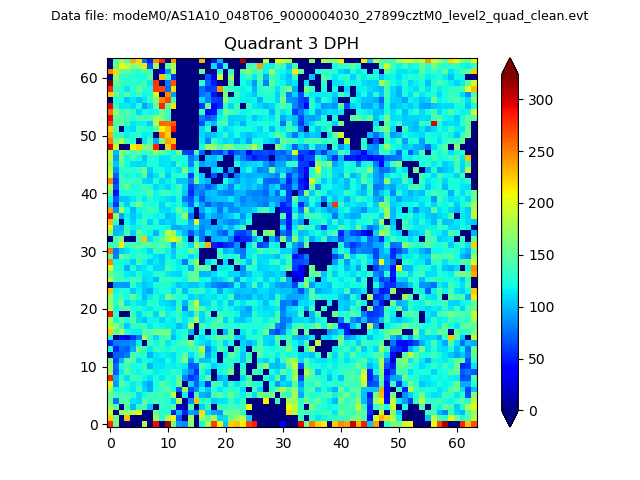 |
 |
Quadrant C |
| Plot type | Count rate plots | Images |
|---|---|---|
| Comparison with Poisson distribution Blue bars denote a histogram of data divided into 1 sec bins. Red curve is a Poisson curve with rate = median count rate of data. |
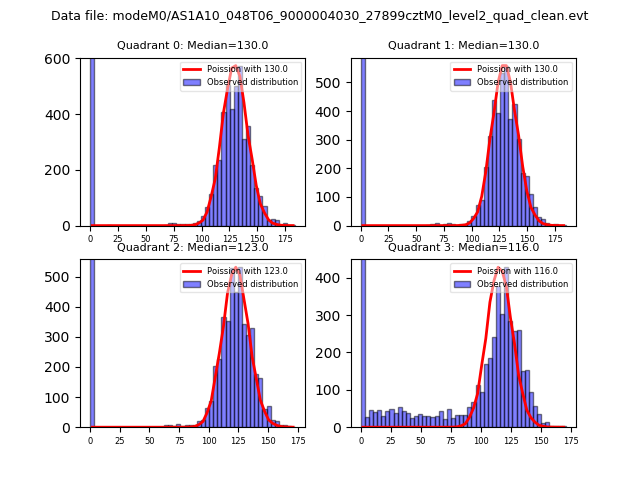 |
 |
| Quadrant-wise count rates Data is divided into 100 sec bins |
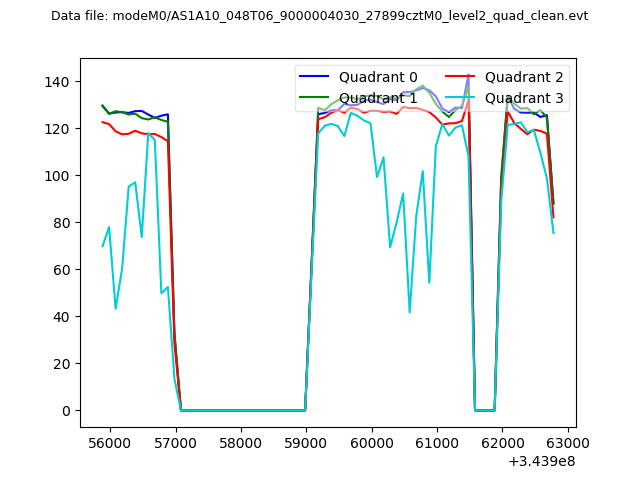 |
|
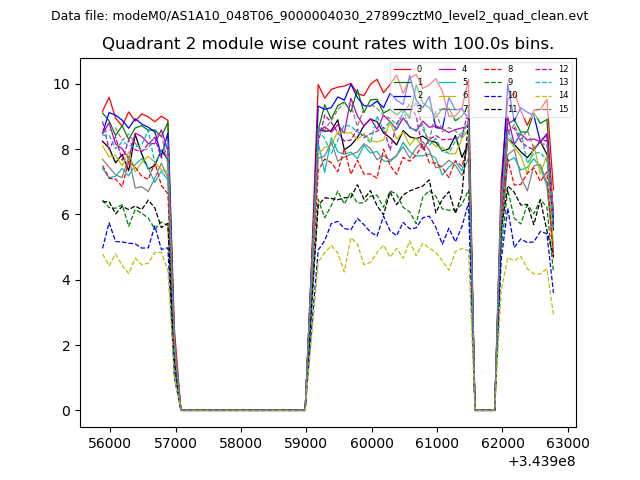
| Module-wise count rates for Quadrant A Data is divided into 100 sec bins |
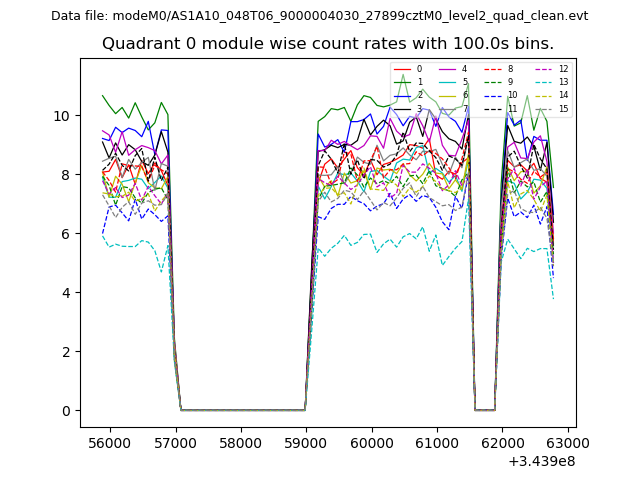 |
 |
| Module-wise count rates for Quadrant B Data is divided into 100 sec bins |
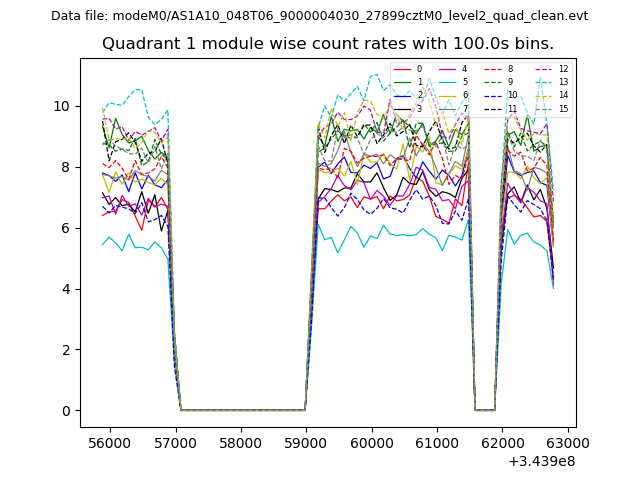 |
 |
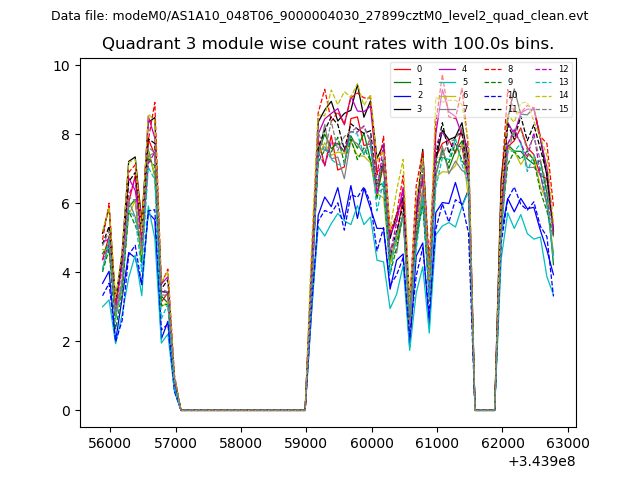
| Module-wise count rates for Quadrant C Data is divided into 100 sec bins |
 |
 |
| Module-wise count rates for Quadrant D Data is divided into 100 sec bins |
 |
 |
| Parameter | Plot |
|---|---|
| CZT HV Monitor | 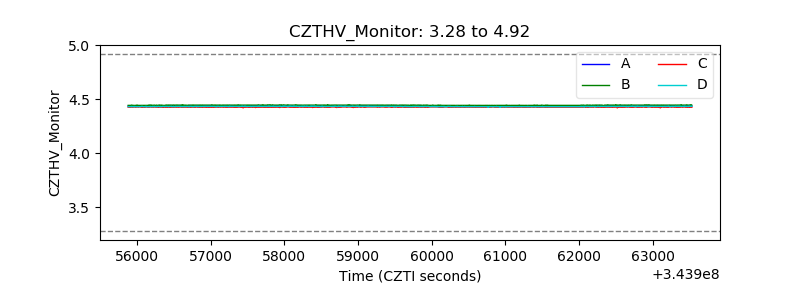 |
| D_VDD | 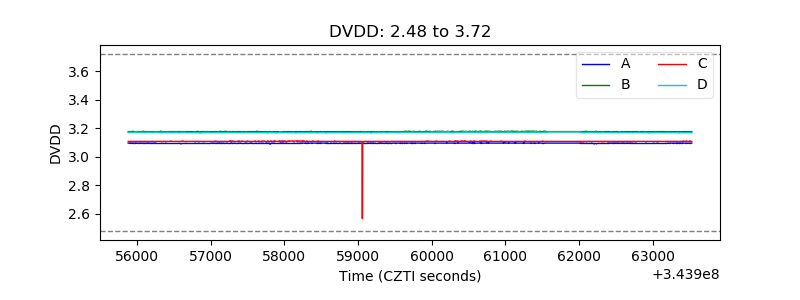 |
| Temperature 1 |  |
| Veto HV Monitor | 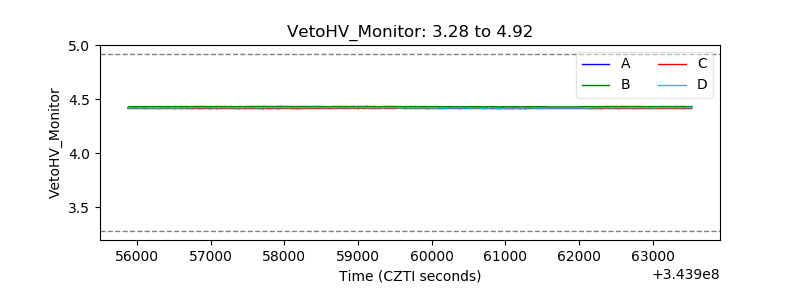 |
| Veto LLD | 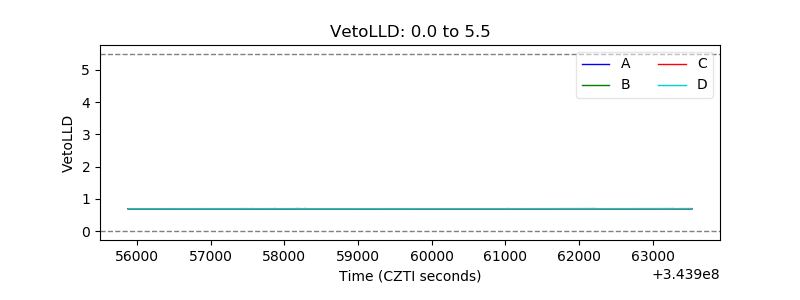 |
| Alpha Counter | 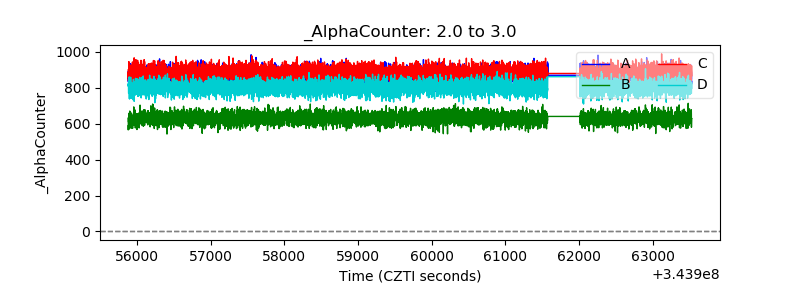 |
| _CPM_Rate | 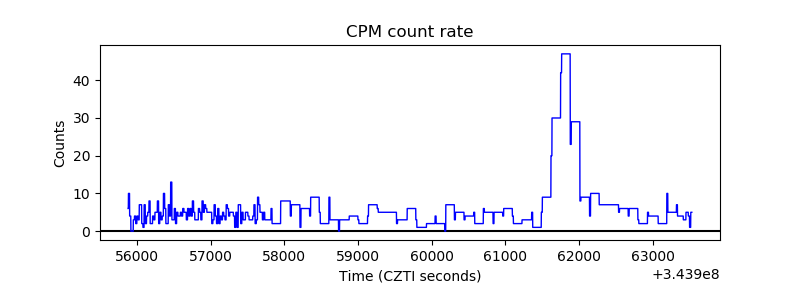 |
| CZT Counter | 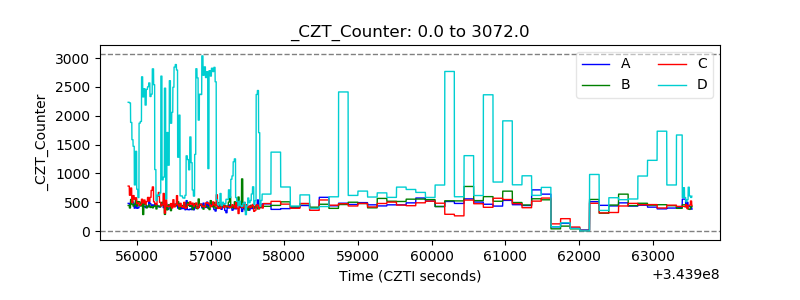 |
| +2.5 Volts monitor | 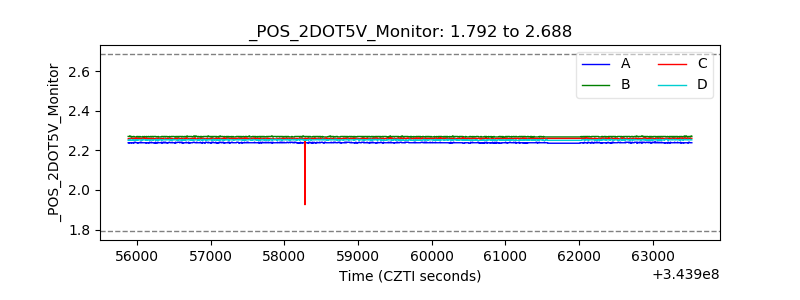 |
| +5 Volts monitor |  |
| _ROLL_ROT | 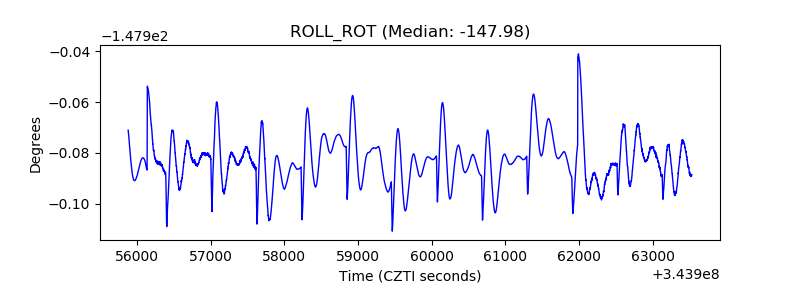 |
| _Roll_DEC | 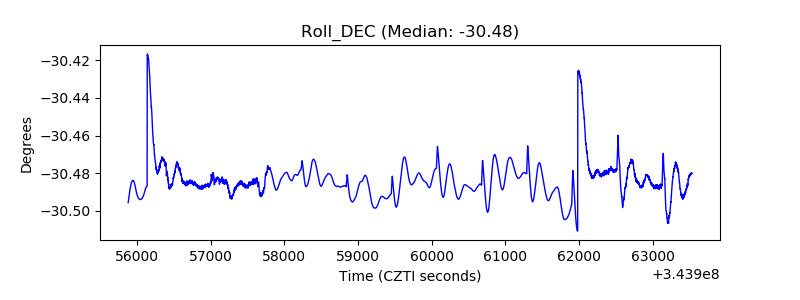 |
| _Roll_RA | 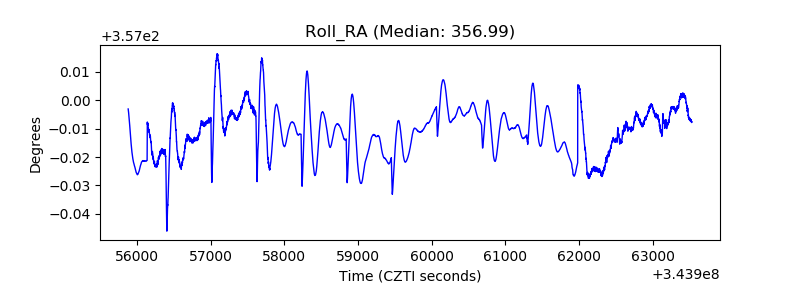 |
| Veto Counter | 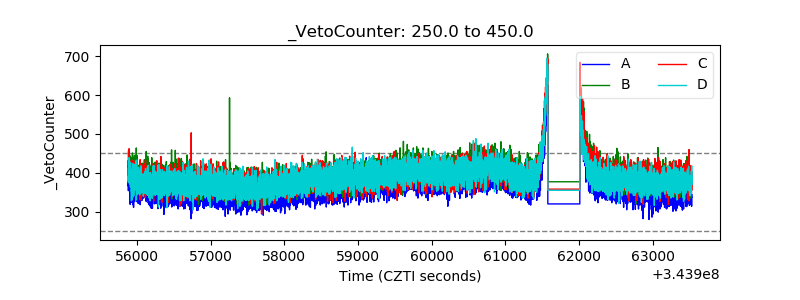 |