| Param | Original file | Final file |
|---|---|---|
| Filename | modeM0/AS1A10_048T06_9000004030_27901cztM0_level2.evt | modeM0/AS1A10_048T06_9000004030_27901cztM0_level2_quad_clean.evt |
| Size (bytes) | 1,000,028,160 | 135,192,960 |
| Size | 953.7 MB | 128.9 MB |
| Events in quadrant A | 5,990,086 | 847,190 |
| Events in quadrant B | 5,968,361 | 854,209 |
| Events in quadrant C | 5,969,674 | 814,225 |
| Events in quadrant D | 11,520,193 | 721,644 |
| Mode M0 | |||
|---|---|---|---|
| Quadrant | BADHDUFLAG | Total packets | Discarded packets |
| A | 0 | 25941 | 0 |
| B | 0 | 25548 | 0 |
| C | 0 | 25584 | 0 |
| D | 0 | 42439 | 0 |
| Mode M9 | |||
|---|---|---|---|
| Quadrant | BADHDUFLAG | Total packets | Discarded packets |
| A | 0 | 14 | 0 |
| B | 0 | 14 | 0 |
| C | 0 | 14 | 0 |
| D | 0 | 14 | 0 |
| Quadrant | Total seconds | Saturated seconds | Saturation percentage |
|---|---|---|---|
| A | 12395 | 97 | 0.782574% |
| B | 12396 | 111 | 0.895450% |
| C | 12396 | 166 | 1.339142% |
| D | 12396 | 1594 | 12.858987% |
Noise dominated data is calculated using 1-second bins in cleaned event files. If a bin has >2000 counts, and if more than 50% of those come from <1% of pixels, then it is considered to be noise-dominated and hence unusable.
| Quadrant | # 1 sec bins | Bins with >0 counts | Bins with >2000 counts | High rate bins dominated by noise | Noise dominated (total time) | Noise dominated (detector-on time) | Marked lightcurve |
|---|---|---|---|---|---|---|---|
| A | 13710 | 12396 | 2 | 2 | 0.01% | 0.02% | 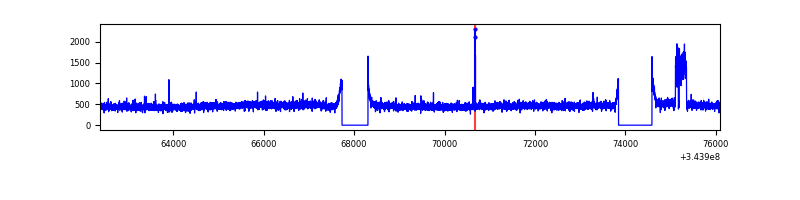 |
| B | 13711 | 12396 | 0 | 0 | 0.00% | 0.00% | 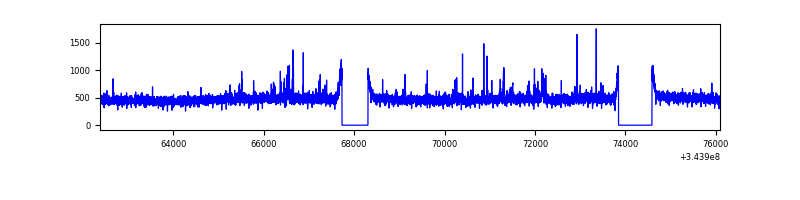 |
| C | 13711 | 12396 | 1 | 1 | 0.01% | 0.01% | 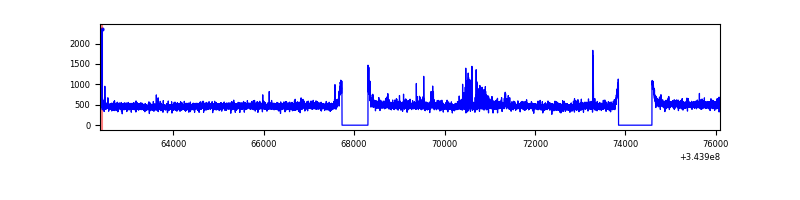 |
| D | 13711 | 12396 | 1321 | 1321 | 9.63% | 10.66% | 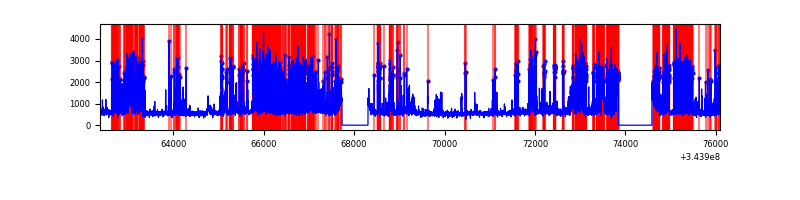 |
Top three noisy pixels from each quadrant. If the there are fewer than three noisy pixels in the level2.evt file, extra rows are filled as -1
| Pixel properties | Quadrant properties | ||||||
|---|---|---|---|---|---|---|---|
| Quadrant | DetID | PixID | Counts | Sigma | Mean | Median | Sigma |
| A | 6 | 16 | 226249 | 753.14 | 1487 | 1455 | 298.5 |
| A | 13 | 254 | 18027 | 55.52 | 1487 | 1455 | 298.5 |
| A | 3 | 137 | 14655 | 44.22 | 1487 | 1455 | 298.5 |
| B | 0 | 230 | 69046 | 236.45 | 1480 | 1438 | 285.9 |
| B | 10 | 245 | 43702 | 147.81 | 1480 | 1438 | 285.9 |
| B | 12 | 111 | 35910 | 120.56 | 1480 | 1438 | 285.9 |
| C | 14 | 238 | 229991 | 687.28 | 1423 | 1431 | 332.6 |
| C | 2 | 16 | 97408 | 288.6 | 1423 | 1431 | 332.6 |
| C | 10 | 1 | 48434 | 141.34 | 1423 | 1431 | 332.6 |
| D | 1 | 52 | 4346437 | 13601.38 | 1331 | 1294 | 319.5 |
| D | 8 | 195 | 1735122 | 5427.31 | 1331 | 1294 | 319.5 |
| D | 2 | 250 | 183931 | 571.7 | 1331 | 1294 | 319.5 |
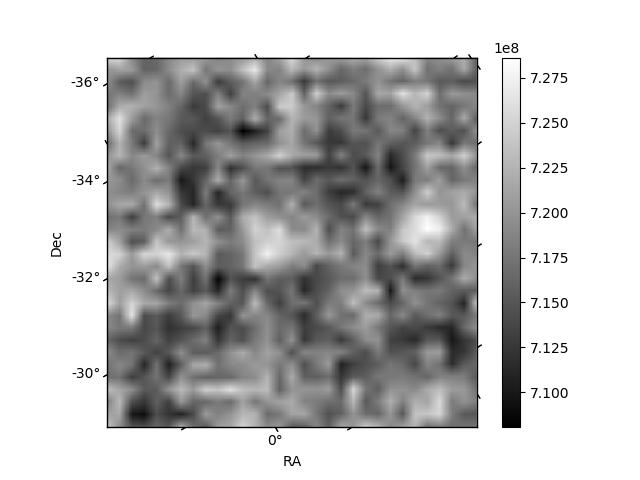
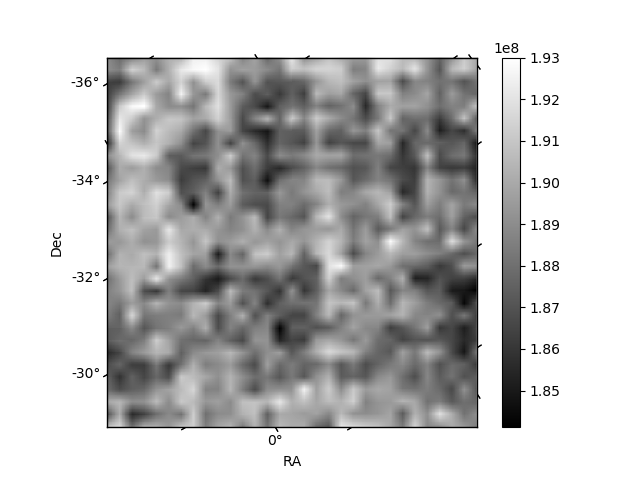
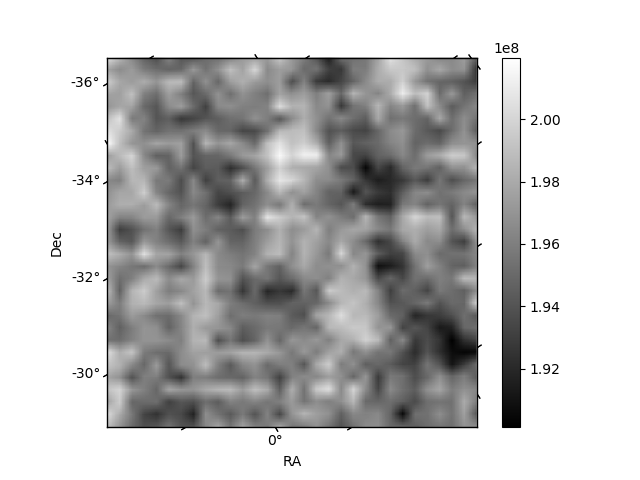
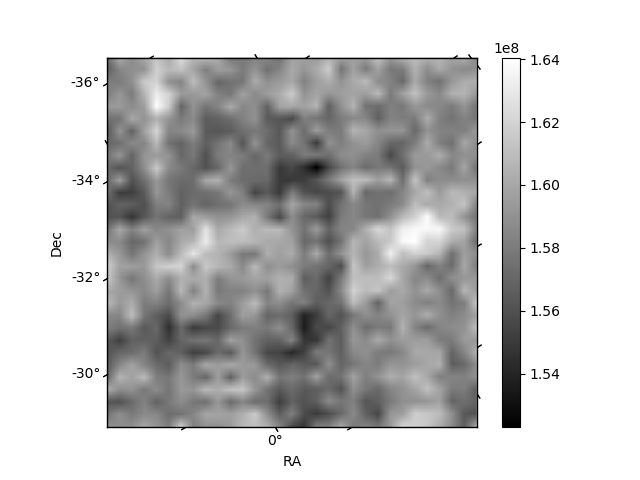
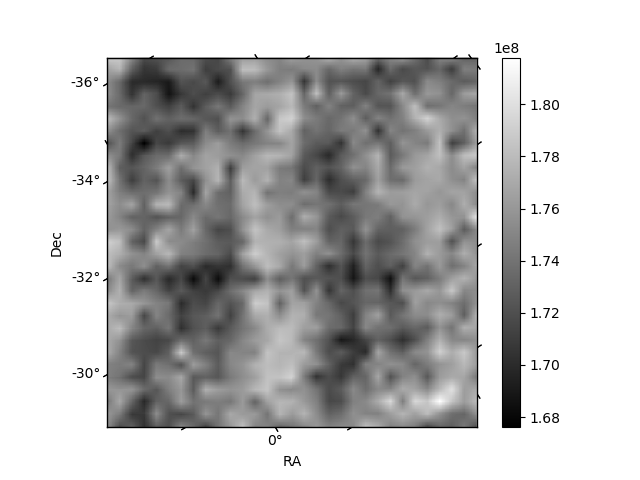
Histogram calculated using DETX and DETY for each event in the final _common_clean file
| Quadrant A | 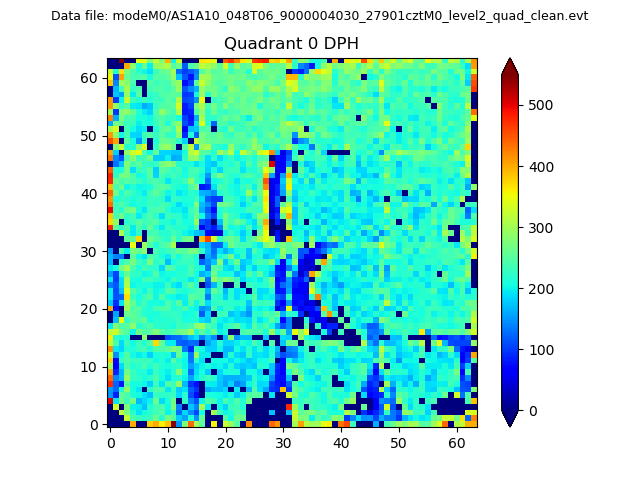 |
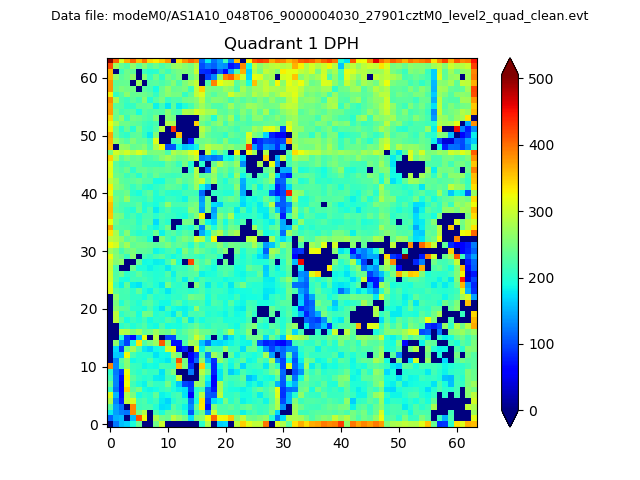 |
Quadrant B |
|---|---|---|---|
| Quadrant D | 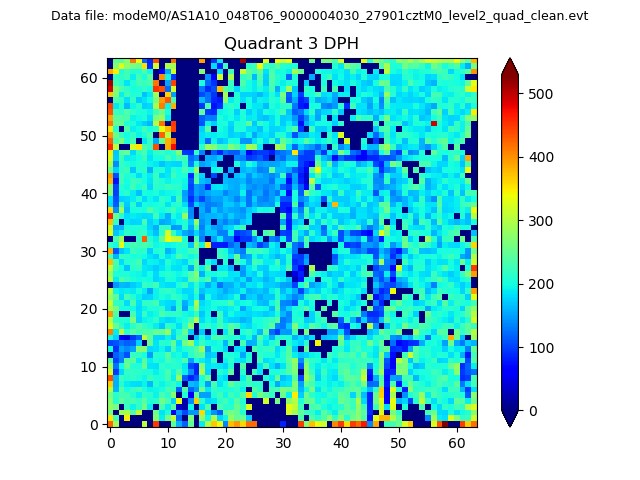 |
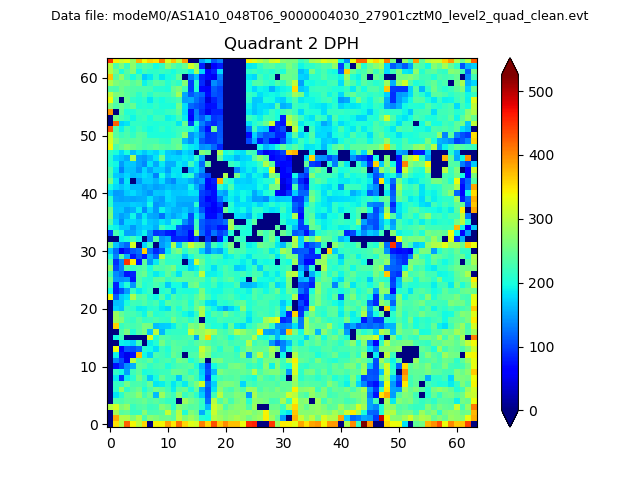 |
Quadrant C |
| Plot type | Count rate plots | Images |
|---|---|---|
| Comparison with Poisson distribution Blue bars denote a histogram of data divided into 1 sec bins. Red curve is a Poisson curve with rate = median count rate of data. |
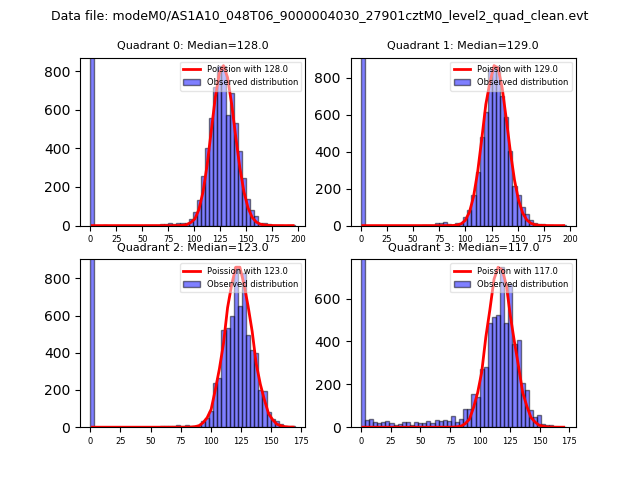 |
 |
| Quadrant-wise count rates Data is divided into 100 sec bins |
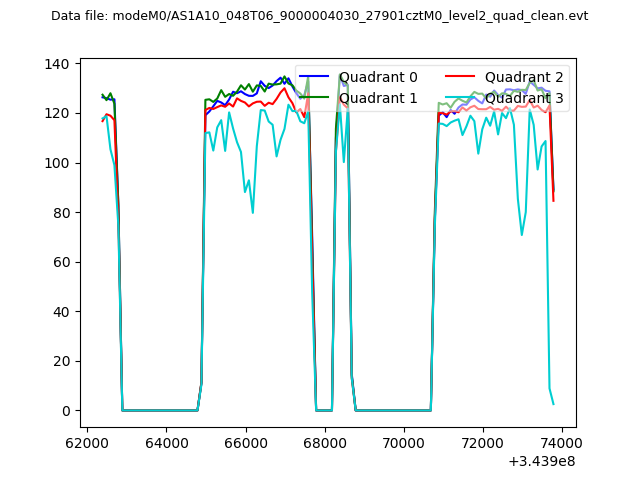 |
|
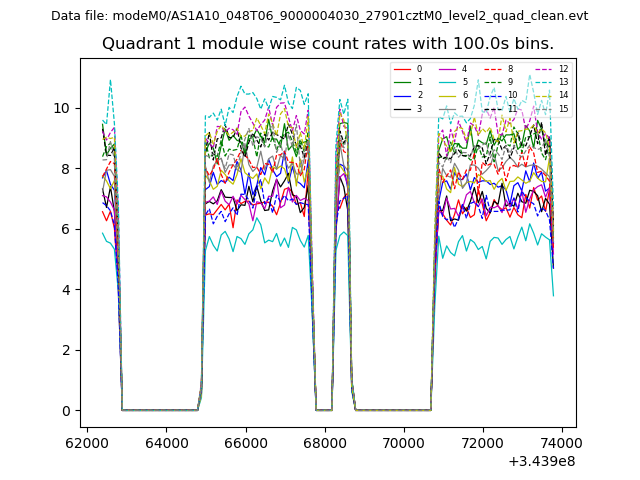
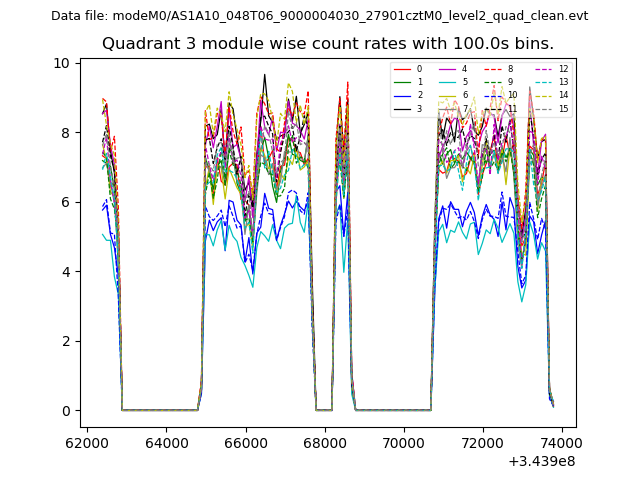
| Module-wise count rates for Quadrant A Data is divided into 100 sec bins |
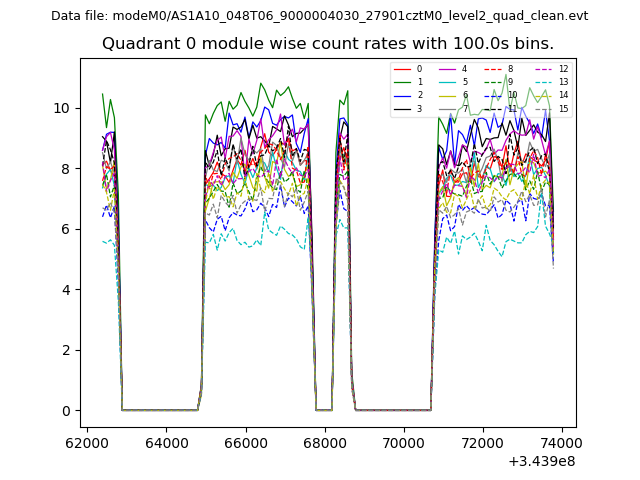 |
 |
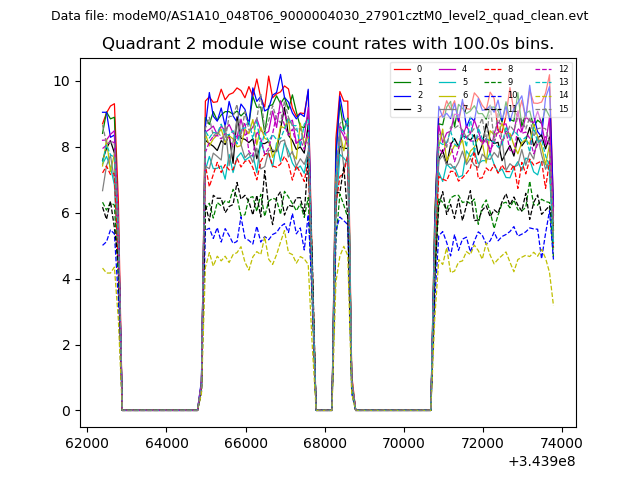
| Module-wise count rates for Quadrant B Data is divided into 100 sec bins |
 |
 |
| Module-wise count rates for Quadrant C Data is divided into 100 sec bins |
 |
 |
| Module-wise count rates for Quadrant D Data is divided into 100 sec bins |
 |
 |
| Parameter | Plot |
|---|---|
| CZT HV Monitor | 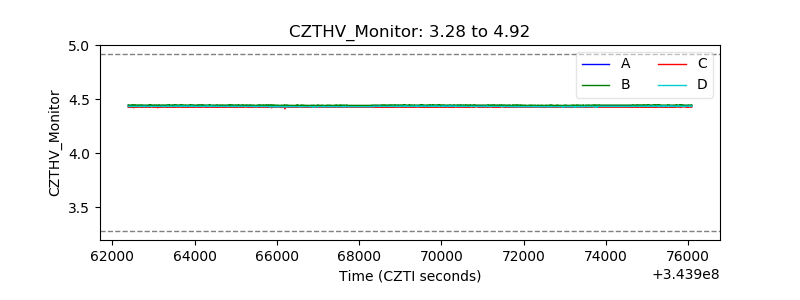 |
| D_VDD | 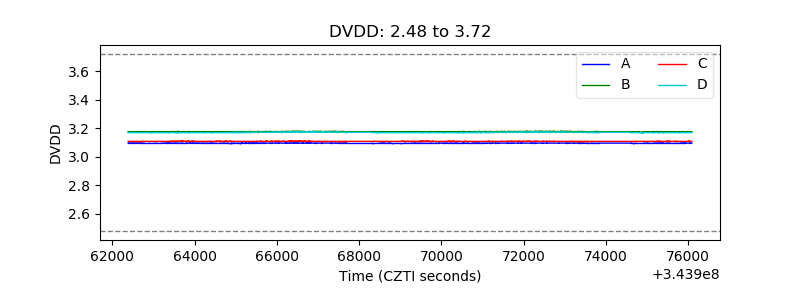 |
| Temperature 1 | 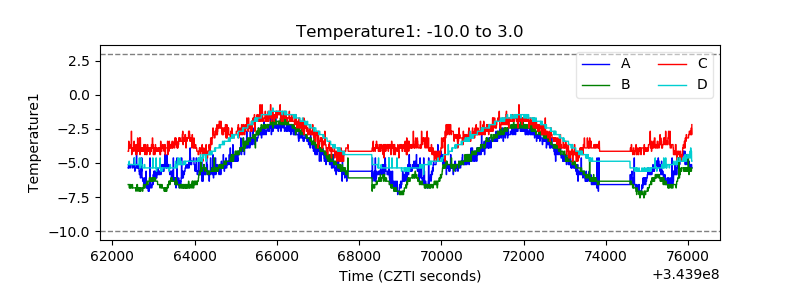 |
| Veto HV Monitor | 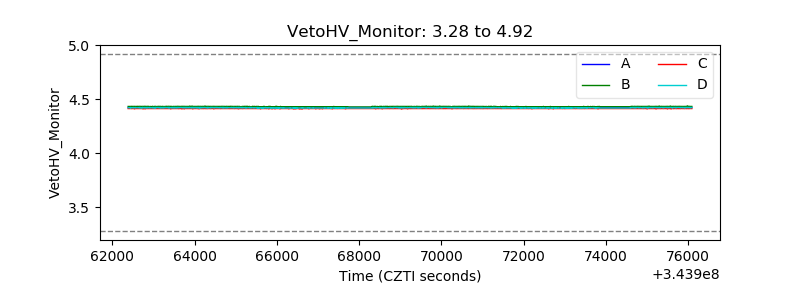 |
| Veto LLD | 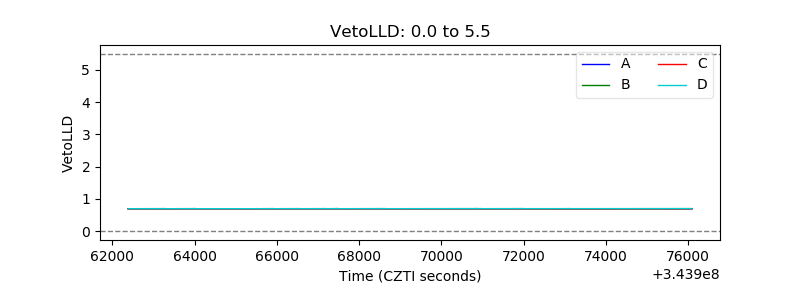 |
| Alpha Counter | 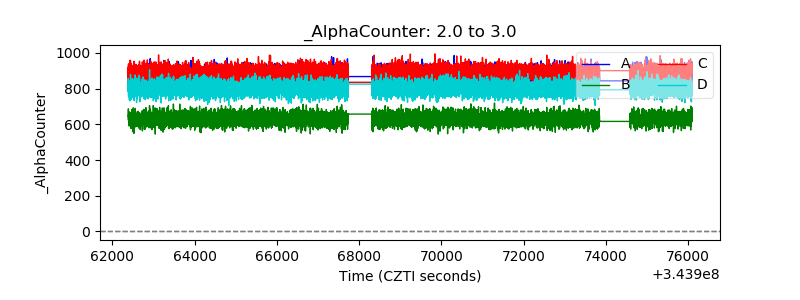 |
| _CPM_Rate | 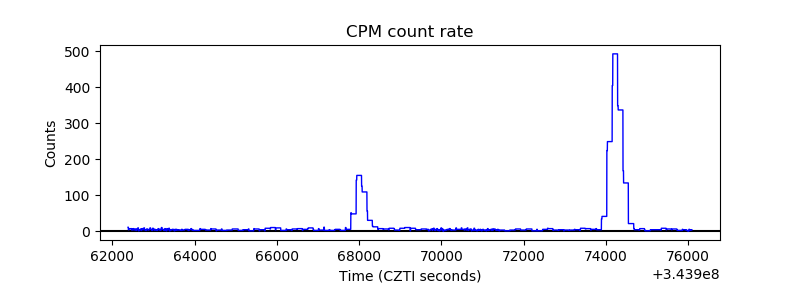 |
| CZT Counter | 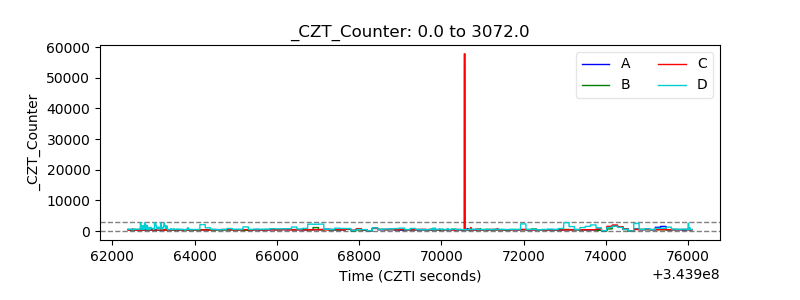 |
| +2.5 Volts monitor |  |
| +5 Volts monitor |  |
| _ROLL_ROT | 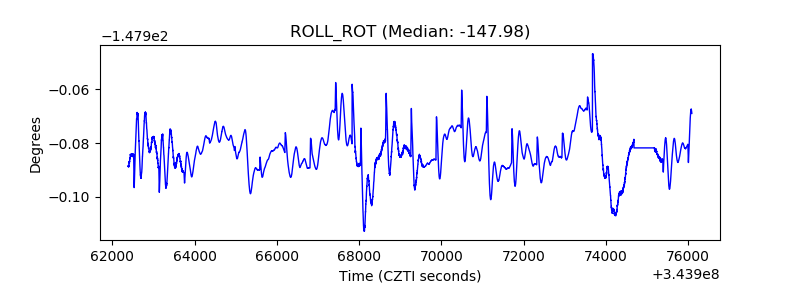 |
| _Roll_DEC | 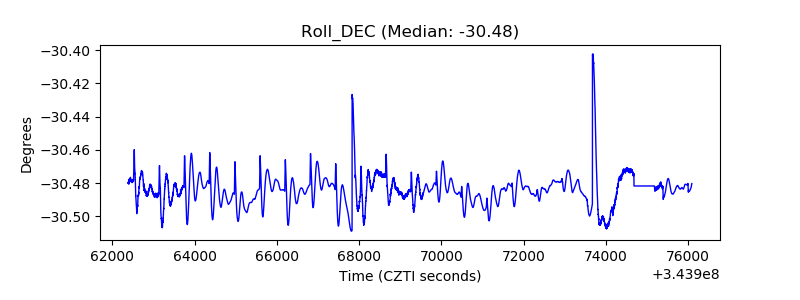 |
| _Roll_RA | 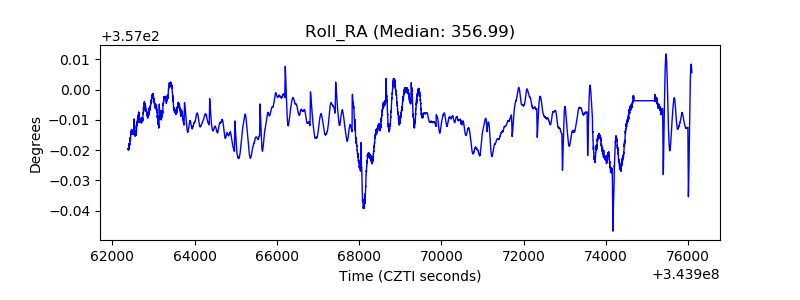 |
| Veto Counter | 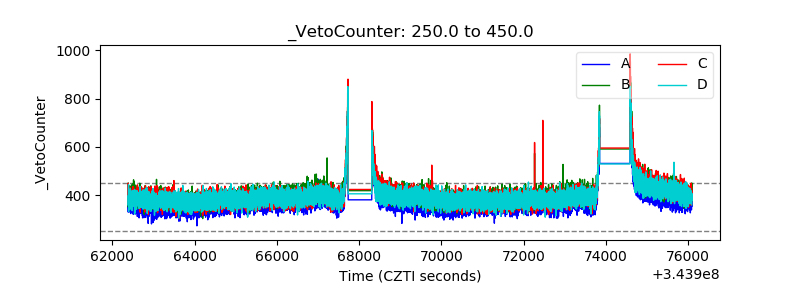 |