| Param | Original file | Final file |
|---|---|---|
| Filename | modeM0/AS1A10_048T06_9000004030_27902cztM0_level2.evt | modeM0/AS1A10_048T06_9000004030_27902cztM0_level2_quad_clean.evt |
| Size (bytes) | 590,869,440 | 69,007,680 |
| Size | 563.5 MB | 65.8 MB |
| Events in quadrant A | 3,495,708 | 421,911 |
| Events in quadrant B | 3,404,502 | 426,587 |
| Events in quadrant C | 3,352,828 | 407,242 |
| Events in quadrant D | 7,180,757 | 359,691 |
| Mode M0 | |||
|---|---|---|---|
| Quadrant | BADHDUFLAG | Total packets | Discarded packets |
| A | 0 | 14695 | 0 |
| B | 0 | 14207 | 0 |
| C | 0 | 14192 | 0 |
| D | 0 | 25905 | 0 |
| Mode M9 | |||
|---|---|---|---|
| Quadrant | BADHDUFLAG | Total packets | Discarded packets |
| A | 0 | 10 | 0 |
| B | 0 | 11 | 0 |
| C | 0 | 11 | 0 |
| D | 0 | 11 | 0 |
| Quadrant | Total seconds | Saturated seconds | Saturation percentage |
|---|---|---|---|
| A | 6796 | 96 | 1.412596% |
| B | 6796 | 103 | 1.515597% |
| C | 6796 | 143 | 2.104179% |
| D | 6796 | 1329 | 19.555621% |
Noise dominated data is calculated using 1-second bins in cleaned event files. If a bin has >2000 counts, and if more than 50% of those come from <1% of pixels, then it is considered to be noise-dominated and hence unusable.
| Quadrant | # 1 sec bins | Bins with >0 counts | Bins with >2000 counts | High rate bins dominated by noise | Noise dominated (total time) | Noise dominated (detector-on time) | Marked lightcurve |
|---|---|---|---|---|---|---|---|
| A | 7696 | 6796 | 0 | 0 | 0.00% | 0.00% |  |
| B | 7696 | 6796 | 0 | 0 | 0.00% | 0.00% | 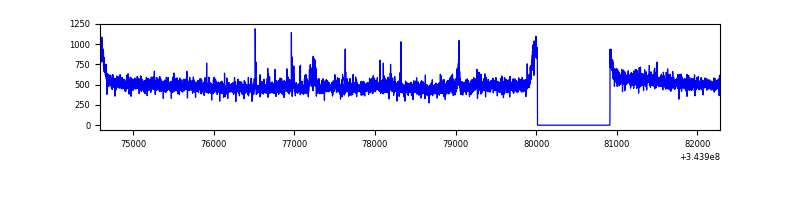 |
| C | 7696 | 6796 | 0 | 0 | 0.00% | 0.00% | 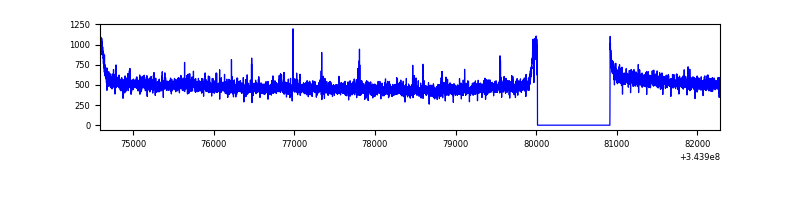 |
| D | 7696 | 6796 | 1144 | 1144 | 14.86% | 16.83% | 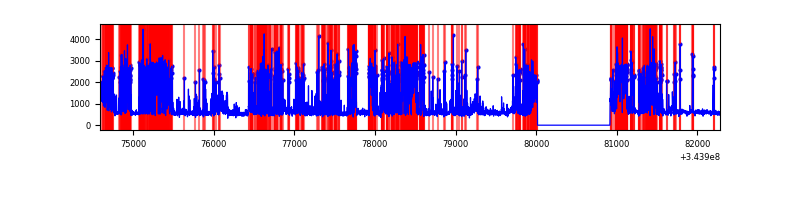 |
Top three noisy pixels from each quadrant. If the there are fewer than three noisy pixels in the level2.evt file, extra rows are filled as -1
| Pixel properties | Quadrant properties | ||||||
|---|---|---|---|---|---|---|---|
| Quadrant | DetID | PixID | Counts | Sigma | Mean | Median | Sigma |
| A | 6 | 16 | 226123 | 1323.9 | 846 | 830 | 170.2 |
| A | 13 | 254 | 10567 | 57.22 | 846 | 830 | 170.2 |
| A | 8 | 192 | 8310 | 43.95 | 846 | 830 | 170.2 |
| B | 10 | 246 | 22823 | 134.72 | 843 | 818 | 163.3 |
| B | 12 | 111 | 20175 | 118.51 | 843 | 818 | 163.3 |
| B | 11 | 111 | 18557 | 108.6 | 843 | 818 | 163.3 |
| C | 14 | 238 | 137348 | 715.23 | 812 | 817 | 190.9 |
| C | 3 | 233 | 35438 | 181.37 | 812 | 817 | 190.9 |
| C | 14 | 94 | 10187 | 49.09 | 812 | 817 | 190.9 |
| D | 1 | 52 | 3528986 | 20290.53 | 727 | 708 | 173.9 |
| D | 8 | 195 | 767620 | 4410.38 | 727 | 708 | 173.9 |
| D | 2 | 250 | 47213 | 267.44 | 727 | 708 | 173.9 |
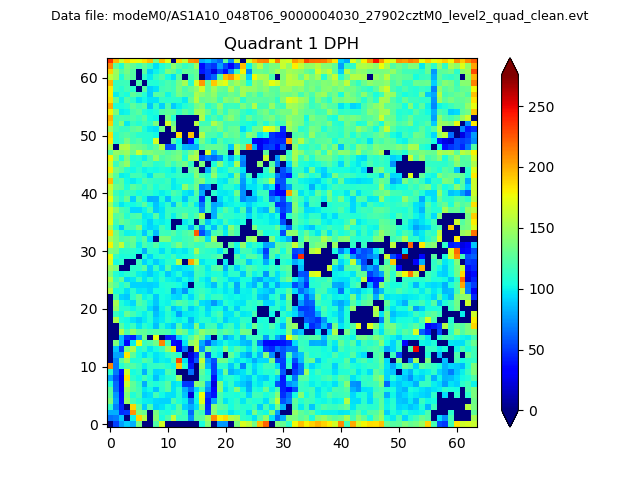
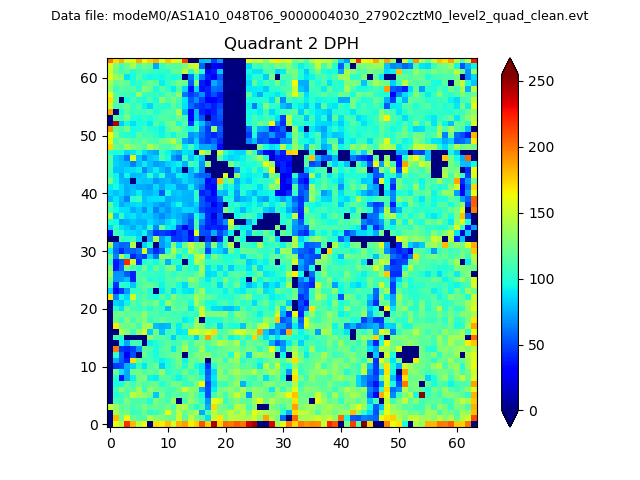
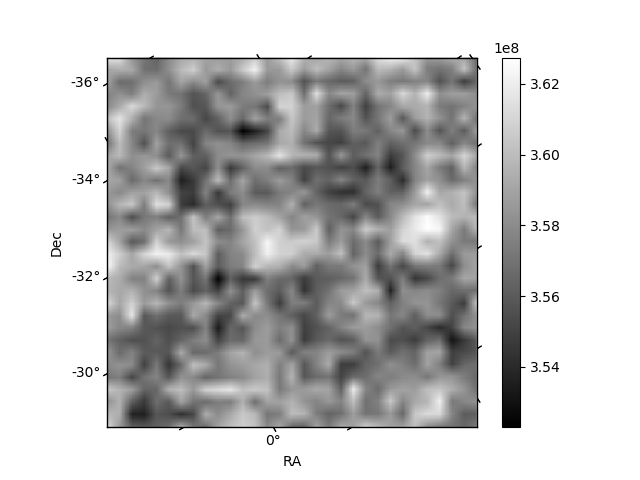
Histogram calculated using DETX and DETY for each event in the final _common_clean file
| Quadrant A | 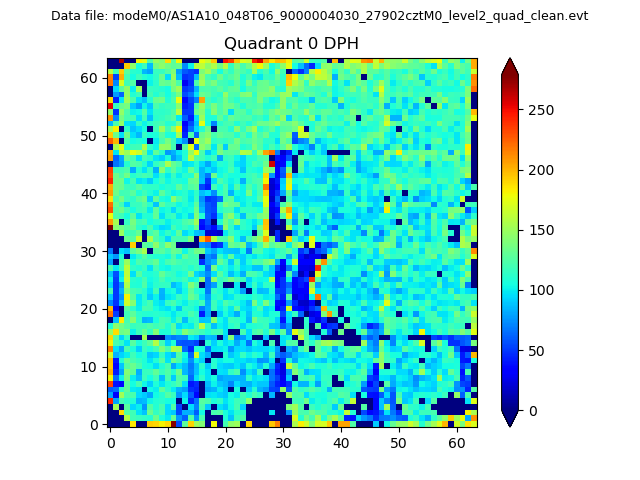 |
 |
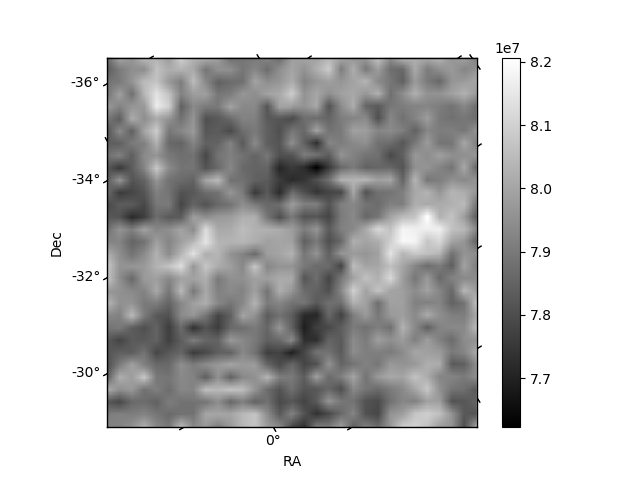
Quadrant B |
|---|---|---|---|
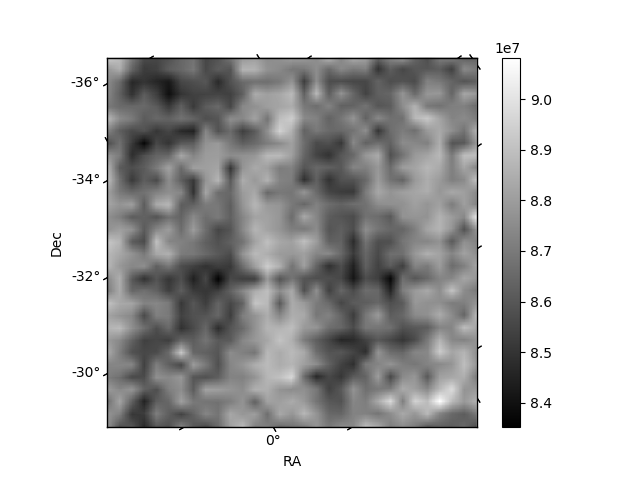
| Quadrant D | 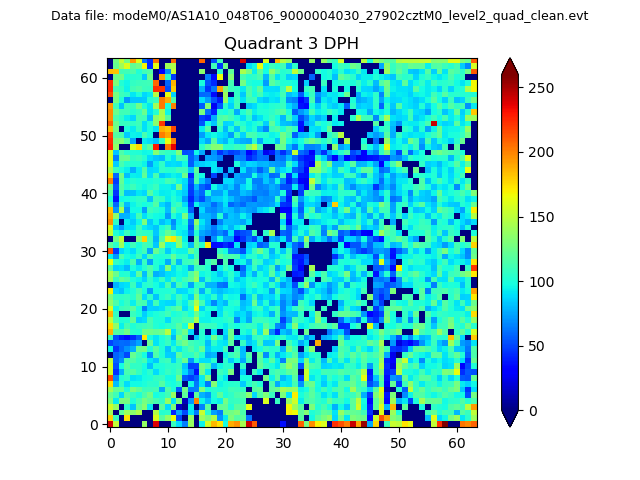 |
 |
Quadrant C |
| Plot type | Count rate plots | Images |
|---|---|---|
| Comparison with Poisson distribution Blue bars denote a histogram of data divided into 1 sec bins. Red curve is a Poisson curve with rate = median count rate of data. |
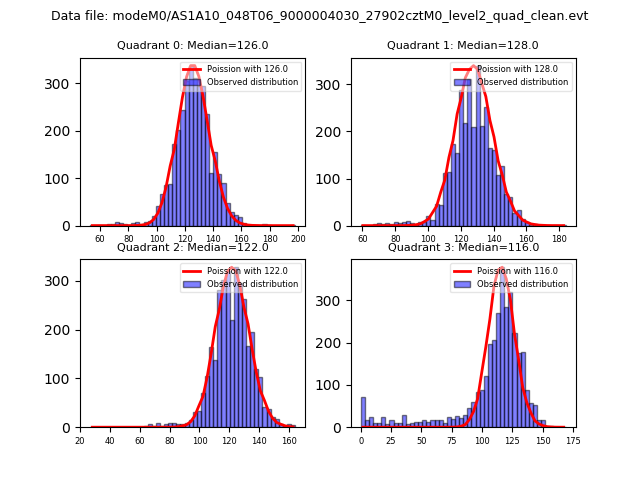 |
 |
| Quadrant-wise count rates Data is divided into 100 sec bins |
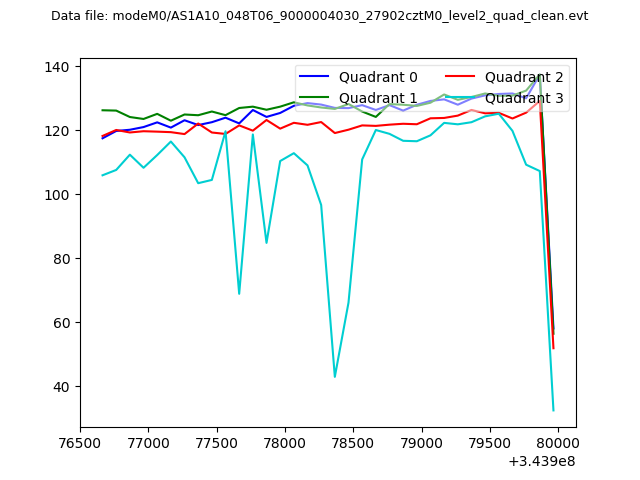 |
|
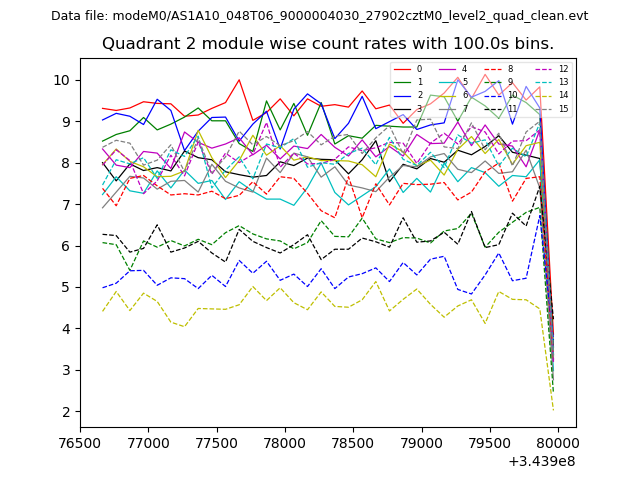
| Module-wise count rates for Quadrant A Data is divided into 100 sec bins |
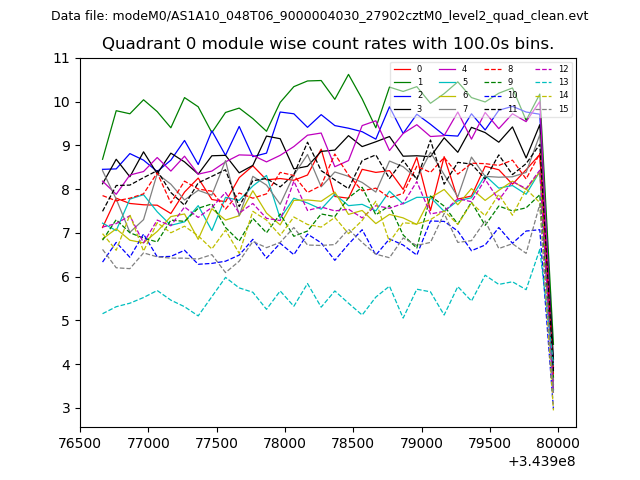 |
 |
| Module-wise count rates for Quadrant B Data is divided into 100 sec bins |
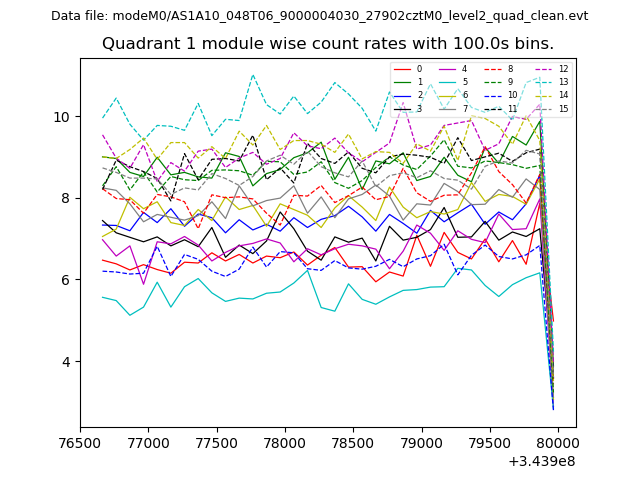 |
 |
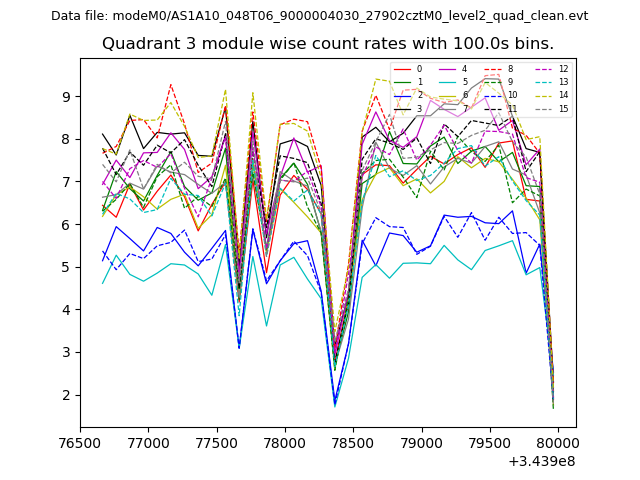
| Module-wise count rates for Quadrant C Data is divided into 100 sec bins |
 |
 |
| Module-wise count rates for Quadrant D Data is divided into 100 sec bins |
 |
 |
| Parameter | Plot |
|---|---|
| CZT HV Monitor | 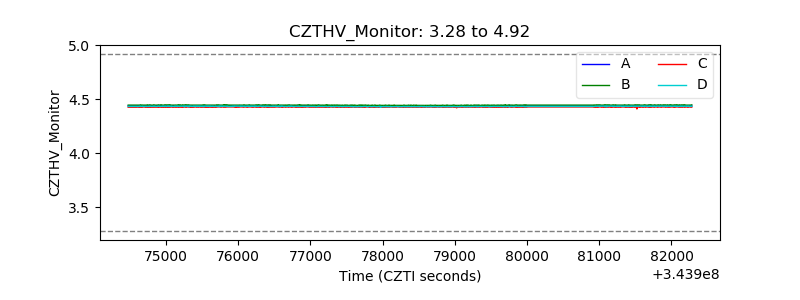 |
| D_VDD |  |
| Temperature 1 | 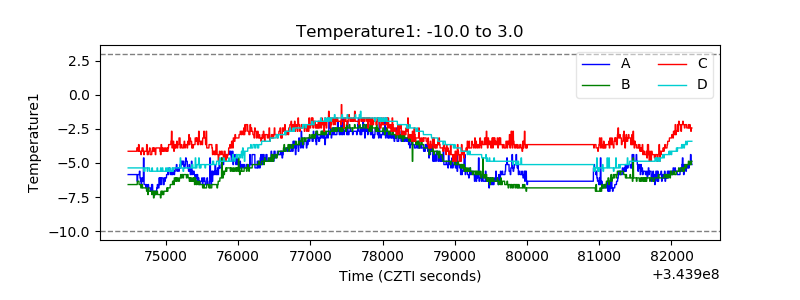 |
| Veto HV Monitor | 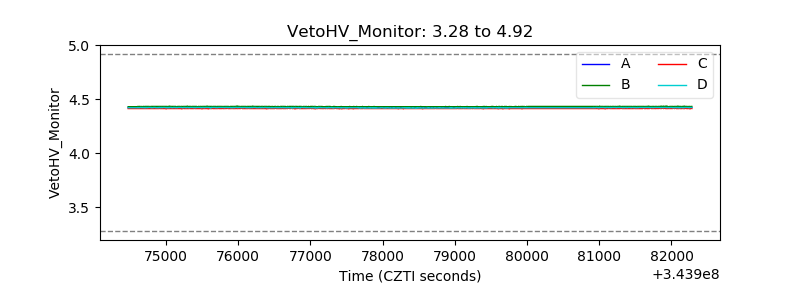 |
| Veto LLD | 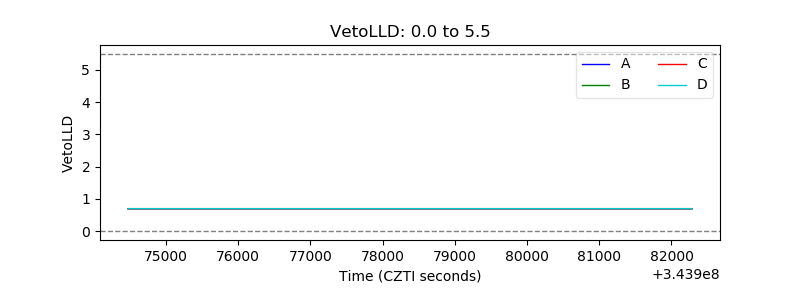 |
| Alpha Counter | 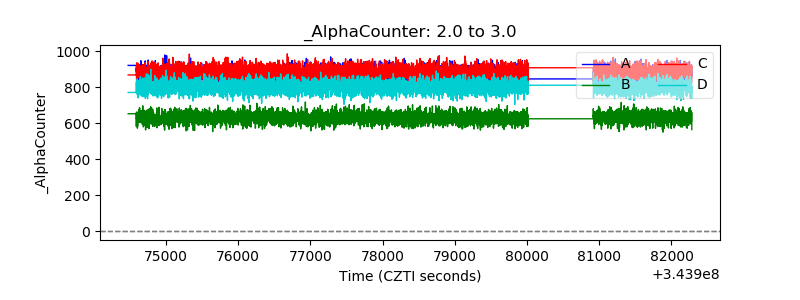 |
| _CPM_Rate | 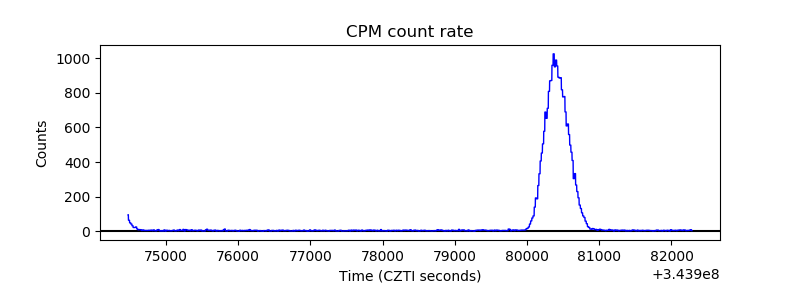 |
| CZT Counter | 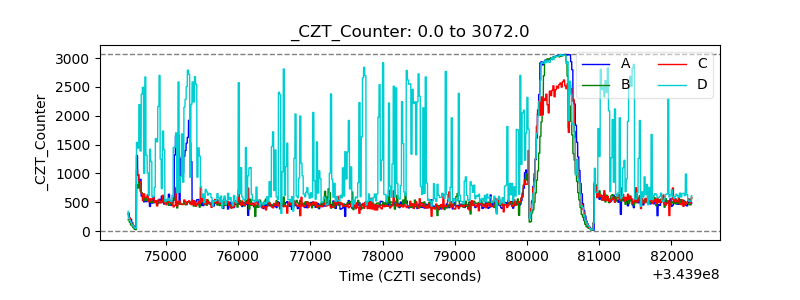 |
| +2.5 Volts monitor |  |
| +5 Volts monitor |  |
| _ROLL_ROT | 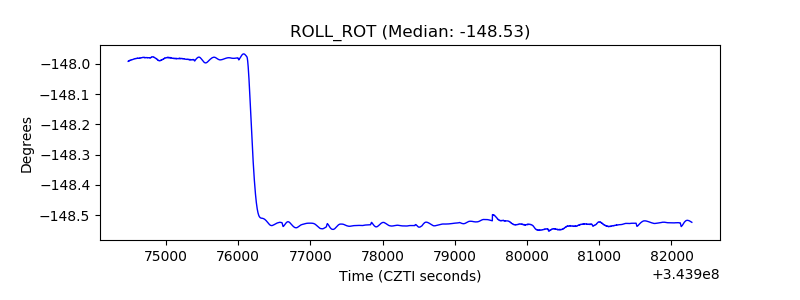 |
| _Roll_DEC | 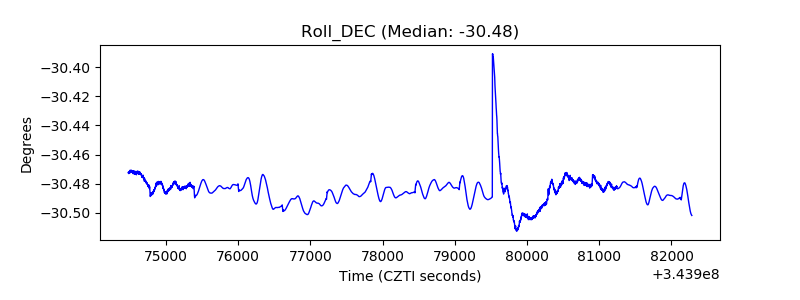 |
| _Roll_RA | 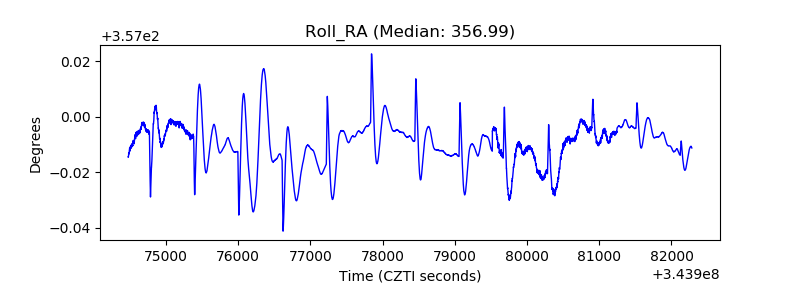 |
| Veto Counter | 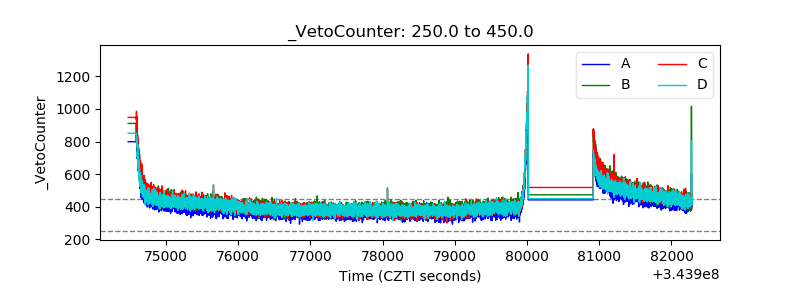 |