| Param | Original file | Final file |
|---|---|---|
| Filename | modeM0/AS1A10_048T06_9000004030_27905cztM0_level2.evt | modeM0/AS1A10_048T06_9000004030_27905cztM0_level2_quad_clean.evt |
| Size (bytes) | 1,338,958,080 | 229,968,000 |
| Size | 1.2 GB | 219.3 MB |
| Events in quadrant A | 7,956,935 | 1,513,258 |
| Events in quadrant B | 8,800,981 | 1,530,487 |
| Events in quadrant C | 8,100,842 | 1,453,721 |
| Events in quadrant D | 14,604,068 | 1,355,735 |
| Mode M0 | |||
|---|---|---|---|
| Quadrant | BADHDUFLAG | Total packets | Discarded packets |
| A | 0 | 34178 | 0 |
| B | 0 | 36507 | 0 |
| C | 0 | 34592 | 0 |
| D | 0 | 55076 | 0 |
| Mode M9 | |||
|---|---|---|---|
| Quadrant | BADHDUFLAG | Total packets | Discarded packets |
| A | 0 | 31 | 0 |
| B | 0 | 31 | 0 |
| C | 0 | 31 | 0 |
| D | 0 | 31 | 0 |
| Quadrant | Total seconds | Saturated seconds | Saturation percentage |
|---|---|---|---|
| A | 16117 | 161 | 0.998945% |
| B | 16118 | 219 | 1.358729% |
| C | 16118 | 291 | 1.805435% |
| D | 16118 | 1701 | 10.553419% |
Noise dominated data is calculated using 1-second bins in cleaned event files. If a bin has >2000 counts, and if more than 50% of those come from <1% of pixels, then it is considered to be noise-dominated and hence unusable.
| Quadrant | # 1 sec bins | Bins with >0 counts | Bins with >2000 counts | High rate bins dominated by noise | Noise dominated (total time) | Noise dominated (detector-on time) | Marked lightcurve |
|---|---|---|---|---|---|---|---|
| A | 19263 | 16118 | 0 | 0 | 0.00% | 0.00% | 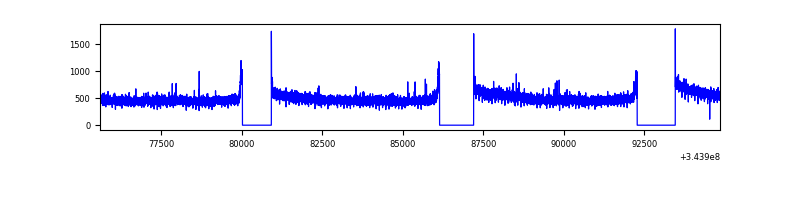 |
| B | 19264 | 16119 | 12 | 12 | 0.06% | 0.07% | 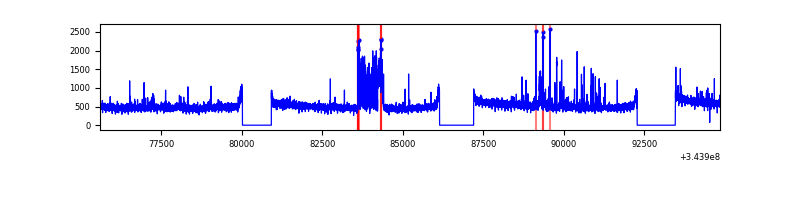 |
| C | 19264 | 16119 | 0 | 0 | 0.00% | 0.00% | 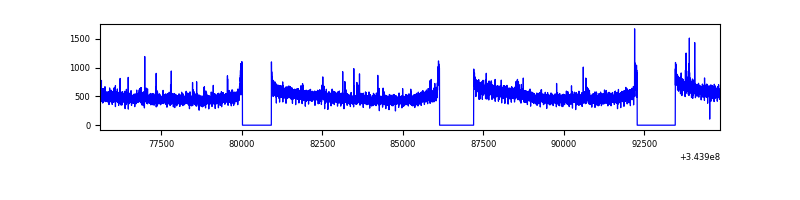 |
| D | 19264 | 16119 | 1474 | 1474 | 7.65% | 9.14% | 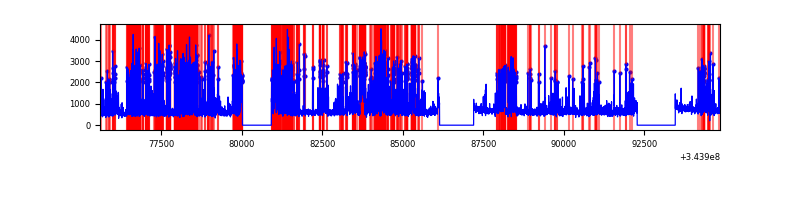 |
Top three noisy pixels from each quadrant. If the there are fewer than three noisy pixels in the level2.evt file, extra rows are filled as -1
| Pixel properties | Quadrant properties | ||||||
|---|---|---|---|---|---|---|---|
| Quadrant | DetID | PixID | Counts | Sigma | Mean | Median | Sigma |
| A | 13 | 254 | 24845 | 55.95 | 2058 | 2020 | 407.9 |
| A | 3 | 137 | 19597 | 43.09 | 2058 | 2020 | 407.9 |
| A | 0 | 226 | 17621 | 38.24 | 2058 | 2020 | 407.9 |
| B | 15 | 32 | 482928 | 1247.33 | 2038 | 1992 | 385.6 |
| B | 0 | 229 | 92750 | 235.38 | 2038 | 1992 | 385.6 |
| B | 0 | 230 | 92015 | 233.48 | 2038 | 1992 | 385.6 |
| C | 14 | 238 | 325398 | 715.92 | 1947 | 1960 | 451.8 |
| C | 3 | 233 | 146687 | 320.35 | 1947 | 1960 | 451.8 |
| C | 2 | 16 | 22489 | 45.44 | 1947 | 1960 | 451.8 |
| D | 1 | 52 | 4948370 | 11084.58 | 1883 | 1838 | 446.3 |
| D | 8 | 195 | 2200624 | 4927.21 | 1883 | 1838 | 446.3 |
| D | 2 | 250 | 221717 | 492.72 | 1883 | 1838 | 446.3 |
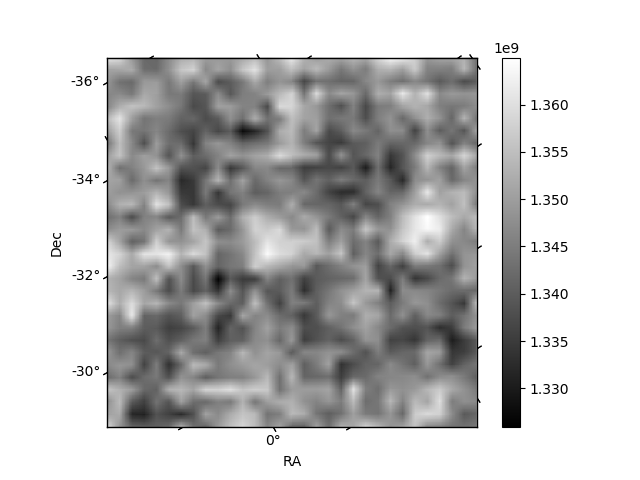
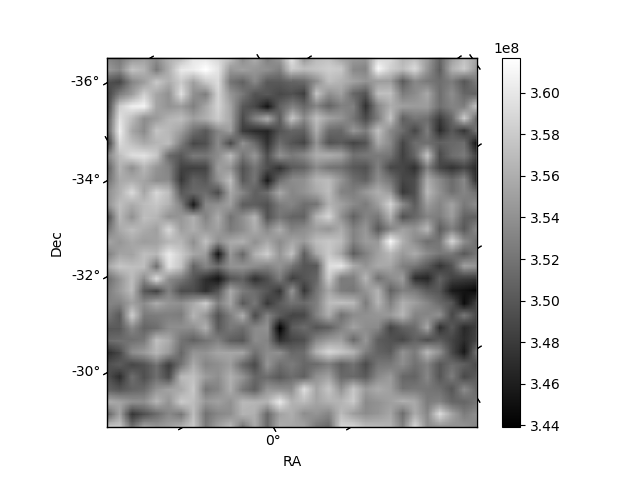
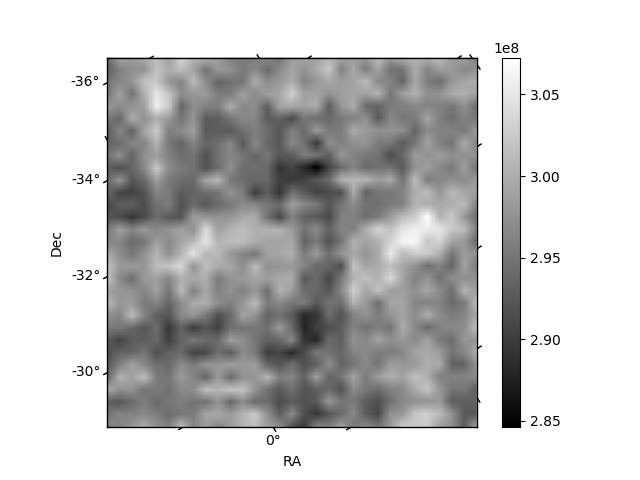
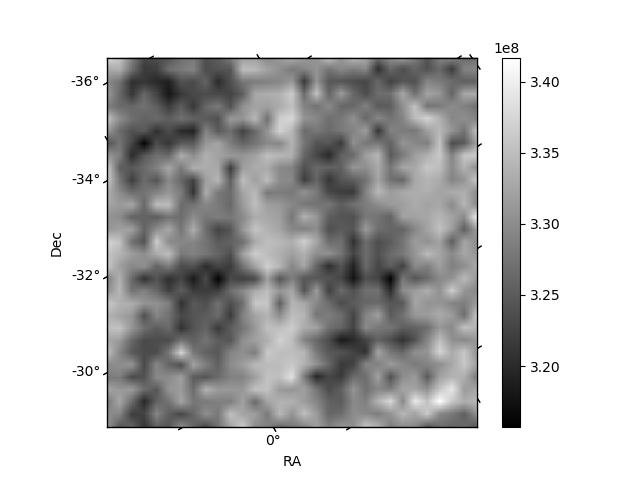
Histogram calculated using DETX and DETY for each event in the final _common_clean file
| Quadrant A | 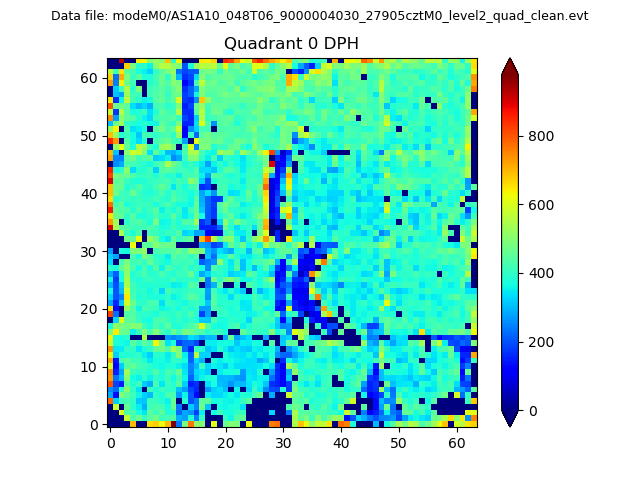 |
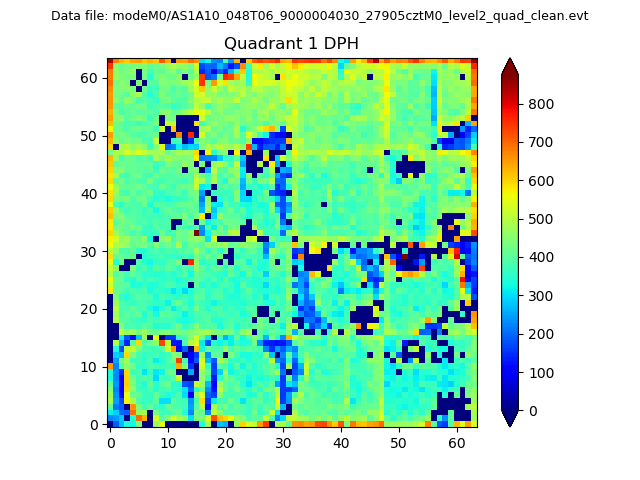 |
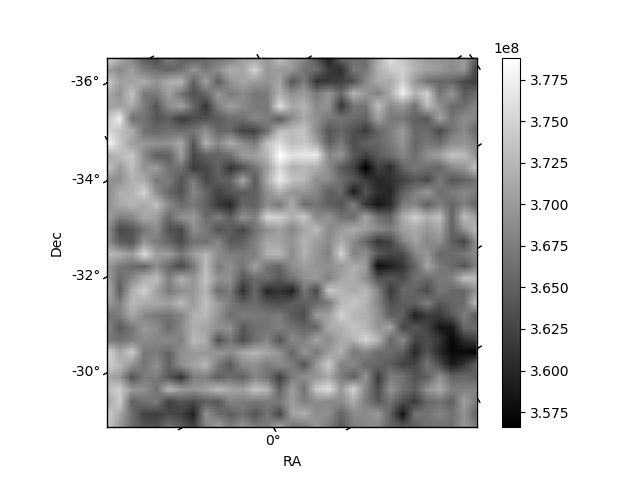
Quadrant B |
|---|---|---|---|
| Quadrant D | 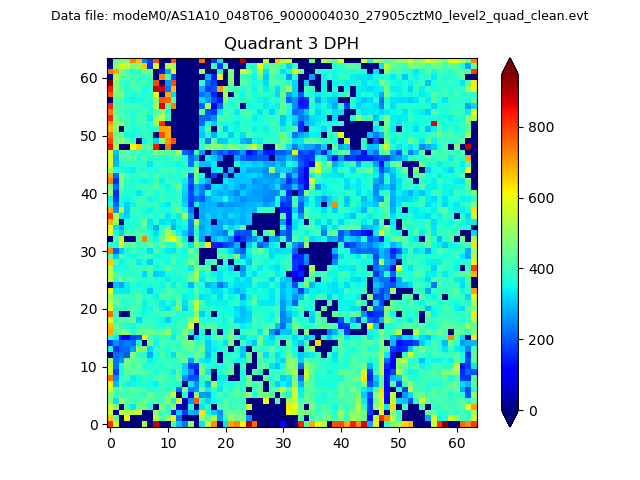 |
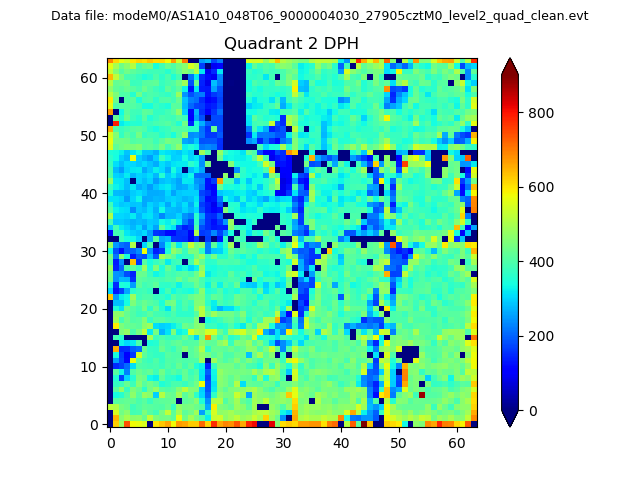 |
Quadrant C |
| Plot type | Count rate plots | Images |
|---|---|---|
| Comparison with Poisson distribution Blue bars denote a histogram of data divided into 1 sec bins. Red curve is a Poisson curve with rate = median count rate of data. |
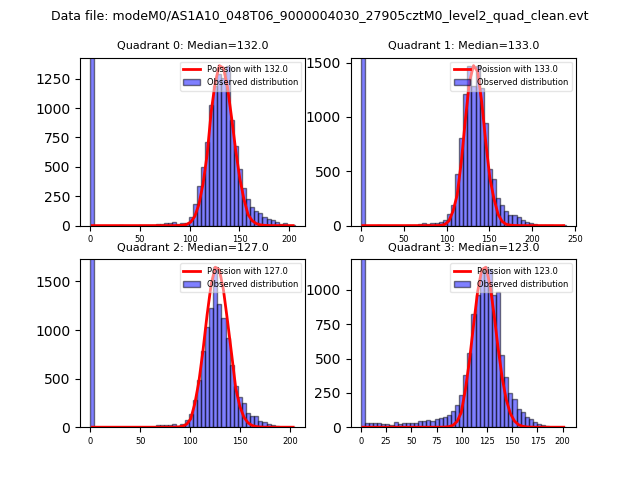 |
 |
| Quadrant-wise count rates Data is divided into 100 sec bins |
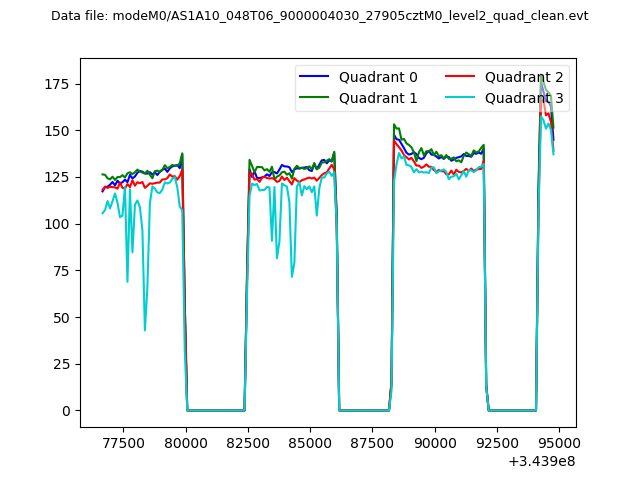 |
|
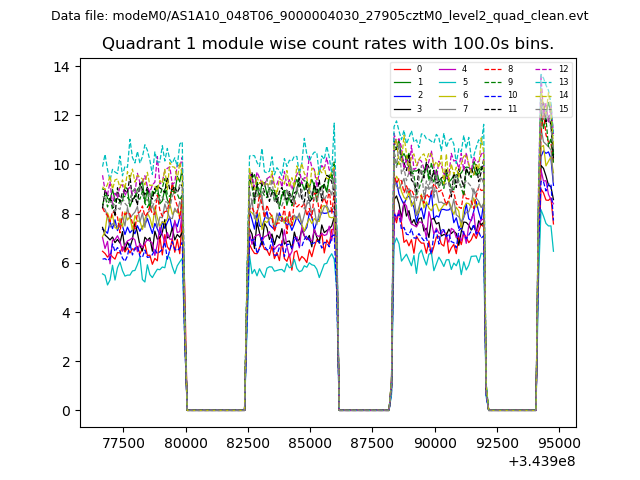
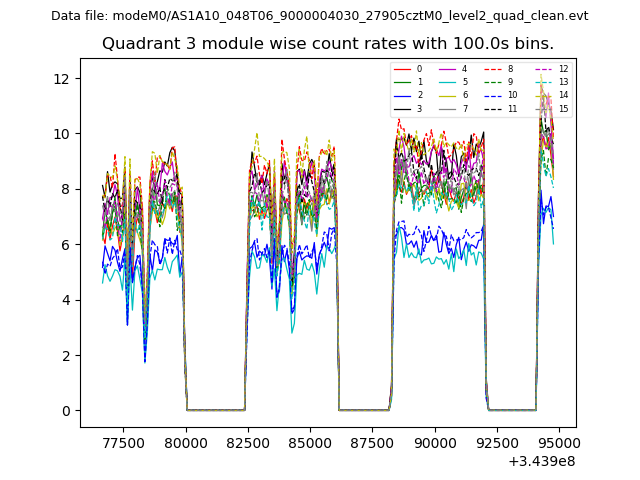
| Module-wise count rates for Quadrant A Data is divided into 100 sec bins |
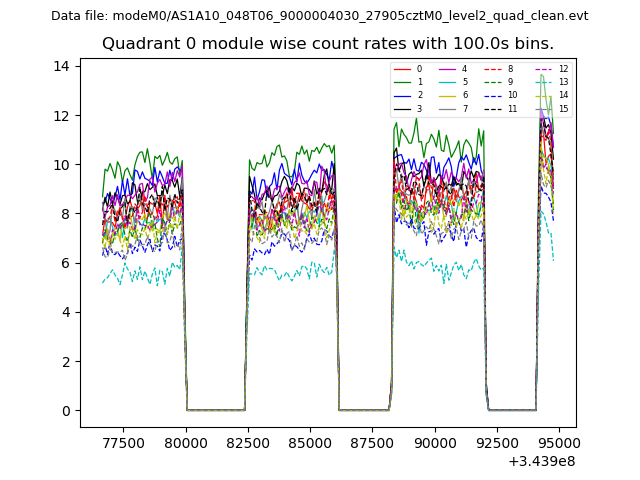 |
 |
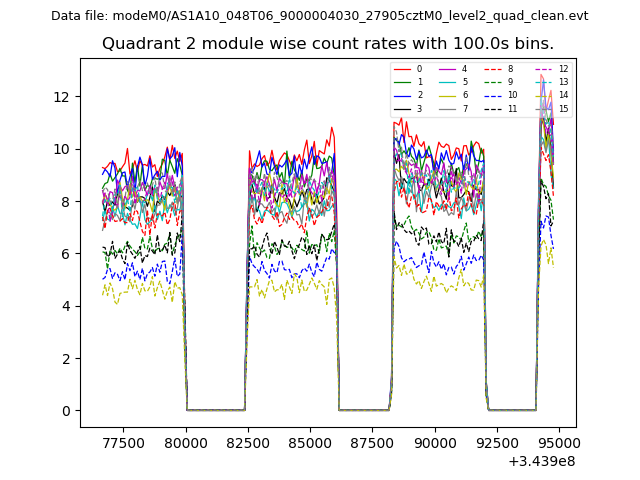
| Module-wise count rates for Quadrant B Data is divided into 100 sec bins |
 |
 |
| Module-wise count rates for Quadrant C Data is divided into 100 sec bins |
 |
 |
| Module-wise count rates for Quadrant D Data is divided into 100 sec bins |
 |
 |
| Parameter | Plot |
|---|---|
| CZT HV Monitor |  |
| D_VDD | 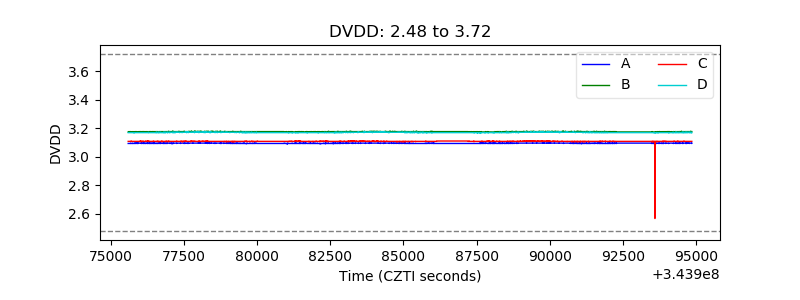 |
| Temperature 1 | 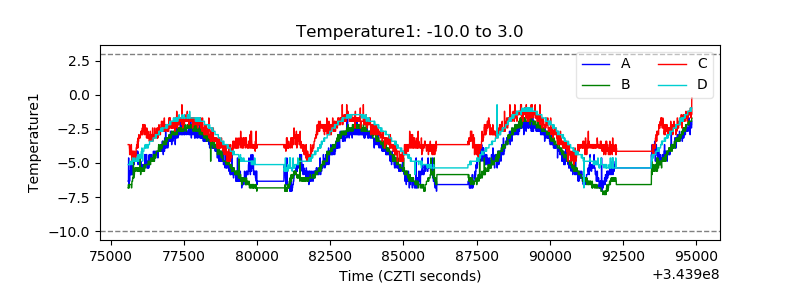 |
| Veto HV Monitor | 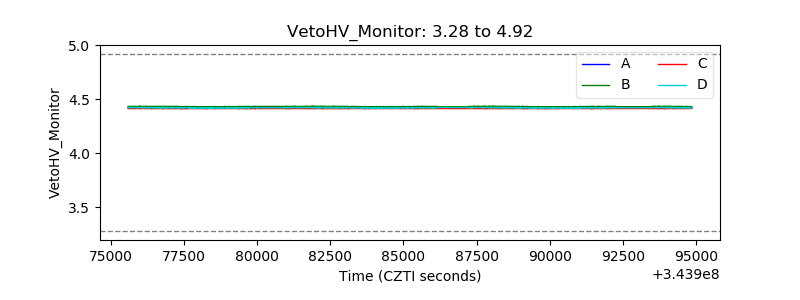 |
| Veto LLD | 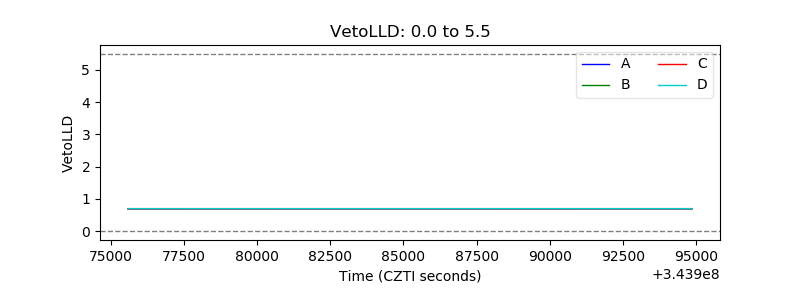 |
| Alpha Counter | 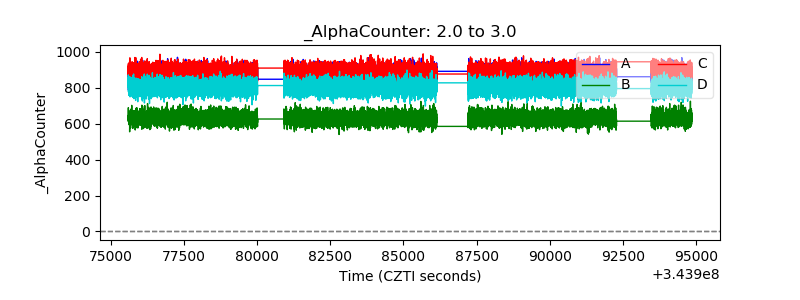 |
| _CPM_Rate | 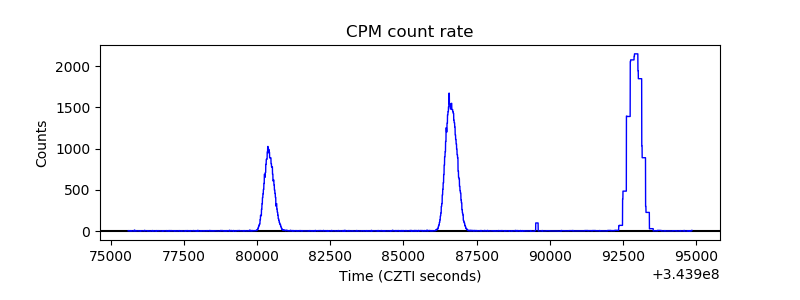 |
| CZT Counter | 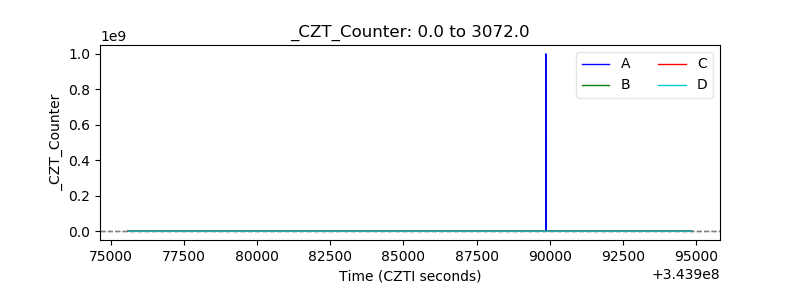 |
| +2.5 Volts monitor | 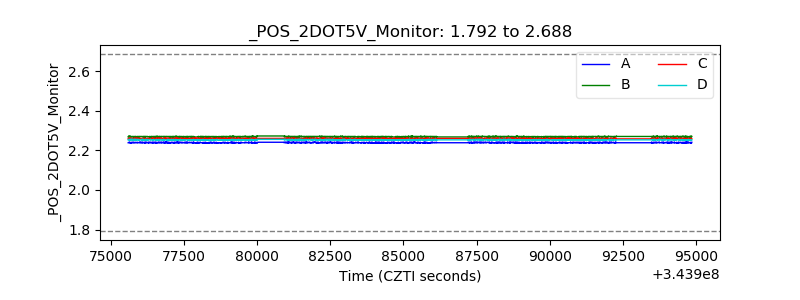 |
| +5 Volts monitor | 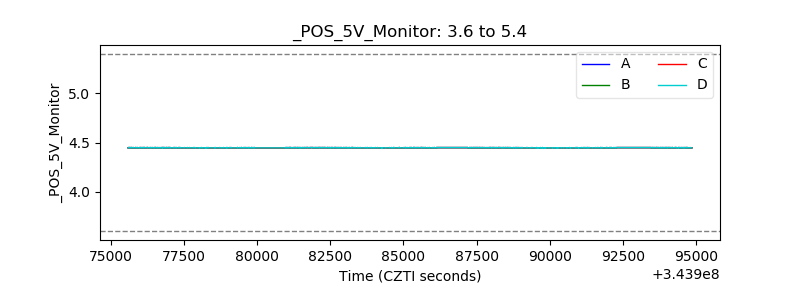 |
| _ROLL_ROT | 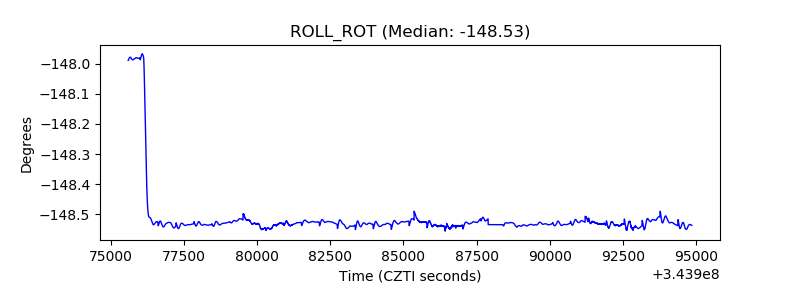 |
| _Roll_DEC | 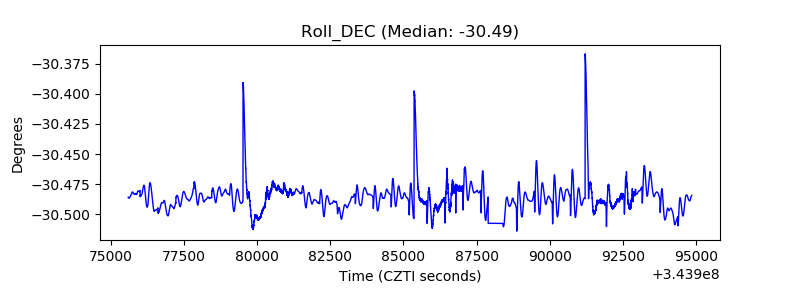 |
| _Roll_RA | 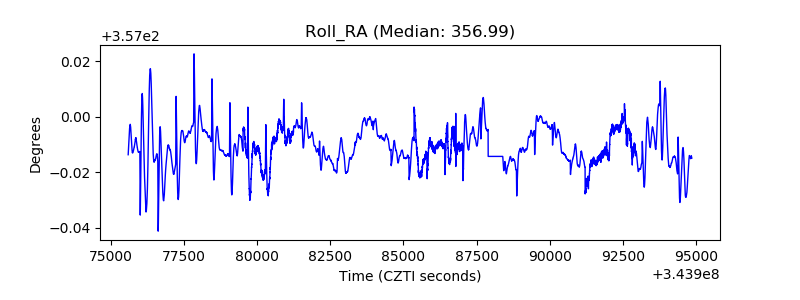 |
| Veto Counter | 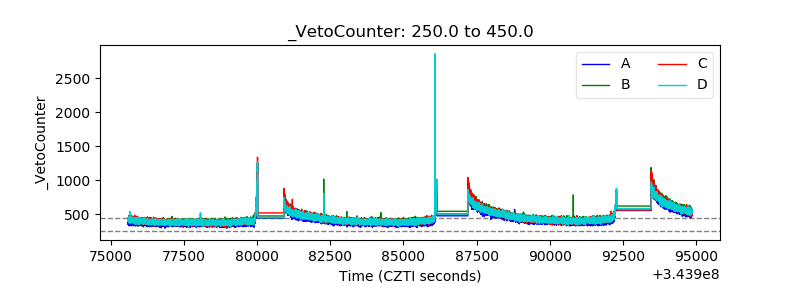 |