| Param | Original file | Final file |
|---|---|---|
| Filename | modeM0/AS1A10_048T06_9000004030_27906cztM0_level2.evt | modeM0/AS1A10_048T06_9000004030_27906cztM0_level2_quad_clean.evt |
| Size (bytes) | 536,515,200 | 108,106,560 |
| Size | 511.7 MB | 103.1 MB |
| Events in quadrant A | 3,488,367 | 735,408 |
| Events in quadrant B | 3,732,114 | 740,409 |
| Events in quadrant C | 3,527,073 | 692,385 |
| Events in quadrant D | 5,074,518 | 666,751 |
| Mode M0 | |||
|---|---|---|---|
| Quadrant | BADHDUFLAG | Total packets | Discarded packets |
| A | 0 | 14567 | 0 |
| B | 0 | 15424 | 0 |
| C | 0 | 14606 | 0 |
| D | 0 | 19802 | 0 |
| Mode M9 | |||
|---|---|---|---|
| Quadrant | BADHDUFLAG | Total packets | Discarded packets |
| A | 0 | 19 | 0 |
| B | 0 | 20 | 0 |
| C | 0 | 20 | 0 |
| D | 0 | 20 | 0 |
| Quadrant | Total seconds | Saturated seconds | Saturation percentage |
|---|---|---|---|
| A | 6294 | 98 | 1.557038% |
| B | 6294 | 130 | 2.065459% |
| C | 6293 | 156 | 2.478945% |
| D | 6293 | 263 | 4.179247% |
Noise dominated data is calculated using 1-second bins in cleaned event files. If a bin has >2000 counts, and if more than 50% of those come from <1% of pixels, then it is considered to be noise-dominated and hence unusable.
| Quadrant | # 1 sec bins | Bins with >0 counts | Bins with >2000 counts | High rate bins dominated by noise | Noise dominated (total time) | Noise dominated (detector-on time) | Marked lightcurve |
|---|---|---|---|---|---|---|---|
| A | 7540 | 6295 | 0 | 0 | 0.00% | 0.00% | 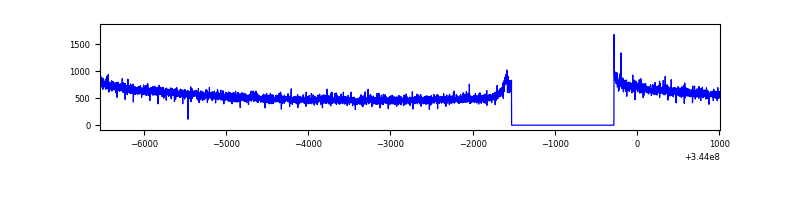 |
| B | 7540 | 6295 | 8 | 8 | 0.11% | 0.13% | 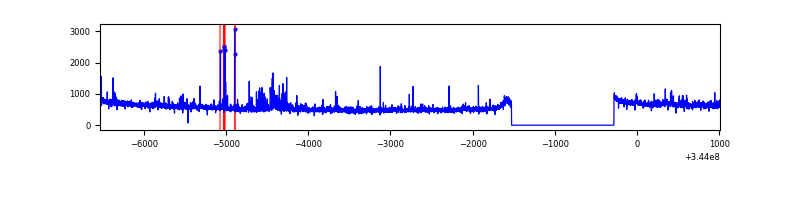 |
| C | 7539 | 6294 | 0 | 0 | 0.00% | 0.00% | 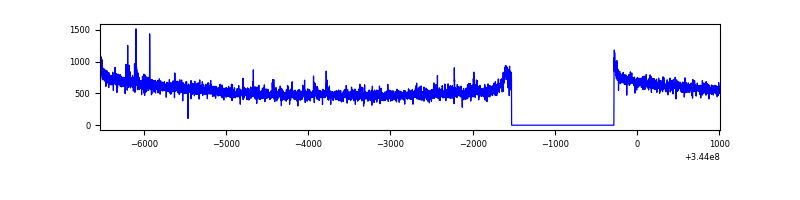 |
| D | 7539 | 6294 | 184 | 184 | 2.44% | 2.92% | 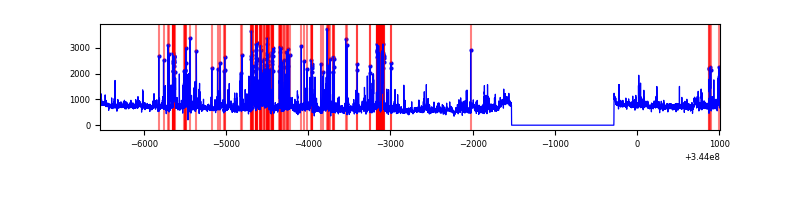 |
Top three noisy pixels from each quadrant. If the there are fewer than three noisy pixels in the level2.evt file, extra rows are filled as -1
| Pixel properties | Quadrant properties | ||||||
|---|---|---|---|---|---|---|---|
| Quadrant | DetID | PixID | Counts | Sigma | Mean | Median | Sigma |
| A | 13 | 254 | 10294 | 52.77 | 903 | 889 | 178.2 |
| A | 8 | 192 | 7934 | 39.53 | 903 | 889 | 178.2 |
| A | 3 | 137 | 7886 | 39.26 | 903 | 889 | 178.2 |
| B | 0 | 230 | 86056 | 513.16 | 889 | 870 | 166.0 |
| B | 0 | 229 | 70947 | 422.14 | 889 | 870 | 166.0 |
| B | 10 | 245 | 40933 | 241.34 | 889 | 870 | 166.0 |
| C | 14 | 238 | 137228 | 707.93 | 839 | 845 | 192.7 |
| C | 3 | 233 | 83458 | 428.82 | 839 | 845 | 192.7 |
| C | 2 | 16 | 19501 | 96.84 | 839 | 845 | 192.7 |
| D | 8 | 195 | 816941 | 4083.63 | 850 | 829 | 199.8 |
| D | 1 | 52 | 776799 | 3882.77 | 850 | 829 | 199.8 |
| D | 2 | 250 | 147322 | 733.02 | 850 | 829 | 199.8 |
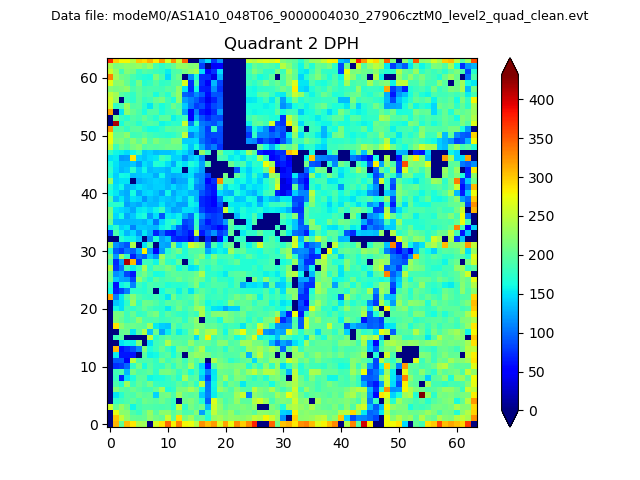
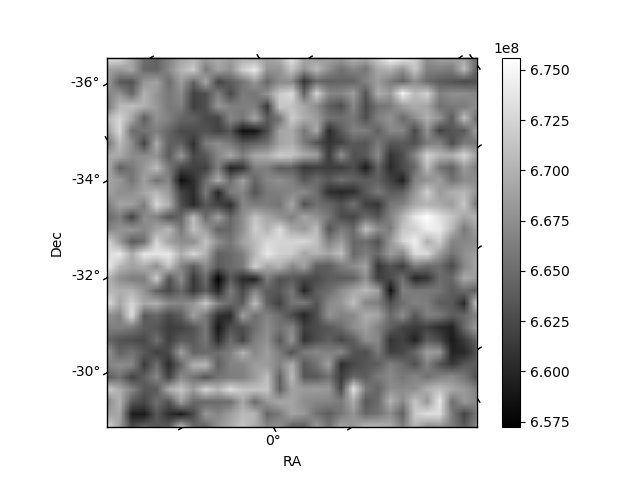
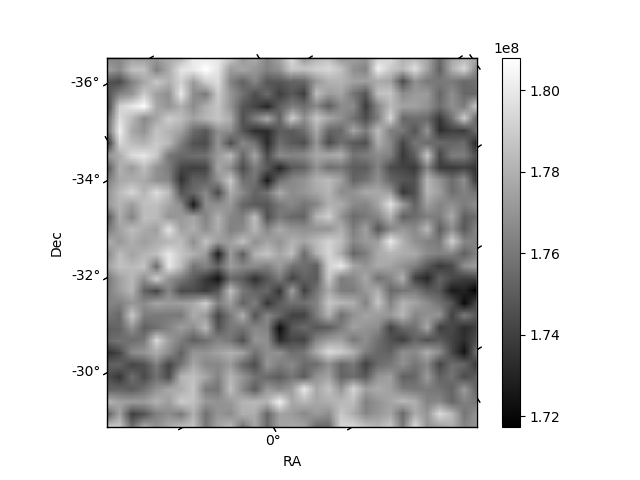
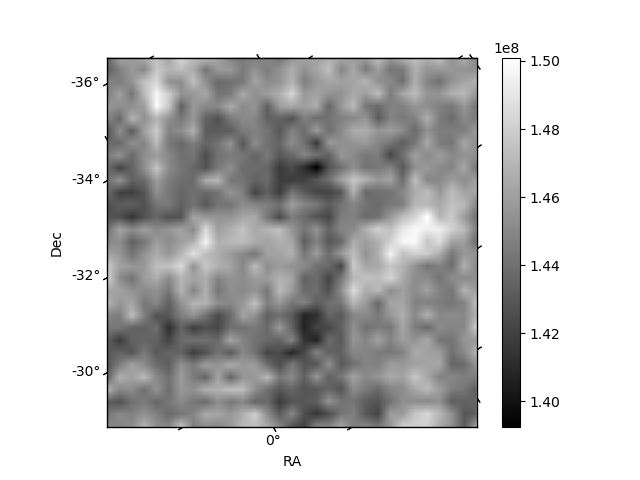
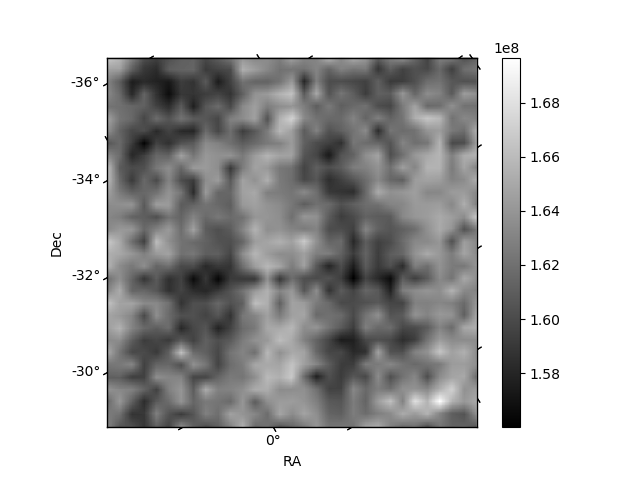
Histogram calculated using DETX and DETY for each event in the final _common_clean file
| Quadrant A | 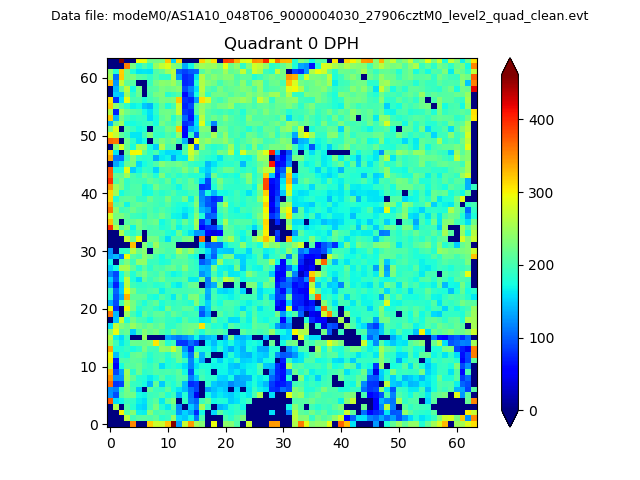 |
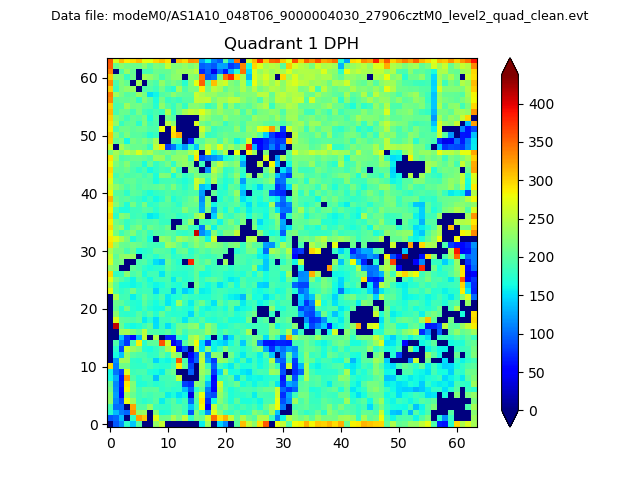 |
Quadrant B |
|---|---|---|---|
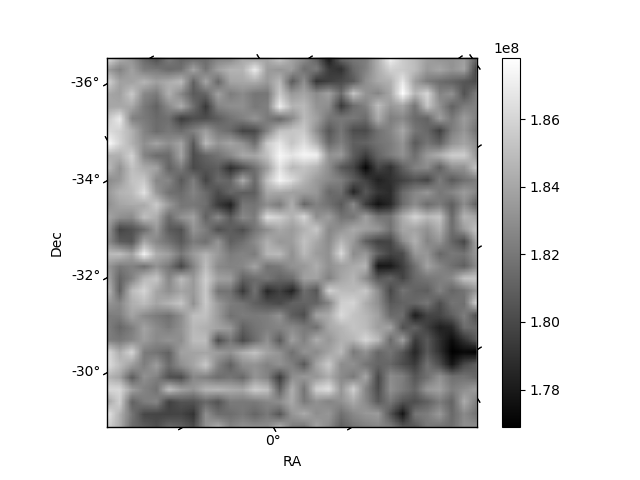
| Quadrant D | 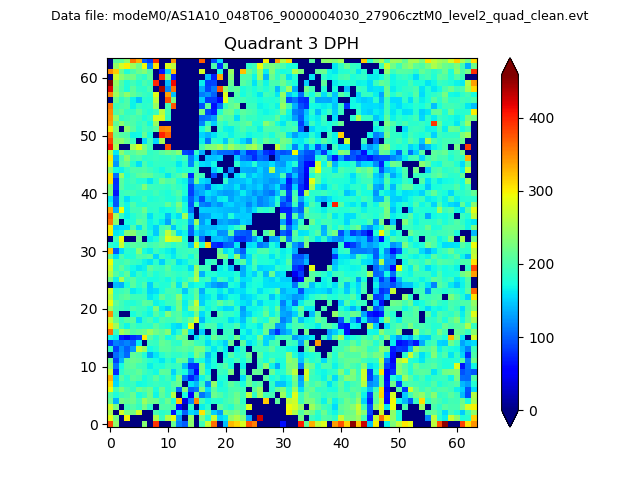 |
 |
Quadrant C |
| Plot type | Count rate plots | Images |
|---|---|---|
| Comparison with Poisson distribution Blue bars denote a histogram of data divided into 1 sec bins. Red curve is a Poisson curve with rate = median count rate of data. |
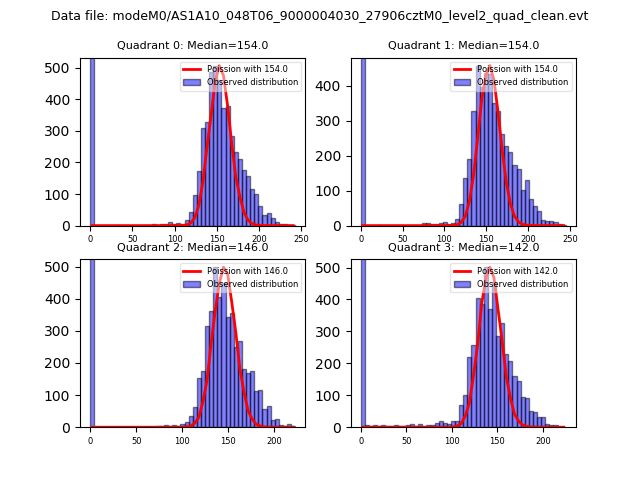 |
 |
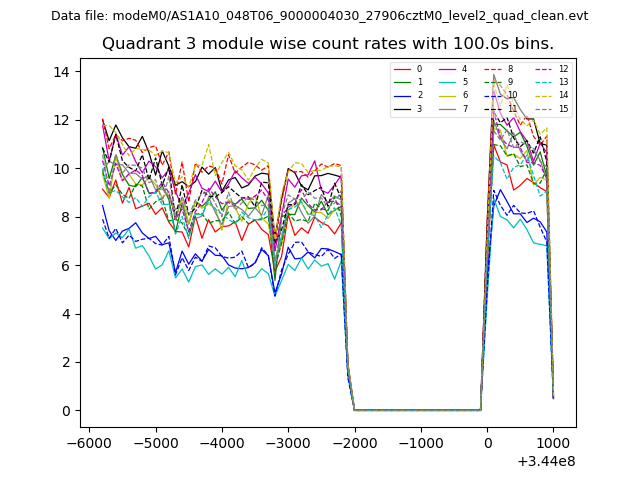
| Quadrant-wise count rates Data is divided into 100 sec bins |
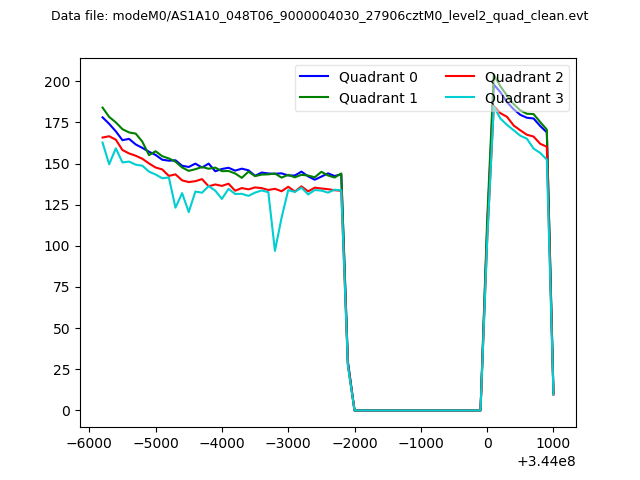 |
|
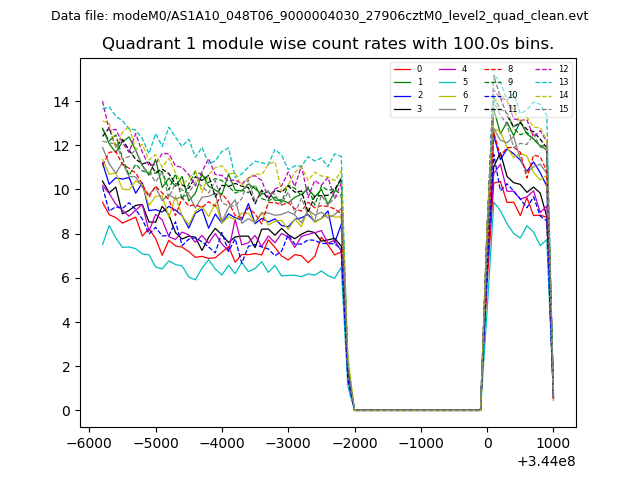
| Module-wise count rates for Quadrant A Data is divided into 100 sec bins |
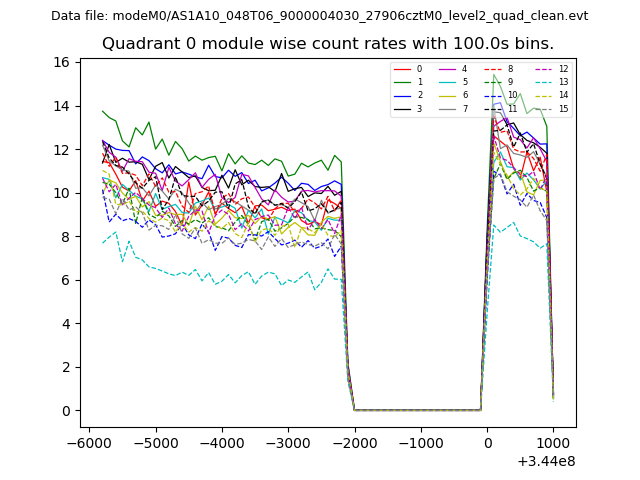 |
 |
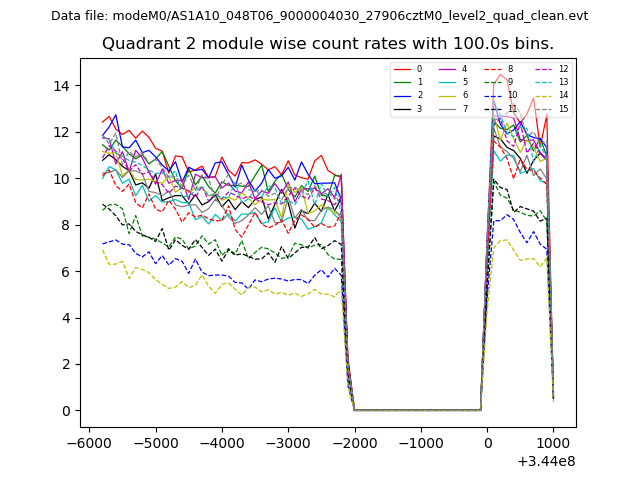
| Module-wise count rates for Quadrant B Data is divided into 100 sec bins |
 |
 |
| Module-wise count rates for Quadrant C Data is divided into 100 sec bins |
 |
 |
| Module-wise count rates for Quadrant D Data is divided into 100 sec bins |
 |
 |
| Parameter | Plot |
|---|---|
| CZT HV Monitor | 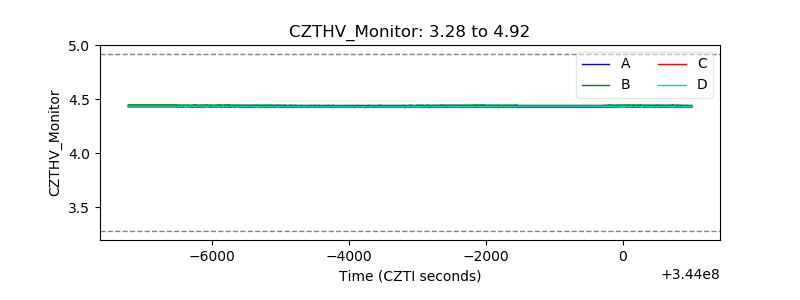 |
| D_VDD | 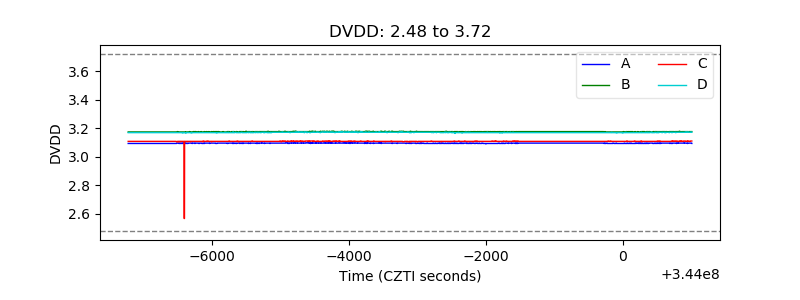 |
| Temperature 1 | 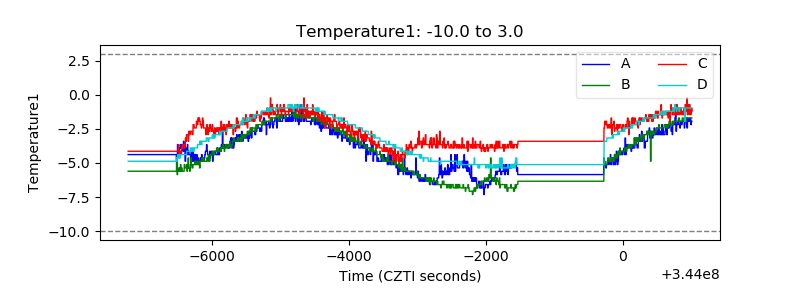 |
| Veto HV Monitor | 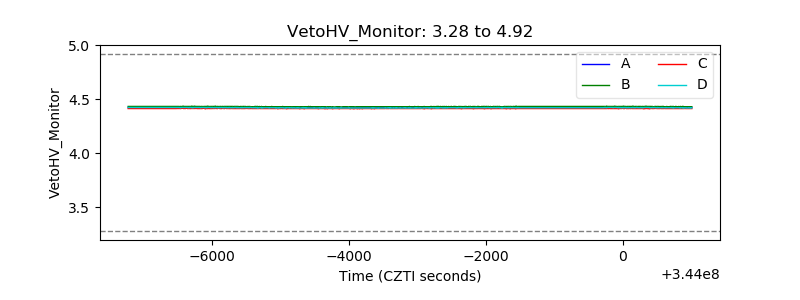 |
| Veto LLD | 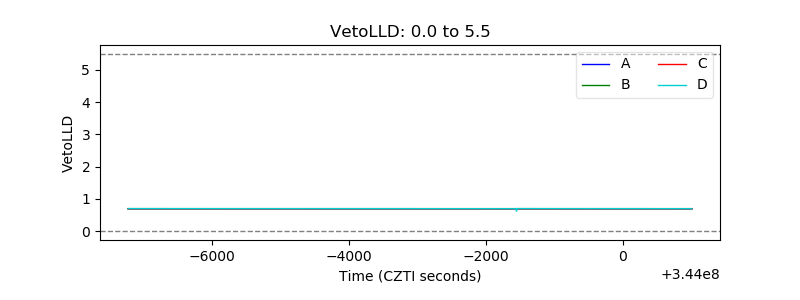 |
| Alpha Counter | 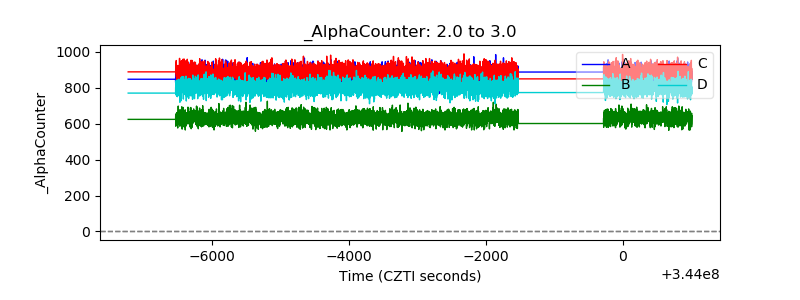 |
| _CPM_Rate | 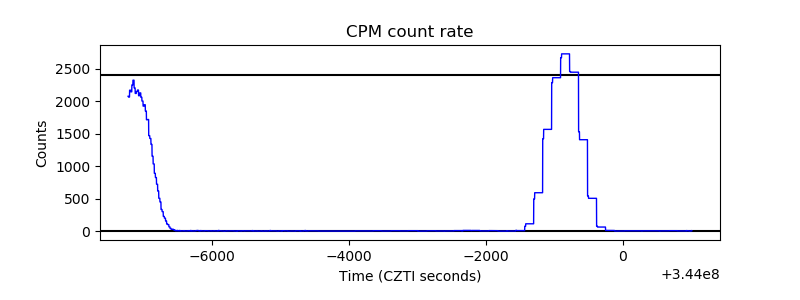 |
| CZT Counter | 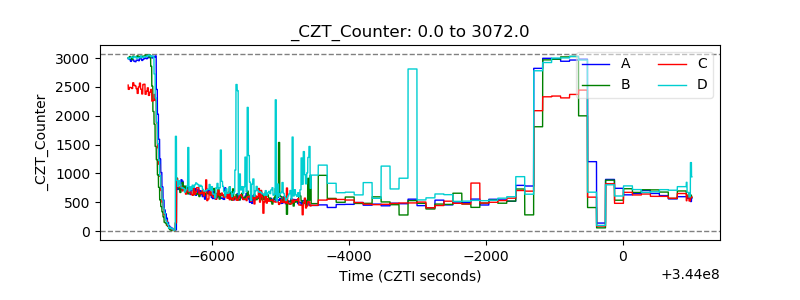 |
| +2.5 Volts monitor |  |
| +5 Volts monitor |  |
| _ROLL_ROT | 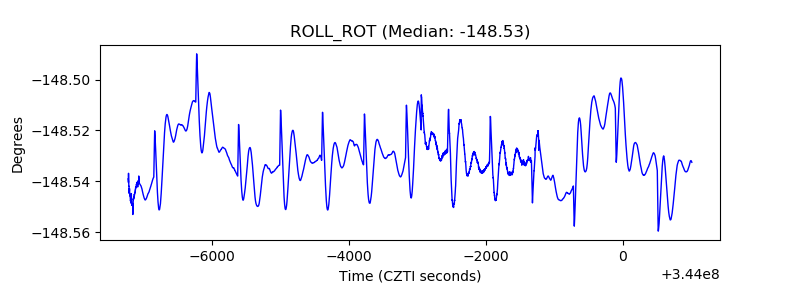 |
| _Roll_DEC | 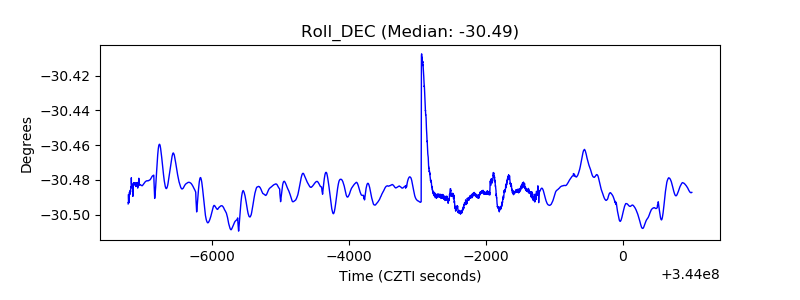 |
| _Roll_RA | 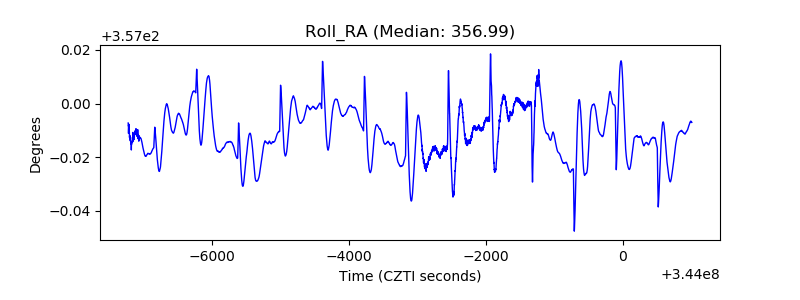 |
| Veto Counter | 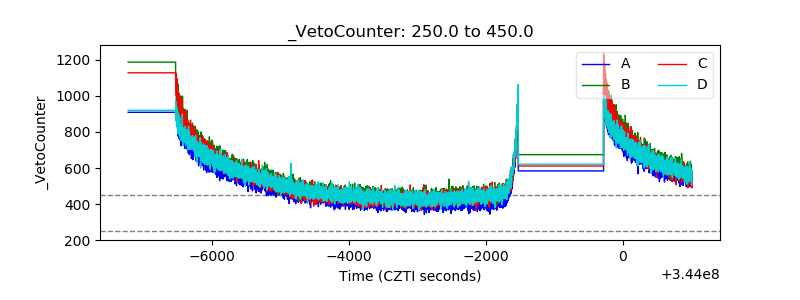 |