| Param | Original file | Final file |
|---|---|---|
| Filename | modeM0/AS1A10_048T06_9000004030_27907cztM0_level2.evt | modeM0/AS1A10_048T06_9000004030_27907cztM0_level2_quad_clean.evt |
| Size (bytes) | 522,872,640 | 121,187,520 |
| Size | 498.7 MB | 115.6 MB |
| Events in quadrant A | 3,263,706 | 848,503 |
| Events in quadrant B | 3,647,354 | 855,192 |
| Events in quadrant C | 3,364,792 | 788,169 |
| Events in quadrant D | 5,150,097 | 756,745 |
| Mode M0 | |||
|---|---|---|---|
| Quadrant | BADHDUFLAG | Total packets | Discarded packets |
| A | 0 | 13543 | 0 |
| B | 0 | 14898 | 0 |
| C | 0 | 13780 | 0 |
| D | 0 | 19600 | 0 |
| Mode M9 | |||
|---|---|---|---|
| Quadrant | BADHDUFLAG | Total packets | Discarded packets |
| A | 0 | 13 | 0 |
| B | 0 | 13 | 0 |
| C | 0 | 13 | 0 |
| D | 0 | 13 | 0 |
| Quadrant | Total seconds | Saturated seconds | Saturation percentage |
|---|---|---|---|
| A | 6035 | 87 | 1.441591% |
| B | 6035 | 147 | 2.435791% |
| C | 6035 | 127 | 2.104391% |
| D | 6036 | 358 | 5.931080% |
Noise dominated data is calculated using 1-second bins in cleaned event files. If a bin has >2000 counts, and if more than 50% of those come from <1% of pixels, then it is considered to be noise-dominated and hence unusable.
| Quadrant | # 1 sec bins | Bins with >0 counts | Bins with >2000 counts | High rate bins dominated by noise | Noise dominated (total time) | Noise dominated (detector-on time) | Marked lightcurve |
|---|---|---|---|---|---|---|---|
| A | 7345 | 6035 | 0 | 0 | 0.00% | 0.00% | 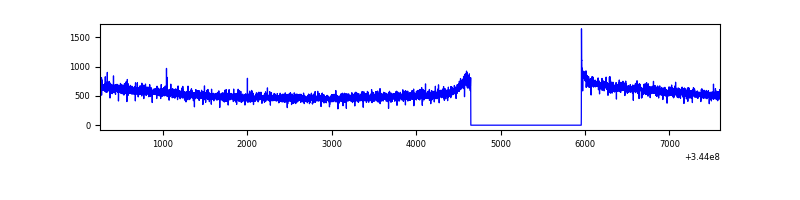 |
| B | 7345 | 6035 | 36 | 36 | 0.49% | 0.60% | 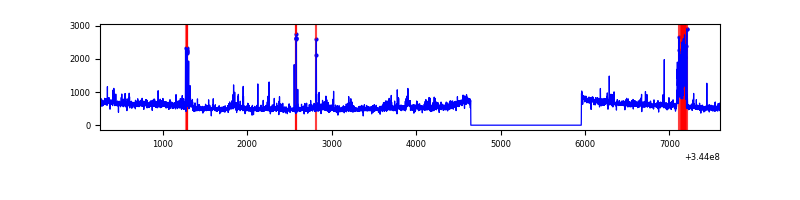 |
| C | 7345 | 6035 | 14 | 14 | 0.19% | 0.23% | 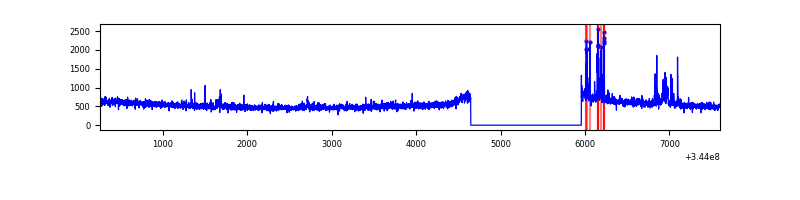 |
| D | 7346 | 6036 | 298 | 298 | 4.06% | 4.94% | 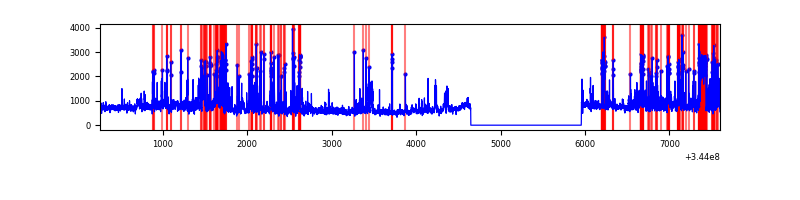 |
Top three noisy pixels from each quadrant. If the there are fewer than three noisy pixels in the level2.evt file, extra rows are filled as -1
| Pixel properties | Quadrant properties | ||||||
|---|---|---|---|---|---|---|---|
| Quadrant | DetID | PixID | Counts | Sigma | Mean | Median | Sigma |
| A | 13 | 254 | 10212 | 55.9 | 845 | 834 | 167.8 |
| A | 3 | 137 | 7387 | 39.06 | 845 | 834 | 167.8 |
| A | 0 | 226 | 7356 | 38.88 | 845 | 834 | 167.8 |
| B | 0 | 229 | 223614 | 1439.06 | 829 | 812 | 154.8 |
| B | 10 | 245 | 73439 | 469.09 | 829 | 812 | 154.8 |
| B | 0 | 230 | 43498 | 275.71 | 829 | 812 | 154.8 |
| C | 14 | 238 | 130060 | 722.64 | 779 | 786 | 178.9 |
| C | 3 | 233 | 99824 | 553.62 | 779 | 786 | 178.9 |
| C | 15 | 208 | 72073 | 398.5 | 779 | 786 | 178.9 |
| D | 1 | 52 | 1268398 | 6898.86 | 785 | 764 | 183.7 |
| D | 8 | 195 | 798148 | 4339.61 | 785 | 764 | 183.7 |
| D | 2 | 250 | 82506 | 444.86 | 785 | 764 | 183.7 |
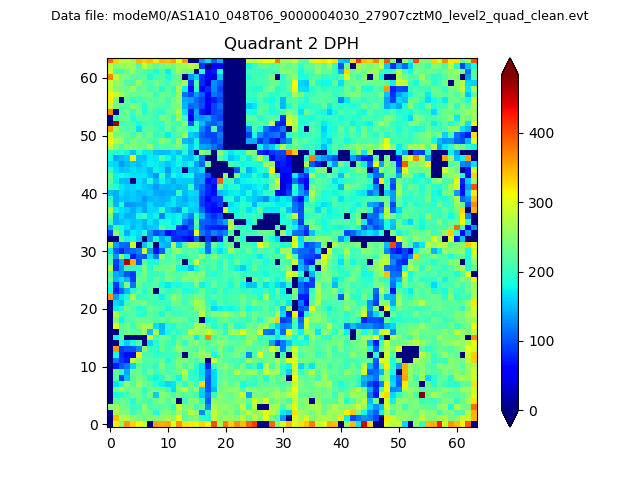
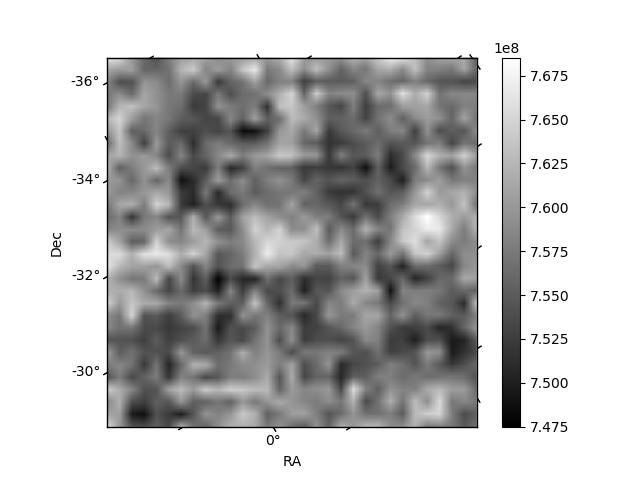
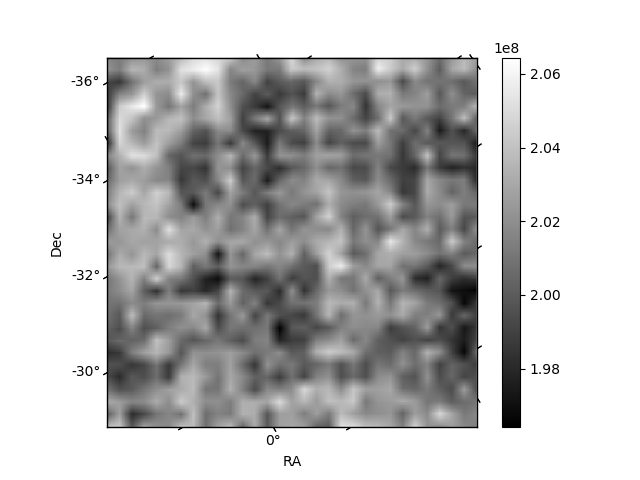
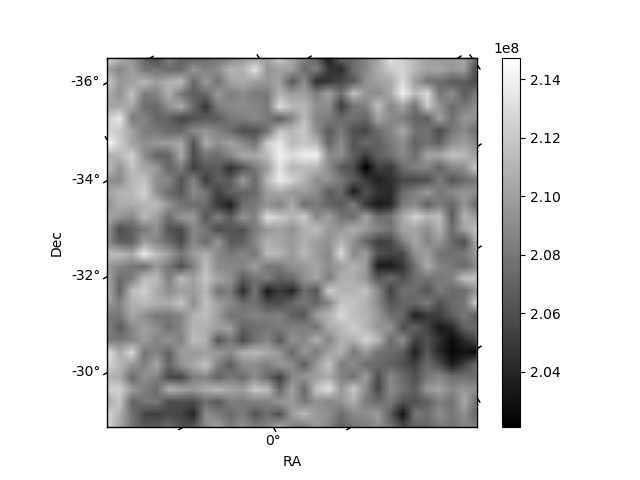
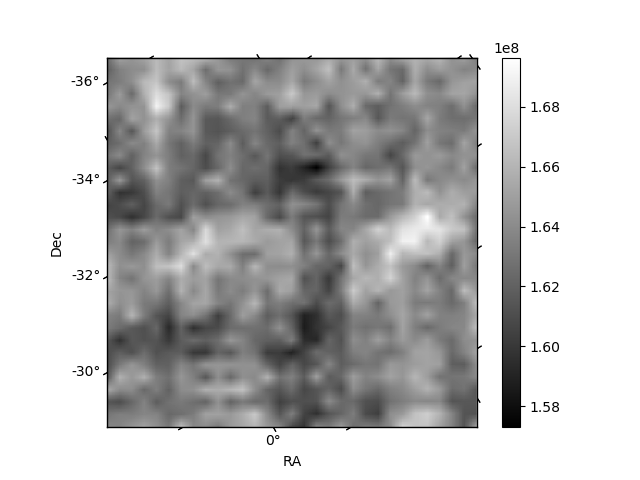
Histogram calculated using DETX and DETY for each event in the final _common_clean file
| Quadrant A | 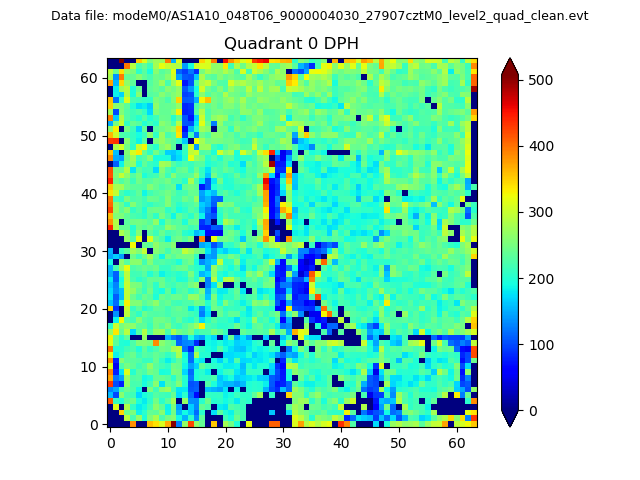 |
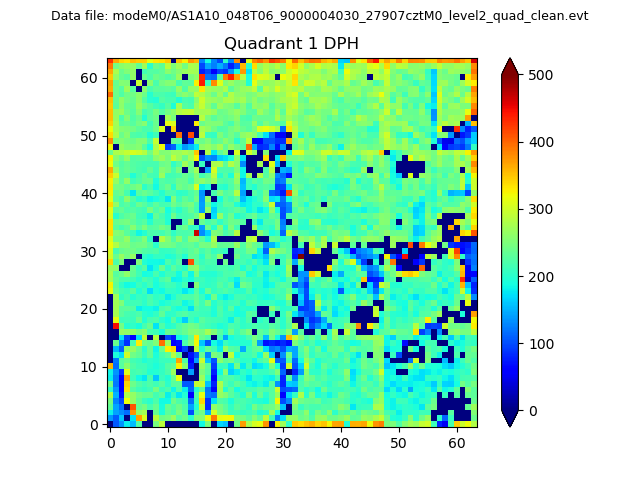 |
Quadrant B |
|---|---|---|---|
| Quadrant D | 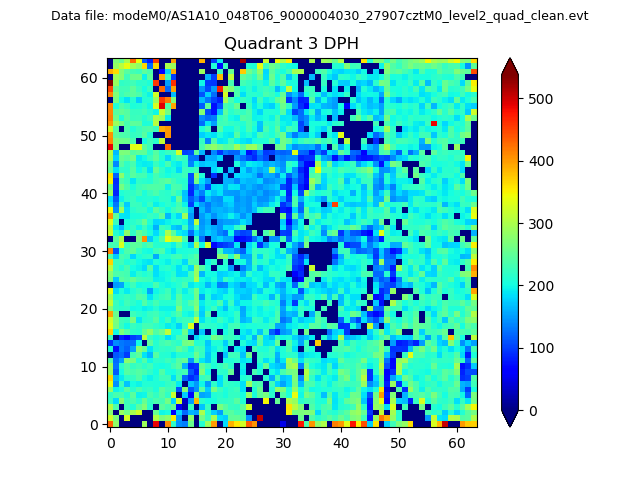 |
 |
Quadrant C |
| Plot type | Count rate plots | Images |
|---|---|---|
| Comparison with Poisson distribution Blue bars denote a histogram of data divided into 1 sec bins. Red curve is a Poisson curve with rate = median count rate of data. |
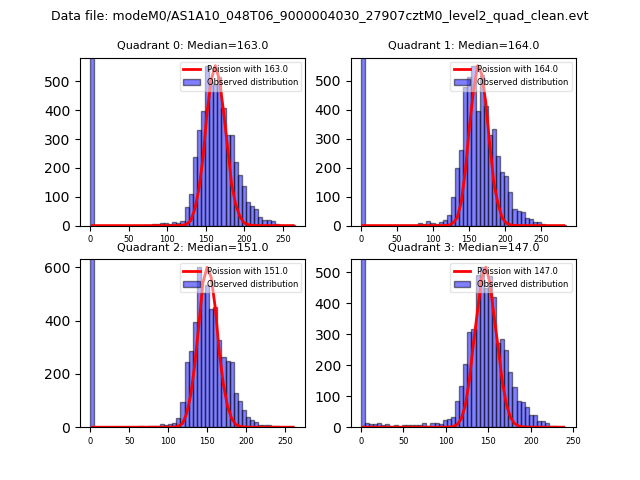 |
 |
| Quadrant-wise count rates Data is divided into 100 sec bins |
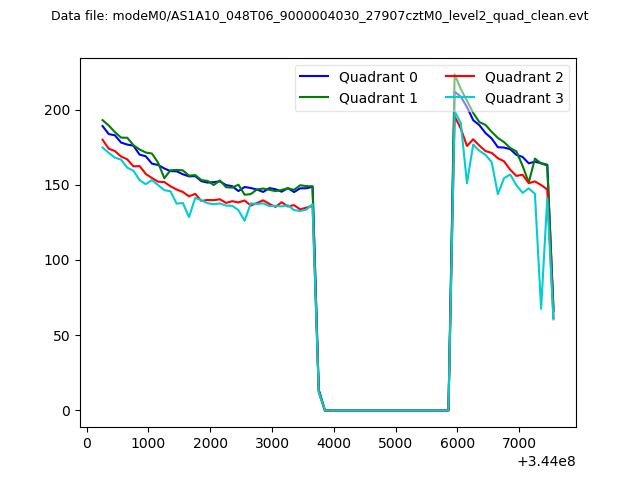 |
|
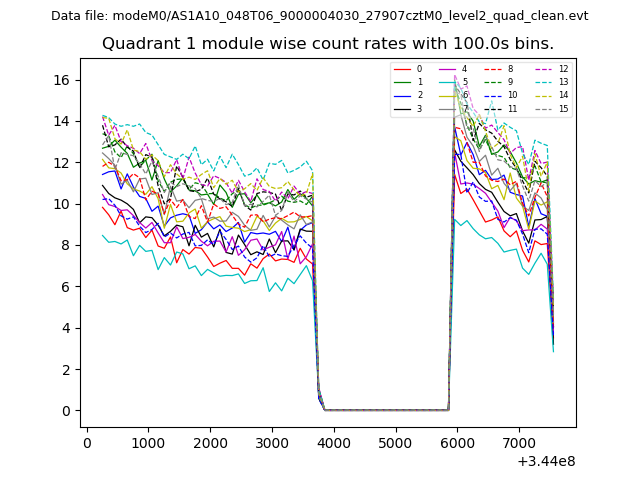
| Module-wise count rates for Quadrant A Data is divided into 100 sec bins |
 |
 |
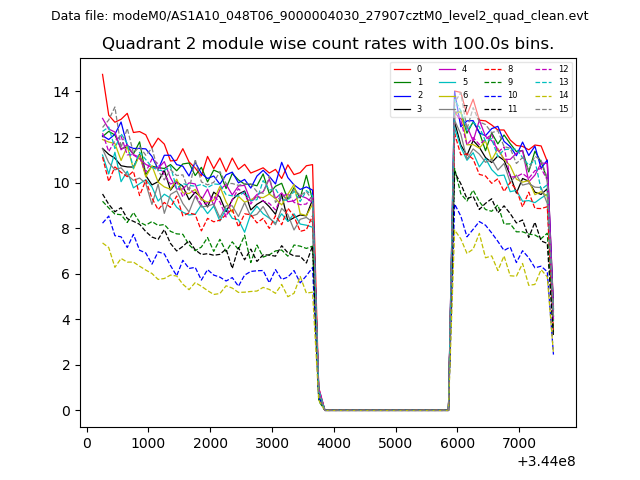
| Module-wise count rates for Quadrant B Data is divided into 100 sec bins |
 |
 |
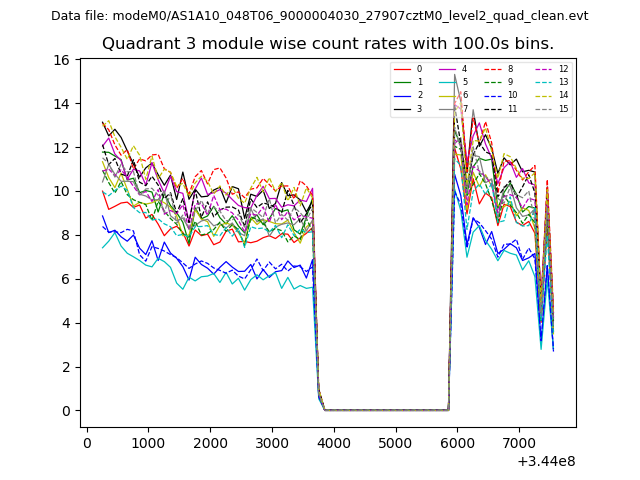
| Module-wise count rates for Quadrant C Data is divided into 100 sec bins |
 |
 |
| Module-wise count rates for Quadrant D Data is divided into 100 sec bins |
 |
 |
| Parameter | Plot |
|---|---|
| CZT HV Monitor | 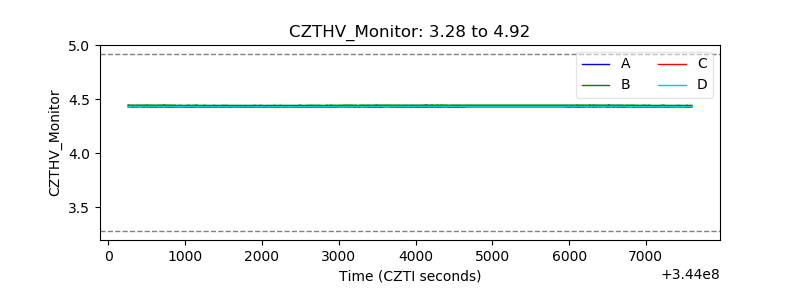 |
| D_VDD | 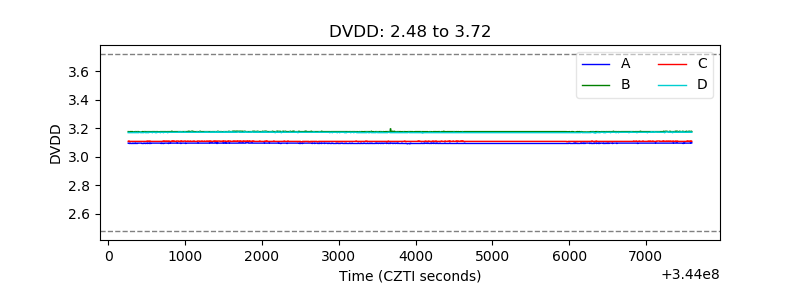 |
| Temperature 1 | 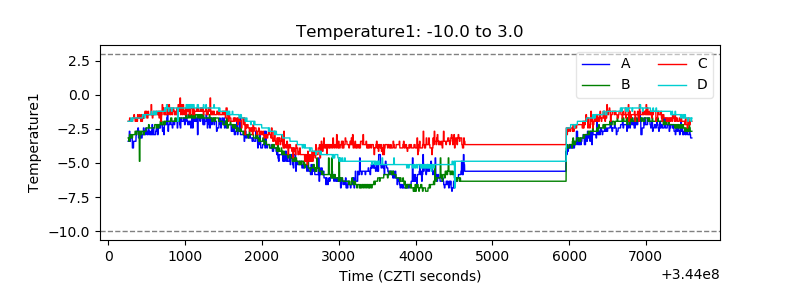 |
| Veto HV Monitor | 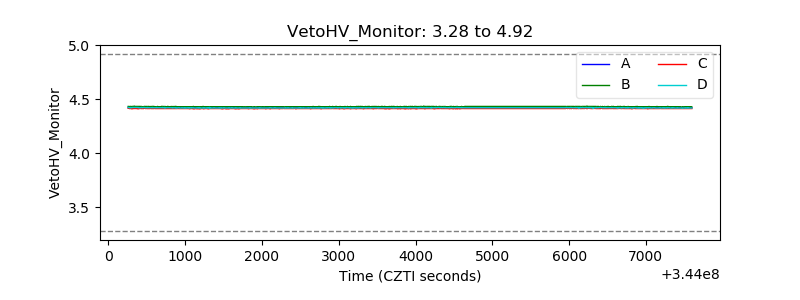 |
| Veto LLD | 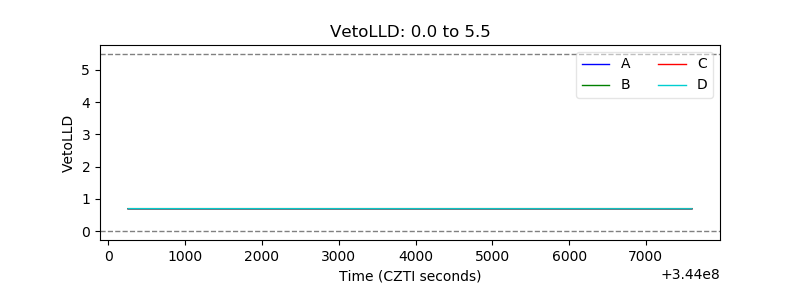 |
| Alpha Counter | 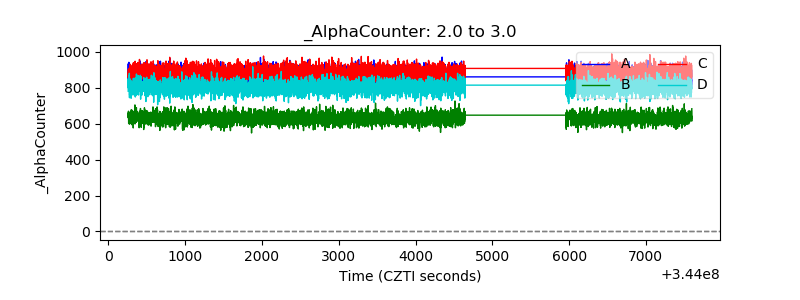 |
| _CPM_Rate | 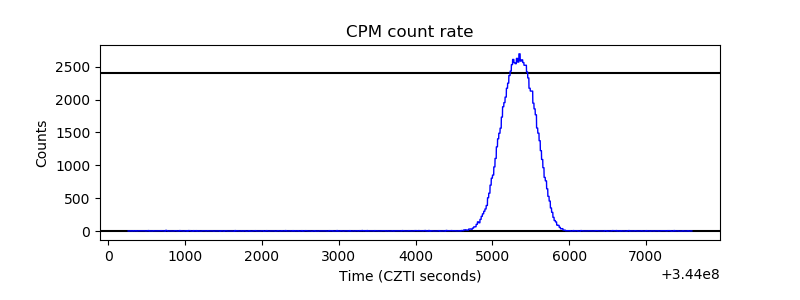 |
| CZT Counter | 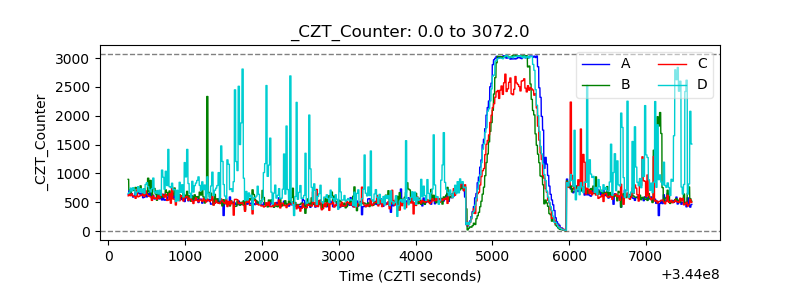 |
| +2.5 Volts monitor |  |
| +5 Volts monitor |  |
| _ROLL_ROT | 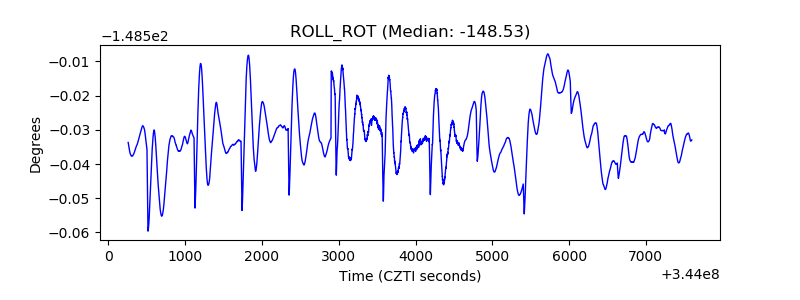 |
| _Roll_DEC | 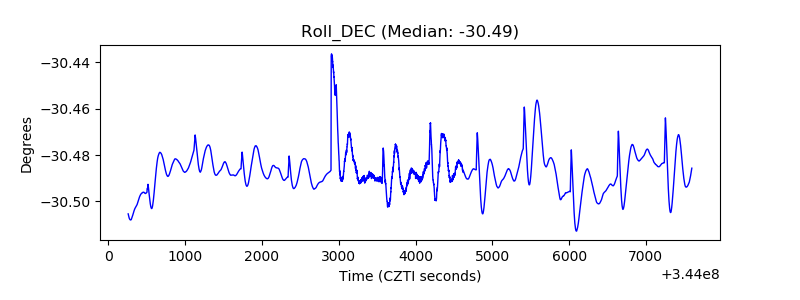 |
| _Roll_RA | 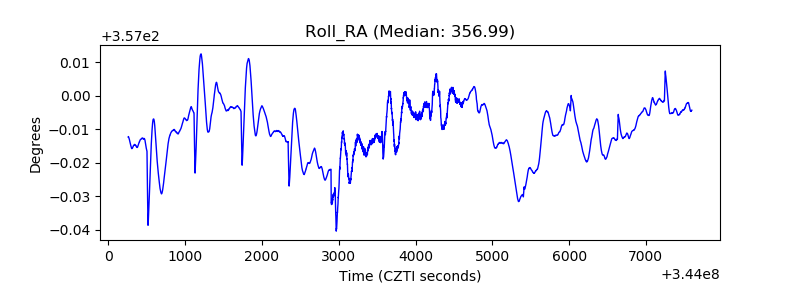 |
| Veto Counter | 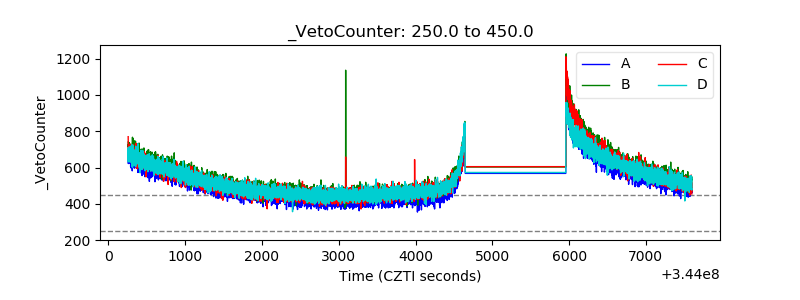 |