| Param | Original file | Final file |
|---|---|---|
| Filename | modeM0/AS1A10_048T06_9000004030_27908cztM0_level2.evt | modeM0/AS1A10_048T06_9000004030_27908cztM0_level2_quad_clean.evt |
| Size (bytes) | 579,936,960 | 114,310,080 |
| Size | 553.1 MB | 109.0 MB |
| Events in quadrant A | 3,343,548 | 799,488 |
| Events in quadrant B | 3,630,899 | 802,154 |
| Events in quadrant C | 3,477,450 | 740,948 |
| Events in quadrant D | 6,684,172 | 678,997 |
| Mode M0 | |||
|---|---|---|---|
| Quadrant | BADHDUFLAG | Total packets | Discarded packets |
| A | 0 | 13882 | 0 |
| B | 0 | 14832 | 0 |
| C | 0 | 14371 | 0 |
| D | 0 | 24493 | 0 |
| Mode M9 | |||
|---|---|---|---|
| Quadrant | BADHDUFLAG | Total packets | Discarded packets |
| A | 0 | 13 | 0 |
| B | 0 | 13 | 0 |
| C | 0 | 13 | 0 |
| D | 0 | 13 | 0 |
| Quadrant | Total seconds | Saturated seconds | Saturation percentage |
|---|---|---|---|
| A | 6309 | 108 | 1.711840% |
| B | 6310 | 168 | 2.662441% |
| C | 6310 | 149 | 2.361331% |
| D | 6310 | 915 | 14.500792% |
Noise dominated data is calculated using 1-second bins in cleaned event files. If a bin has >2000 counts, and if more than 50% of those come from <1% of pixels, then it is considered to be noise-dominated and hence unusable.
| Quadrant | # 1 sec bins | Bins with >0 counts | Bins with >2000 counts | High rate bins dominated by noise | Noise dominated (total time) | Noise dominated (detector-on time) | Marked lightcurve |
|---|---|---|---|---|---|---|---|
| A | 7584 | 6309 | 0 | 0 | 0.00% | 0.00% |  |
| B | 7585 | 6310 | 30 | 30 | 0.40% | 0.48% |  |
| C | 7585 | 6310 | 6 | 6 | 0.08% | 0.10% |  |
| D | 7585 | 6310 | 816 | 816 | 10.76% | 12.93% |  |
Top three noisy pixels from each quadrant. If the there are fewer than three noisy pixels in the level2.evt file, extra rows are filled as -1
| Pixel properties | Quadrant properties | ||||||
|---|---|---|---|---|---|---|---|
| Quadrant | DetID | PixID | Counts | Sigma | Mean | Median | Sigma |
| A | 13 | 254 | 10876 | 58.74 | 864 | 850 | 170.7 |
| A | 3 | 137 | 7664 | 39.92 | 864 | 850 | 170.7 |
| A | 0 | 226 | 7513 | 39.04 | 864 | 850 | 170.7 |
| B | 0 | 229 | 199984 | 1260.92 | 848 | 832 | 157.9 |
| B | 10 | 245 | 56699 | 353.72 | 848 | 832 | 157.9 |
| B | 0 | 230 | 21597 | 131.47 | 848 | 832 | 157.9 |
| C | 14 | 238 | 131534 | 710.86 | 799 | 805 | 183.9 |
| C | 15 | 208 | 114660 | 619.1 | 799 | 805 | 183.9 |
| C | 3 | 233 | 114361 | 617.48 | 799 | 805 | 183.9 |
| D | 1 | 52 | 2612865 | 14506.91 | 762 | 745 | 180.1 |
| D | 8 | 195 | 707624 | 3925.79 | 762 | 745 | 180.1 |
| D | 2 | 250 | 383986 | 2128.4 | 762 | 745 | 180.1 |
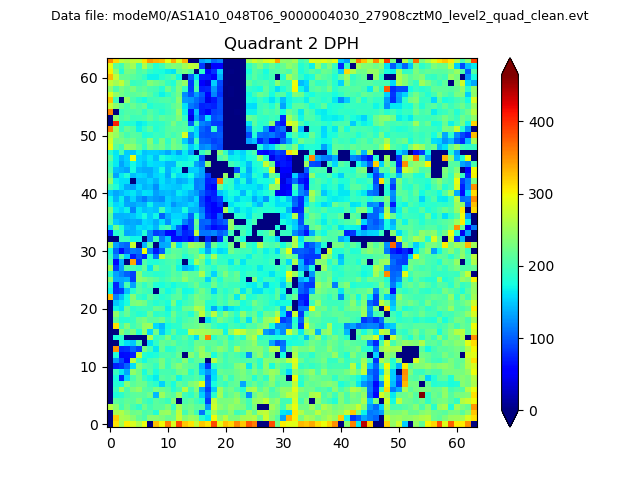
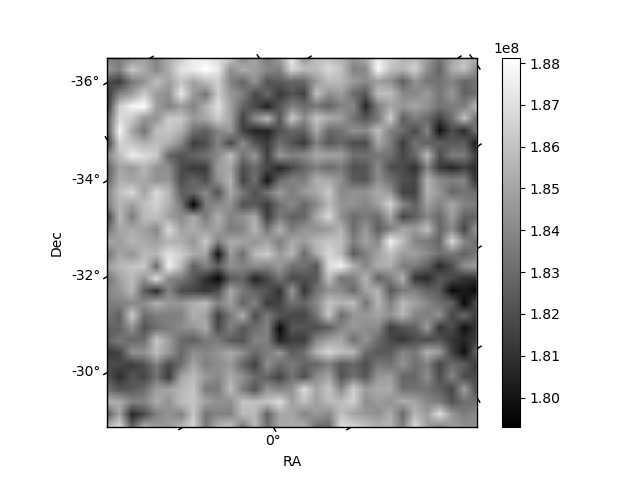
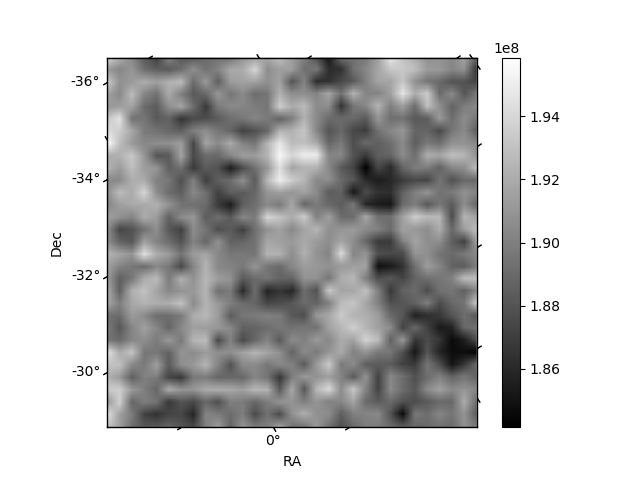
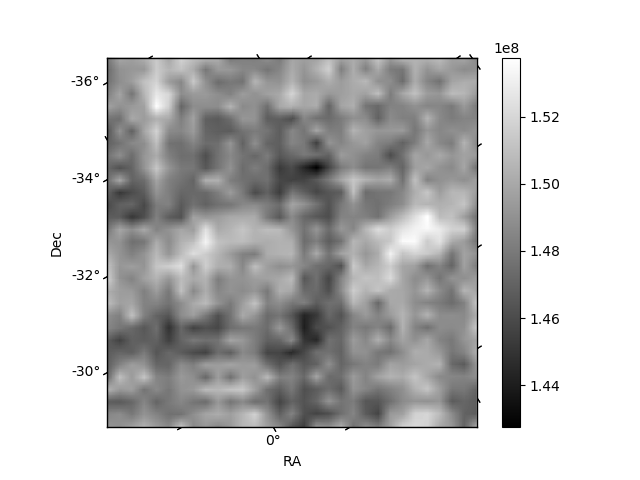
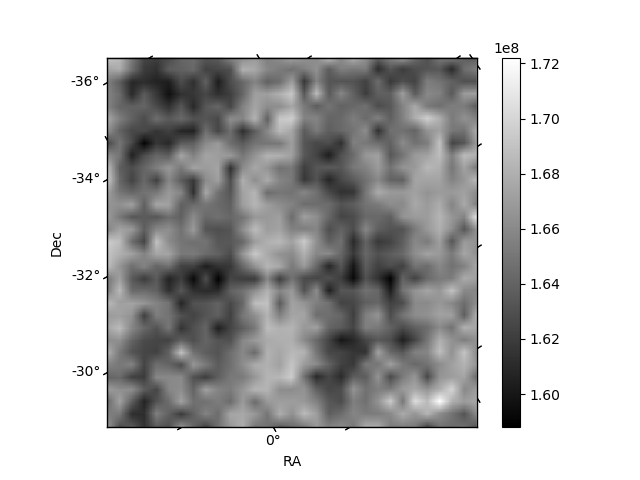
Histogram calculated using DETX and DETY for each event in the final _common_clean file
| Quadrant A | 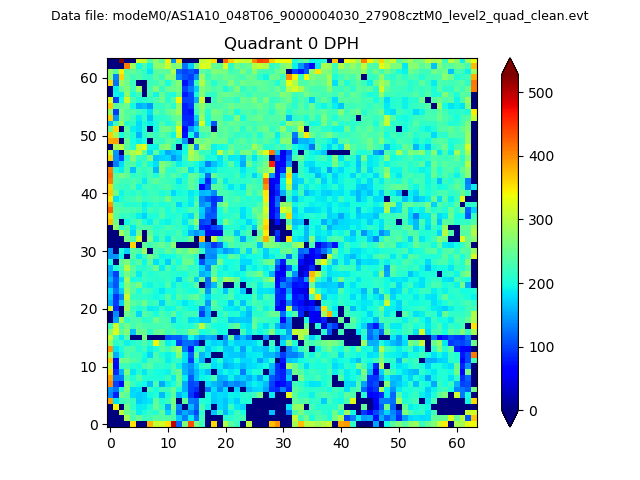 |
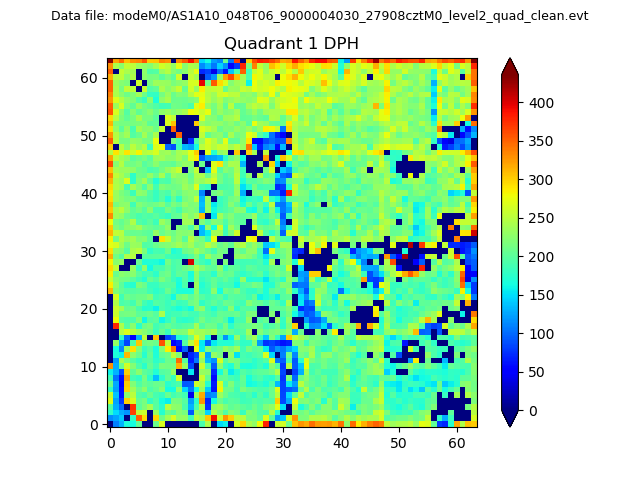 |
Quadrant B |
|---|---|---|---|
| Quadrant D | 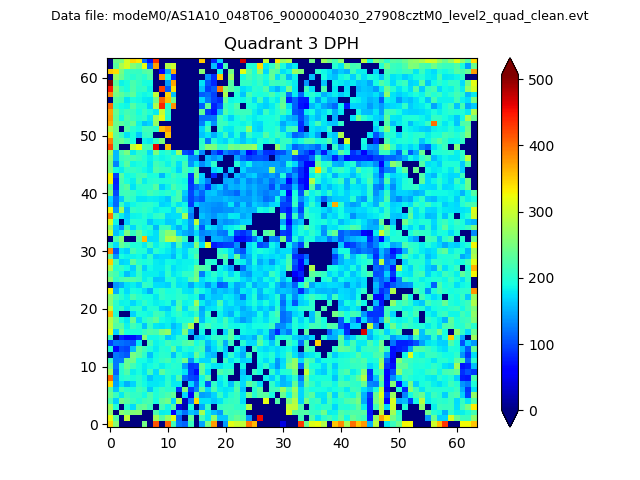 |
 |
Quadrant C |
| Plot type | Count rate plots | Images |
|---|---|---|
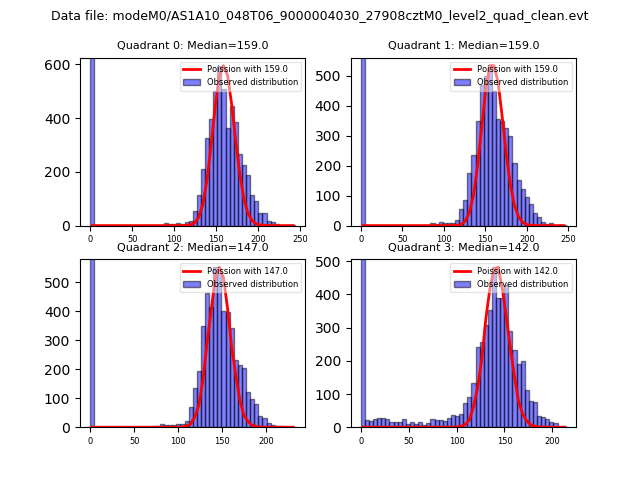
| Comparison with Poisson distribution Blue bars denote a histogram of data divided into 1 sec bins. Red curve is a Poisson curve with rate = median count rate of data. |
 |
 |
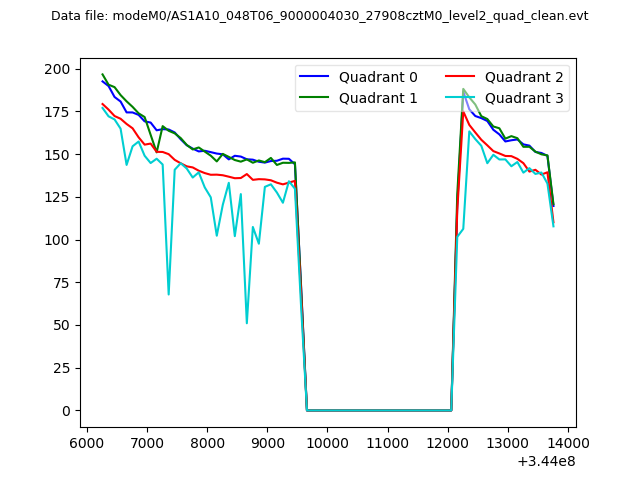
| Quadrant-wise count rates Data is divided into 100 sec bins |
 |
|
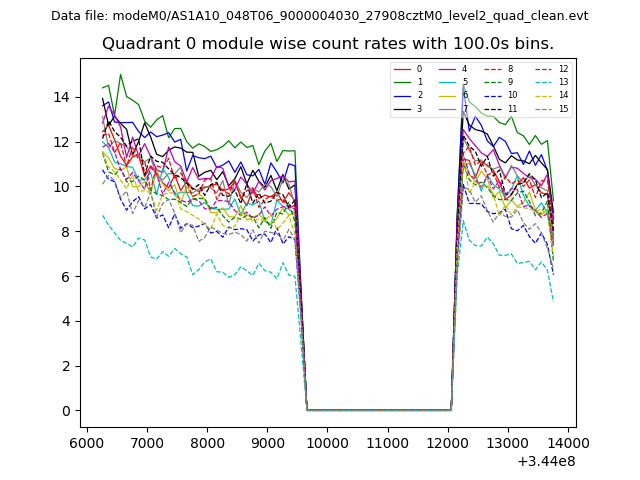
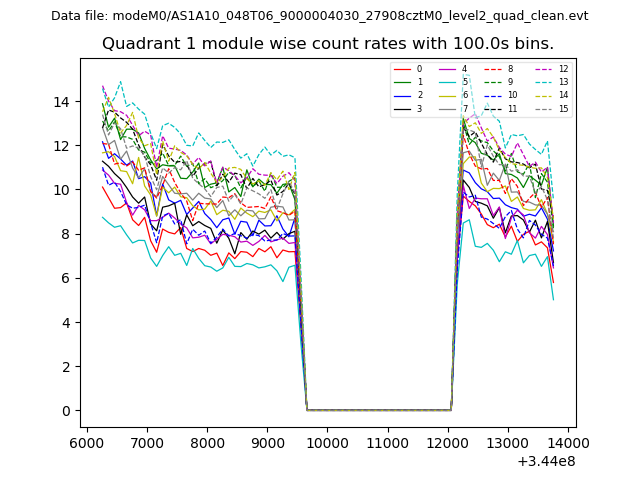
| Module-wise count rates for Quadrant A Data is divided into 100 sec bins |
 |
 |
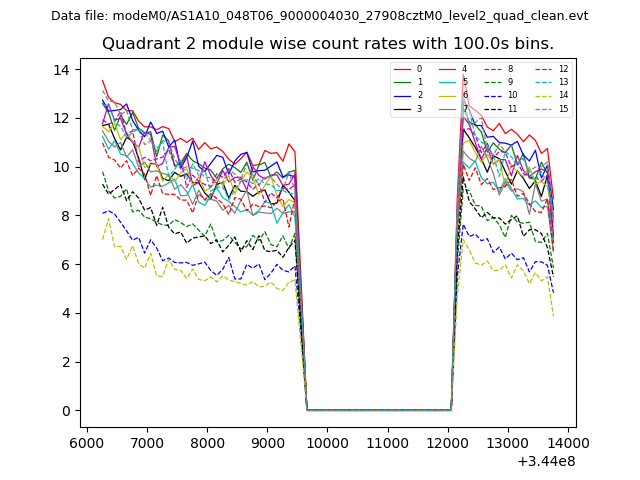
| Module-wise count rates for Quadrant B Data is divided into 100 sec bins |
 |
 |
| Module-wise count rates for Quadrant C Data is divided into 100 sec bins |
 |
 |
| Module-wise count rates for Quadrant D Data is divided into 100 sec bins |
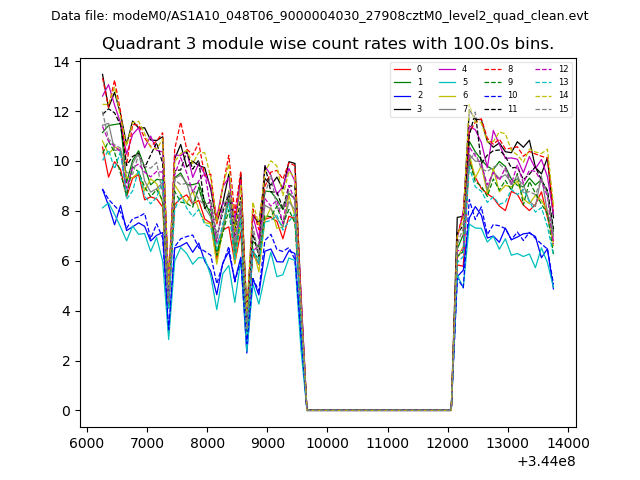 |
 |
| Parameter | Plot |
|---|---|
| CZT HV Monitor | 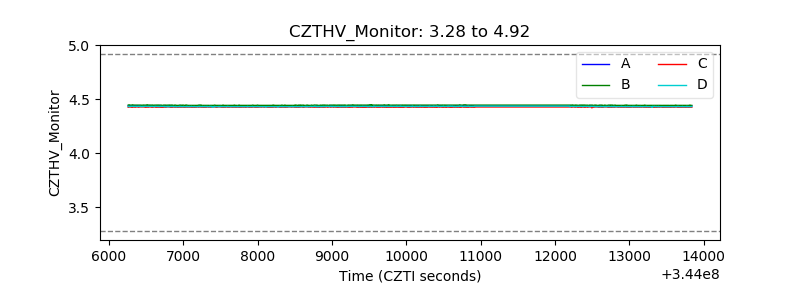 |
| D_VDD | 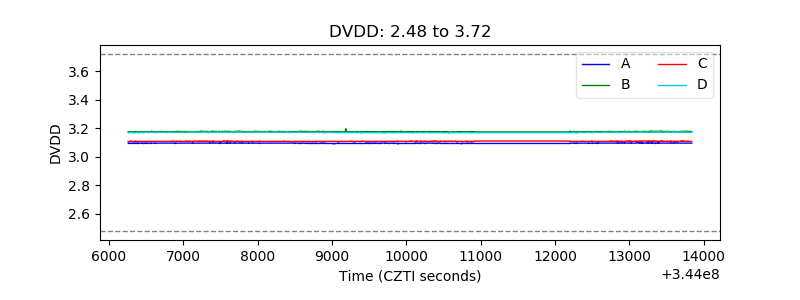 |
| Temperature 1 | 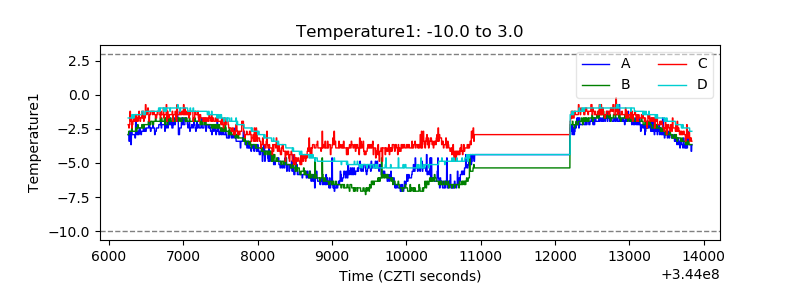 |
| Veto HV Monitor | 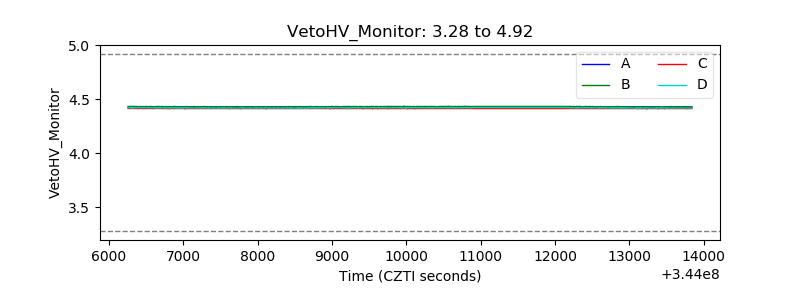 |
| Veto LLD | 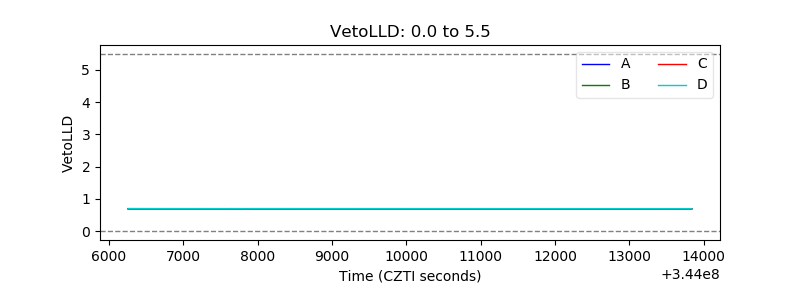 |
| Alpha Counter | 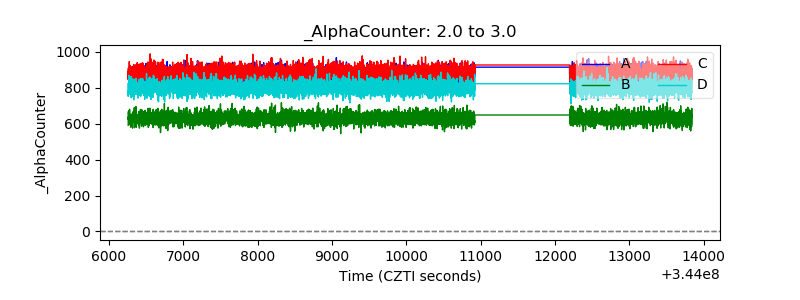 |
| _CPM_Rate | 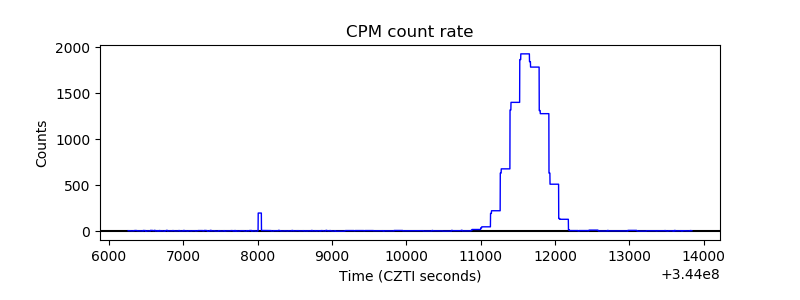 |
| CZT Counter | 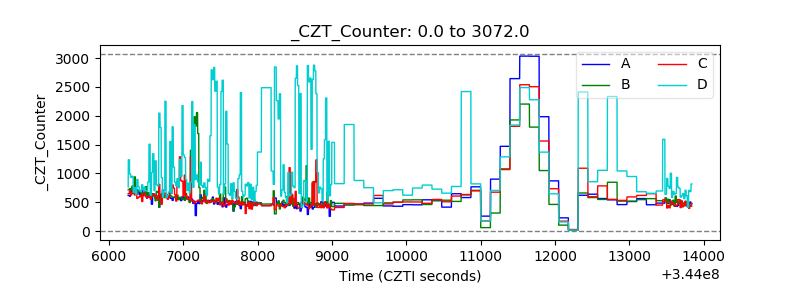 |
| +2.5 Volts monitor |  |
| +5 Volts monitor |  |
| _ROLL_ROT | 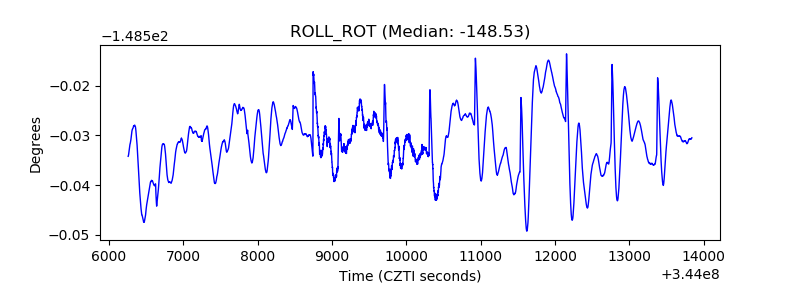 |
| _Roll_DEC | 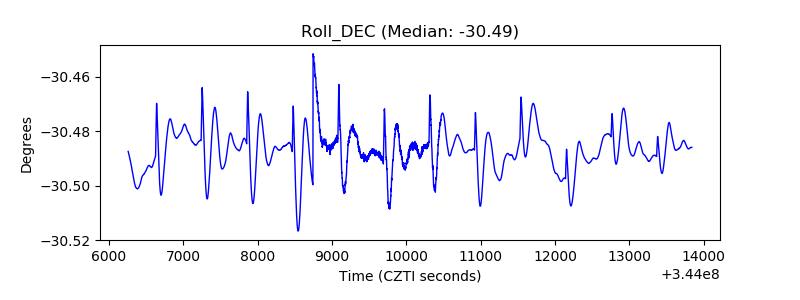 |
| _Roll_RA | 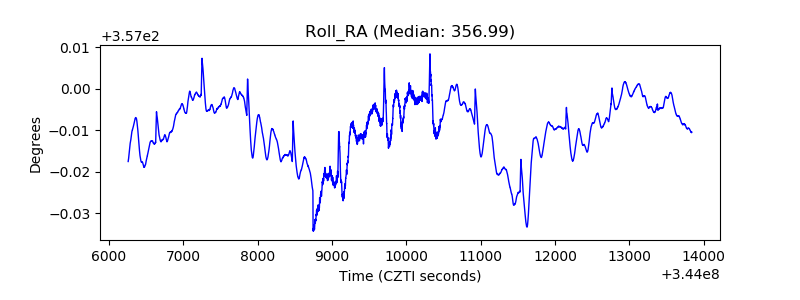 |
| Veto Counter | 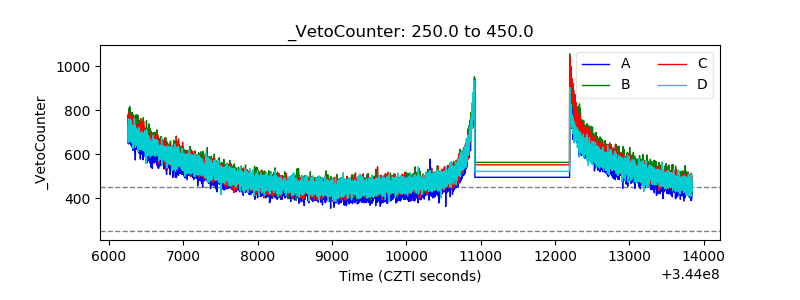 |