| Param | Original file | Final file |
|---|---|---|
| Filename | modeM0/AS1A10_048T06_9000004030_27909cztM0_level2.evt | modeM0/AS1A10_048T06_9000004030_27909cztM0_level2_quad_clean.evt |
| Size (bytes) | 522,313,920 | 88,390,080 |
| Size | 498.1 MB | 84.3 MB |
| Events in quadrant A | 2,987,113 | 605,660 |
| Events in quadrant B | 3,355,345 | 607,108 |
| Events in quadrant C | 2,988,072 | 565,122 |
| Events in quadrant D | 6,084,694 | 483,507 |
| Mode M0 | |||
|---|---|---|---|
| Quadrant | BADHDUFLAG | Total packets | Discarded packets |
| A | 0 | 12535 | 0 |
| B | 0 | 13494 | 0 |
| C | 0 | 12659 | 0 |
| D | 0 | 22216 | 0 |
| Mode M9 | |||
|---|---|---|---|
| Quadrant | BADHDUFLAG | Total packets | Discarded packets |
| A | 0 | 12 | 0 |
| B | 0 | 12 | 0 |
| C | 0 | 12 | 0 |
| D | 0 | 12 | 0 |
| Quadrant | Total seconds | Saturated seconds | Saturation percentage |
|---|---|---|---|
| A | 5942 | 88 | 1.480983% |
| B | 5943 | 135 | 2.271580% |
| C | 5943 | 123 | 2.069662% |
| D | 5943 | 973 | 16.372203% |
Noise dominated data is calculated using 1-second bins in cleaned event files. If a bin has >2000 counts, and if more than 50% of those come from <1% of pixels, then it is considered to be noise-dominated and hence unusable.
| Quadrant | # 1 sec bins | Bins with >0 counts | Bins with >2000 counts | High rate bins dominated by noise | Noise dominated (total time) | Noise dominated (detector-on time) | Marked lightcurve |
|---|---|---|---|---|---|---|---|
| A | 7107 | 5942 | 0 | 0 | 0.00% | 0.00% | 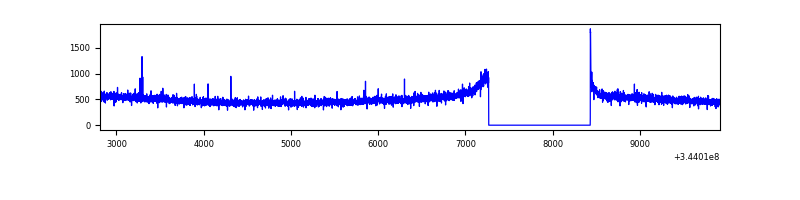 |
| B | 7108 | 5943 | 19 | 19 | 0.27% | 0.32% | 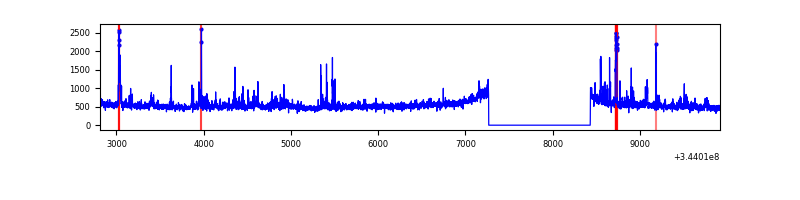 |
| C | 7108 | 5943 | 2 | 2 | 0.03% | 0.03% | 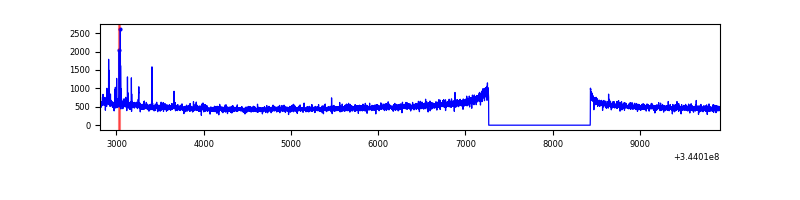 |
| D | 7108 | 5943 | 871 | 871 | 12.25% | 14.66% | 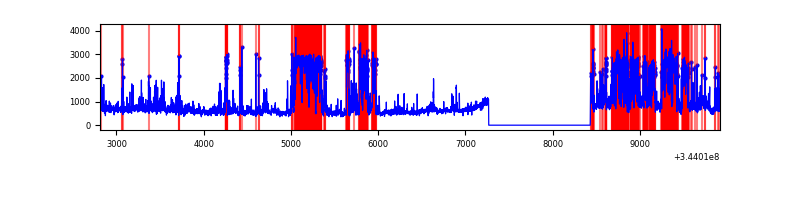 |
Top three noisy pixels from each quadrant. If the there are fewer than three noisy pixels in the level2.evt file, extra rows are filled as -1
| Pixel properties | Quadrant properties | ||||||
|---|---|---|---|---|---|---|---|
| Quadrant | DetID | PixID | Counts | Sigma | Mean | Median | Sigma |
| A | 13 | 254 | 10706 | 64.33 | 771 | 758 | 154.6 |
| A | 3 | 137 | 7122 | 41.15 | 771 | 758 | 154.6 |
| A | 0 | 226 | 6601 | 37.78 | 771 | 758 | 154.6 |
| B | 10 | 245 | 212258 | 1465.38 | 762 | 745 | 144.3 |
| B | 0 | 229 | 68130 | 466.85 | 762 | 745 | 144.3 |
| B | 0 | 230 | 52915 | 361.44 | 762 | 745 | 144.3 |
| C | 14 | 238 | 120085 | 716.96 | 718 | 726 | 166.5 |
| C | 15 | 208 | 39110 | 230.56 | 718 | 726 | 166.5 |
| C | 3 | 233 | 29082 | 170.33 | 718 | 726 | 166.5 |
| D | 1 | 52 | 2751523 | 17337.38 | 667 | 650 | 158.7 |
| D | 8 | 195 | 591074 | 3721.15 | 667 | 650 | 158.7 |
| D | 2 | 250 | 165286 | 1037.62 | 667 | 650 | 158.7 |
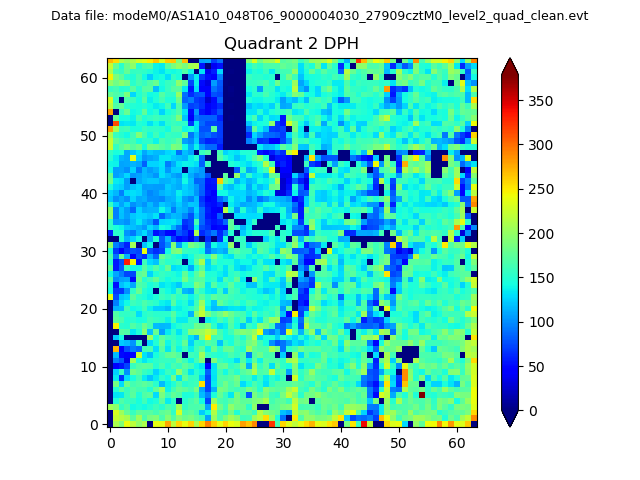
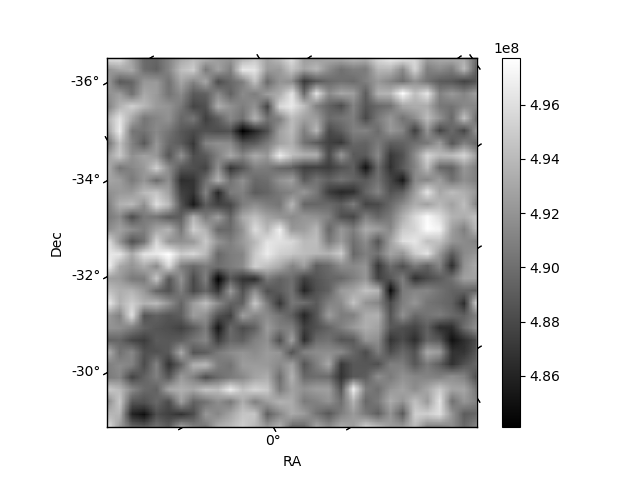
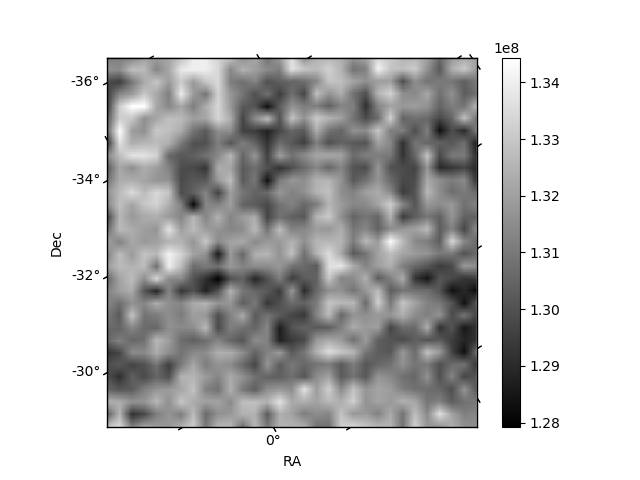
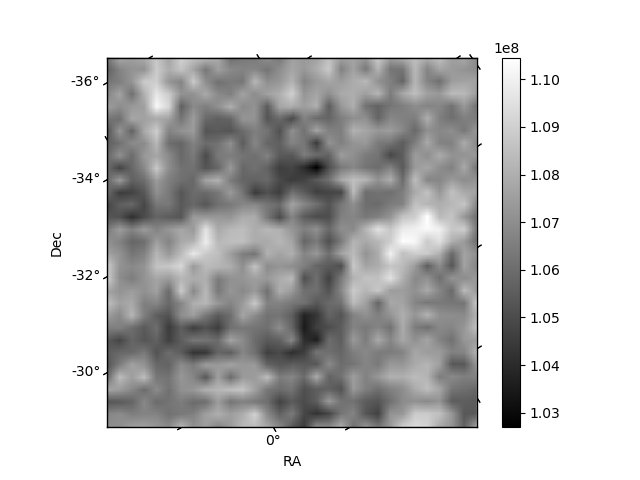
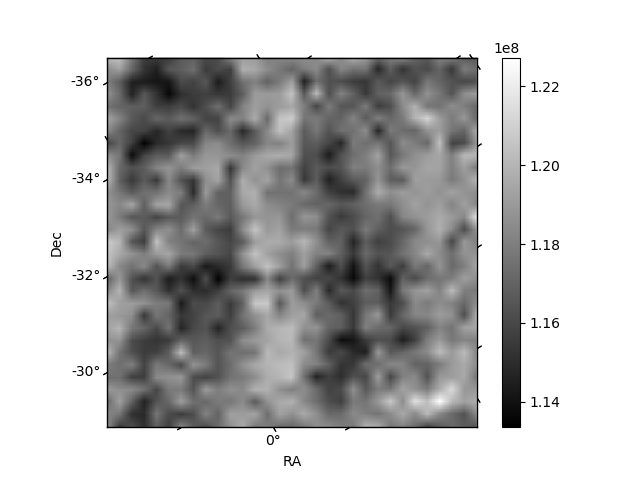
Histogram calculated using DETX and DETY for each event in the final _common_clean file
| Quadrant A | 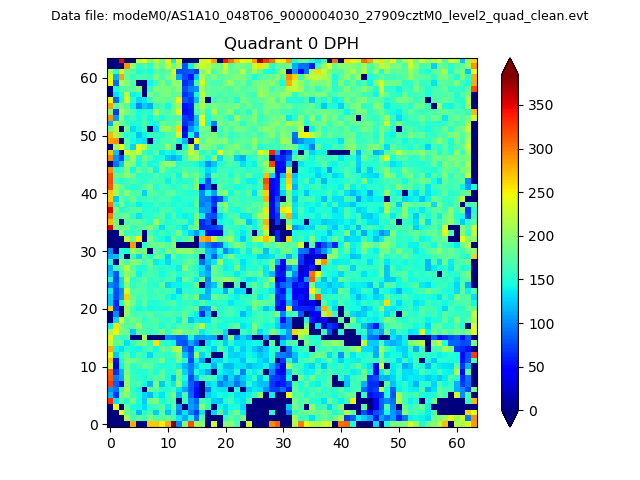 |
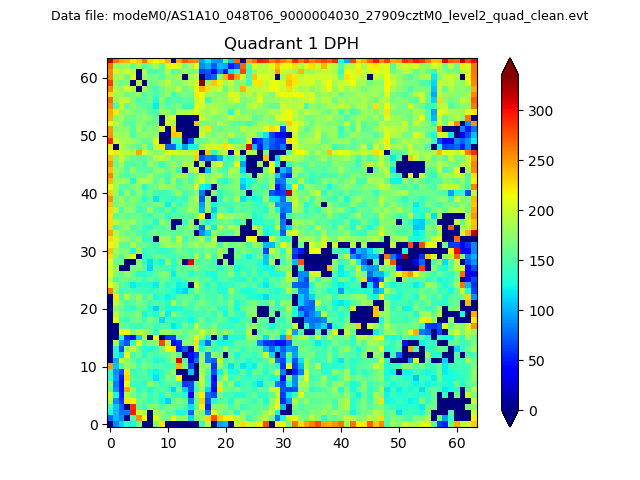 |
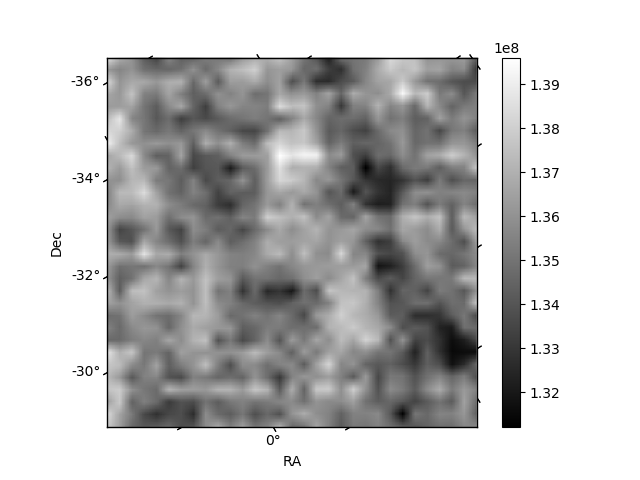
Quadrant B |
|---|---|---|---|
| Quadrant D | 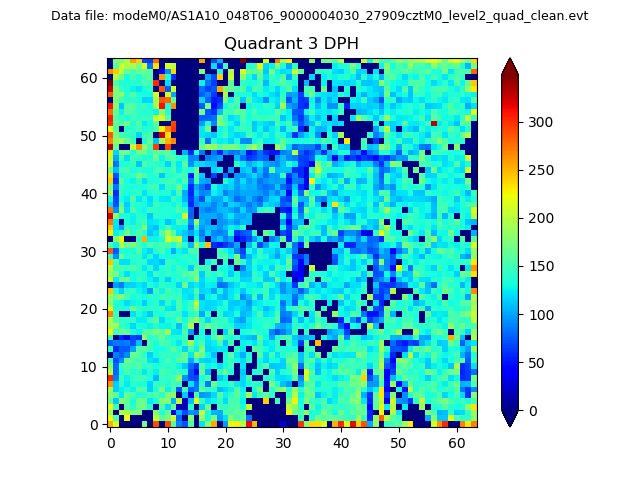 |
 |
Quadrant C |
| Plot type | Count rate plots | Images |
|---|---|---|
| Comparison with Poisson distribution Blue bars denote a histogram of data divided into 1 sec bins. Red curve is a Poisson curve with rate = median count rate of data. |
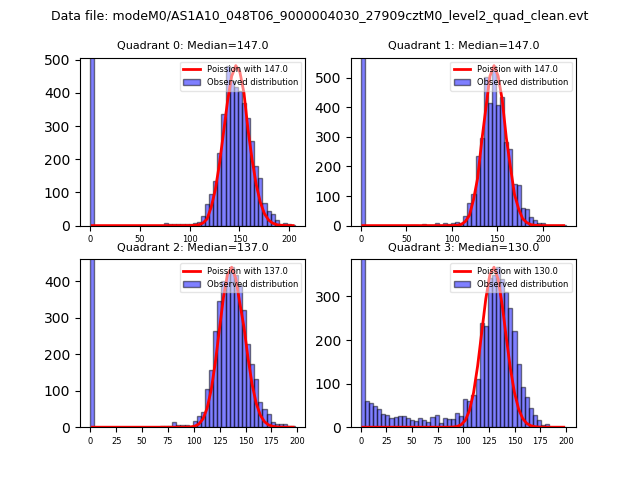 |
 |
| Quadrant-wise count rates Data is divided into 100 sec bins |
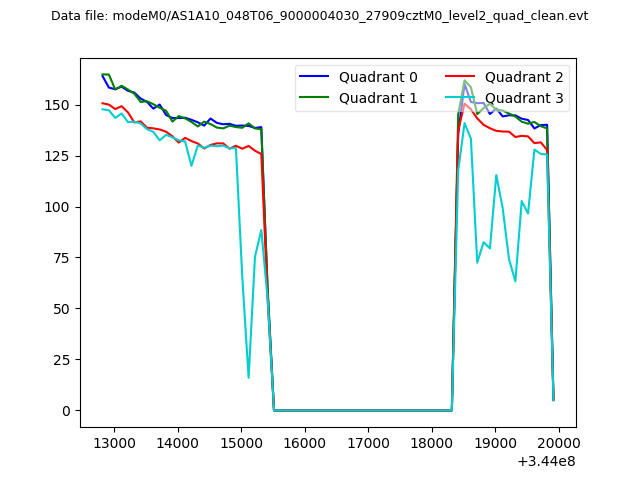 |
|
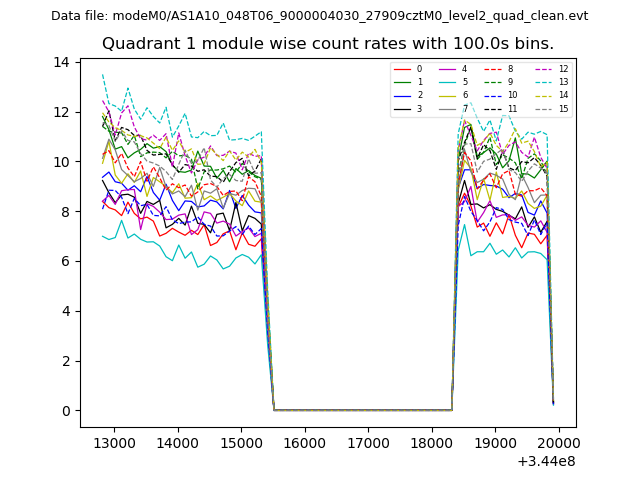
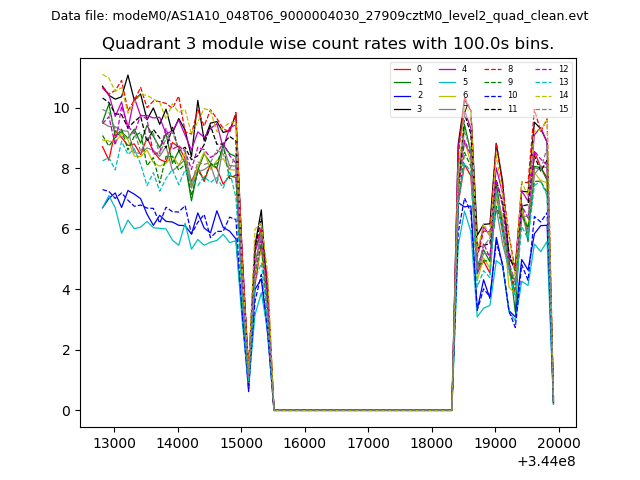
| Module-wise count rates for Quadrant A Data is divided into 100 sec bins |
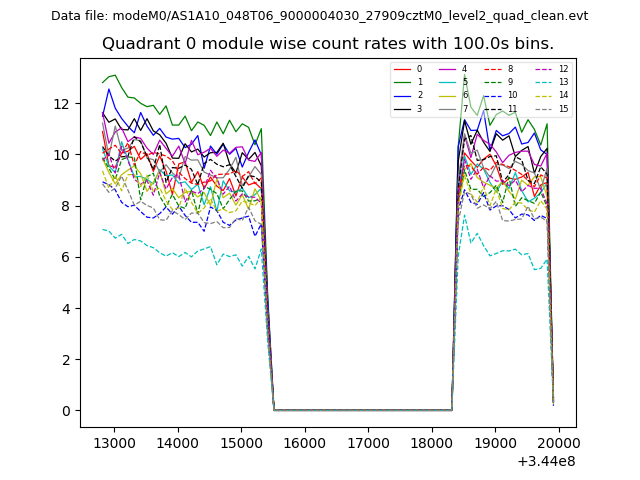 |
 |
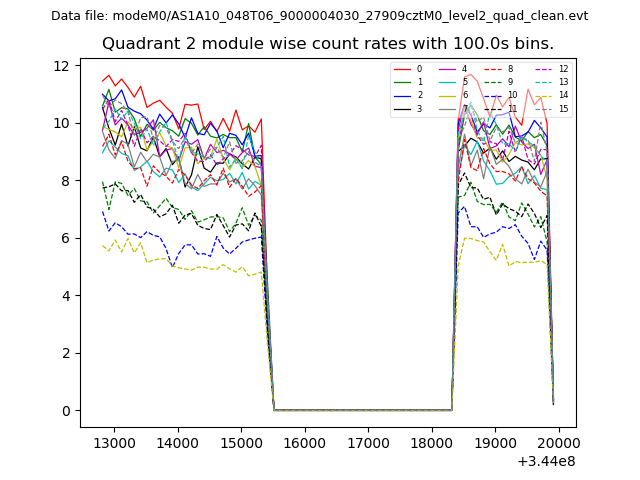
| Module-wise count rates for Quadrant B Data is divided into 100 sec bins |
 |
 |
| Module-wise count rates for Quadrant C Data is divided into 100 sec bins |
 |
 |
| Module-wise count rates for Quadrant D Data is divided into 100 sec bins |
 |
 |
| Parameter | Plot |
|---|---|
| CZT HV Monitor | 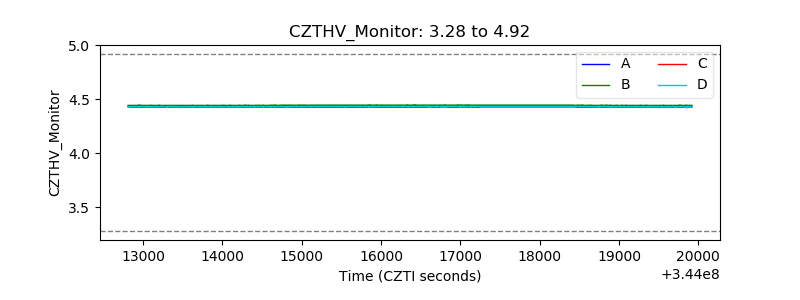 |
| D_VDD | 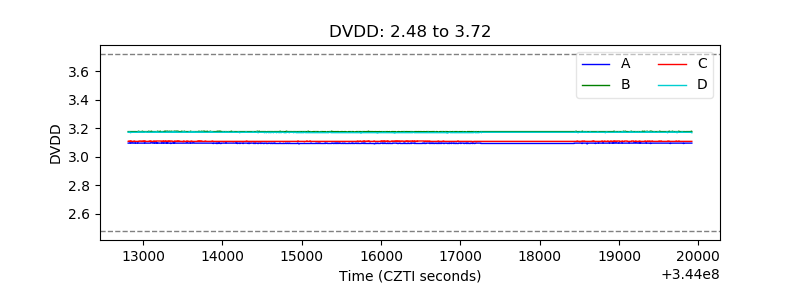 |
| Temperature 1 | 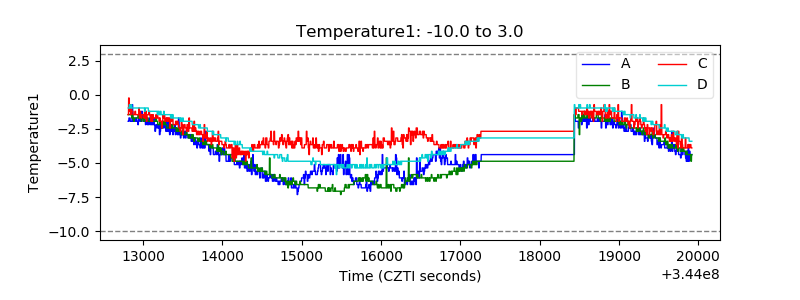 |
| Veto HV Monitor | 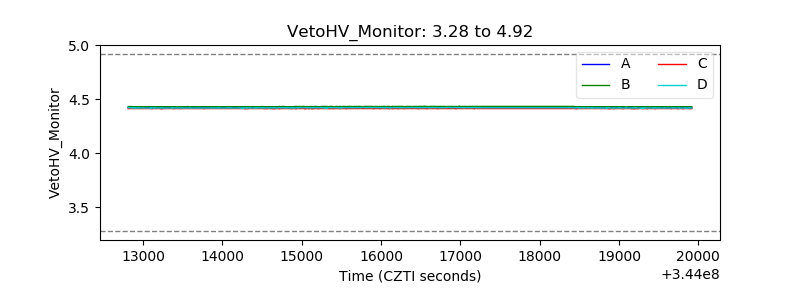 |
| Veto LLD | 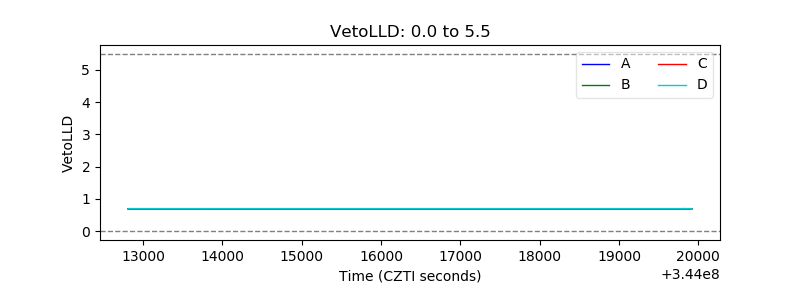 |
| Alpha Counter | 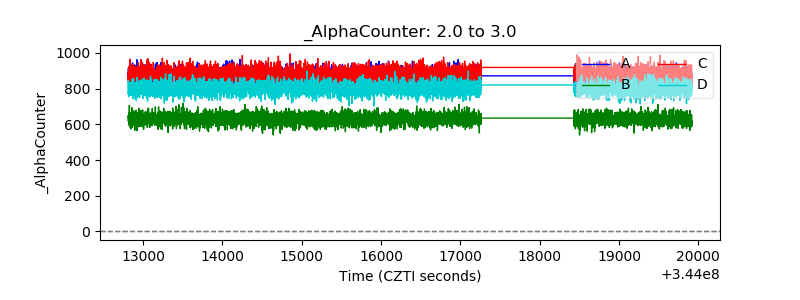 |
| _CPM_Rate | 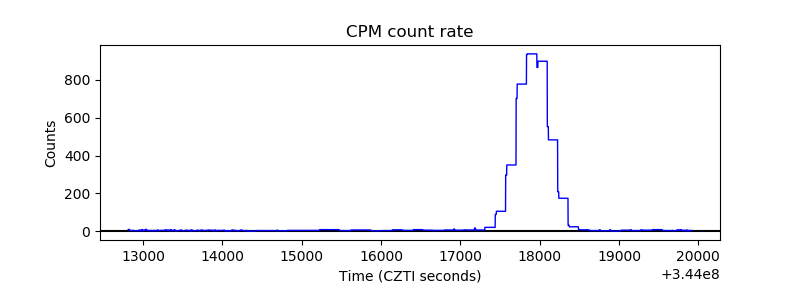 |
| CZT Counter | 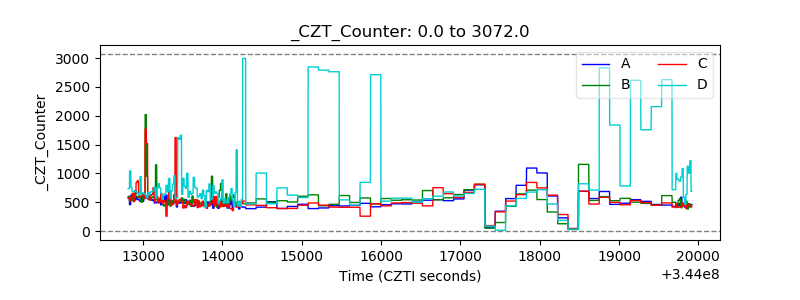 |
| +2.5 Volts monitor |  |
| +5 Volts monitor |  |
| _ROLL_ROT | 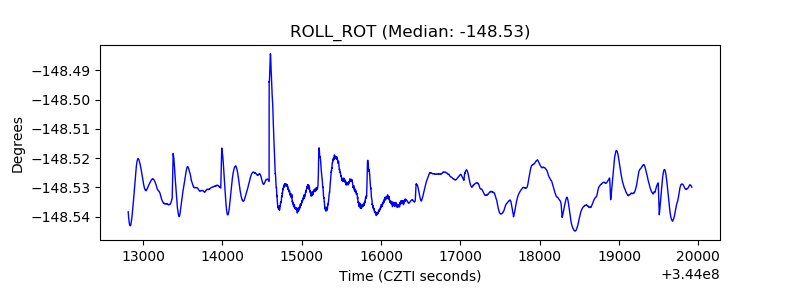 |
| _Roll_DEC | 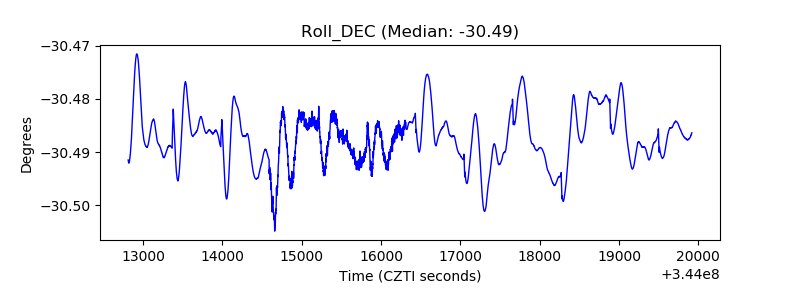 |
| _Roll_RA | 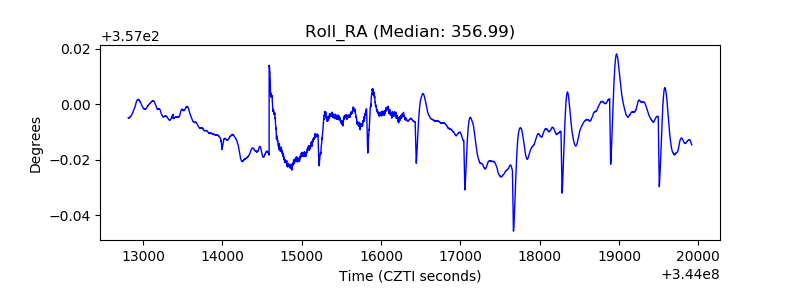 |
| Veto Counter | 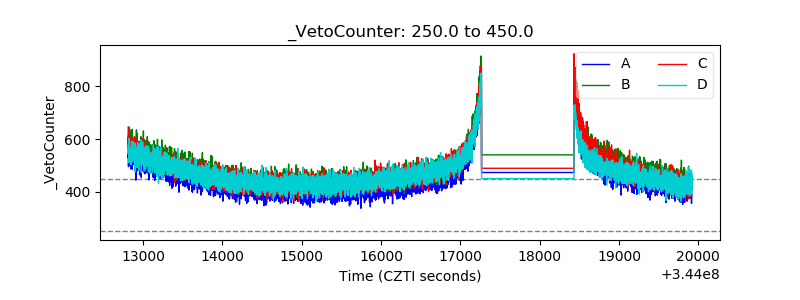 |