| Param | Original file | Final file |
|---|---|---|
| Filename | modeM0/AS1A10_048T06_9000004030_27910cztM0_level2.evt | modeM0/AS1A10_048T06_9000004030_27910cztM0_level2_quad_clean.evt |
| Size (bytes) | 593,706,240 | 89,481,600 |
| Size | 566.2 MB | 85.3 MB |
| Events in quadrant A | 3,460,344 | 597,382 |
| Events in quadrant B | 3,655,337 | 602,448 |
| Events in quadrant C | 3,150,789 | 567,726 |
| Events in quadrant D | 7,273,688 | 488,305 |
| Mode M0 | |||
|---|---|---|---|
| Quadrant | BADHDUFLAG | Total packets | Discarded packets |
| A | 0 | 14458 | 0 |
| B | 0 | 15080 | 0 |
| C | 0 | 13589 | 0 |
| D | 0 | 26317 | 0 |
| Mode M9 | |||
|---|---|---|---|
| Quadrant | BADHDUFLAG | Total packets | Discarded packets |
| A | 0 | 9 | 0 |
| B | 0 | 9 | 0 |
| C | 0 | 9 | 0 |
| D | 0 | 9 | 0 |
| Quadrant | Total seconds | Saturated seconds | Saturation percentage |
|---|---|---|---|
| A | 6499 | 78 | 1.200185% |
| B | 6500 | 130 | 2.000000% |
| C | 6499 | 69 | 1.061702% |
| D | 6499 | 1033 | 15.894753% |
Noise dominated data is calculated using 1-second bins in cleaned event files. If a bin has >2000 counts, and if more than 50% of those come from <1% of pixels, then it is considered to be noise-dominated and hence unusable.
| Quadrant | # 1 sec bins | Bins with >0 counts | Bins with >2000 counts | High rate bins dominated by noise | Noise dominated (total time) | Noise dominated (detector-on time) | Marked lightcurve |
|---|---|---|---|---|---|---|---|
| A | 7384 | 6500 | 63 | 63 | 0.85% | 0.97% | 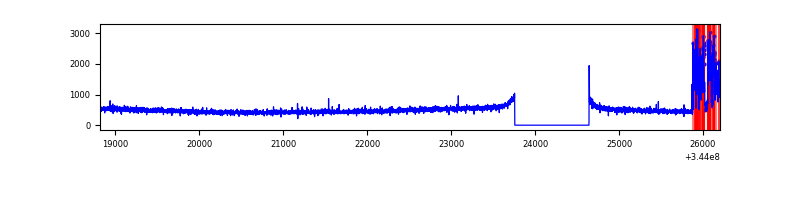 |
| B | 7385 | 6501 | 12 | 12 | 0.16% | 0.18% | 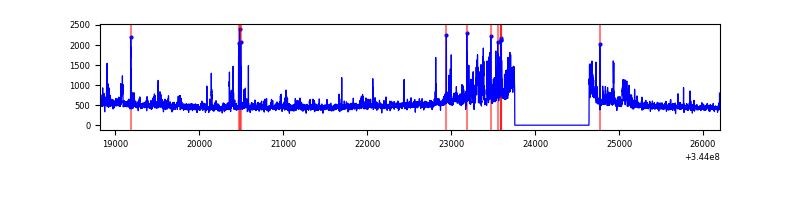 |
| C | 7384 | 6500 | 0 | 0 | 0.00% | 0.00% |  |
| D | 7384 | 6500 | 935 | 935 | 12.66% | 14.38% |  |
Top three noisy pixels from each quadrant. If the there are fewer than three noisy pixels in the level2.evt file, extra rows are filled as -1
| Pixel properties | Quadrant properties | ||||||
|---|---|---|---|---|---|---|---|
| Quadrant | DetID | PixID | Counts | Sigma | Mean | Median | Sigma |
| A | 6 | 16 | 346203 | 2119.18 | 805 | 789 | 163.0 |
| A | 13 | 254 | 11800 | 67.55 | 805 | 789 | 163.0 |
| A | 3 | 137 | 7569 | 41.6 | 805 | 789 | 163.0 |
| B | 10 | 245 | 436937 | 2859.3 | 800 | 781 | 152.5 |
| B | 0 | 230 | 46862 | 302.09 | 800 | 781 | 152.5 |
| B | 12 | 111 | 18740 | 117.73 | 800 | 781 | 152.5 |
| C | 14 | 238 | 123572 | 688.01 | 760 | 767 | 178.5 |
| C | 3 | 233 | 43388 | 238.78 | 760 | 767 | 178.5 |
| C | 15 | 208 | 16823 | 89.95 | 760 | 767 | 178.5 |
| D | 1 | 52 | 3136026 | 18460.63 | 710 | 692 | 169.8 |
| D | 8 | 195 | 1014471 | 5969.06 | 710 | 692 | 169.8 |
| D | 7 | 69 | 245282 | 1440.13 | 710 | 692 | 169.8 |
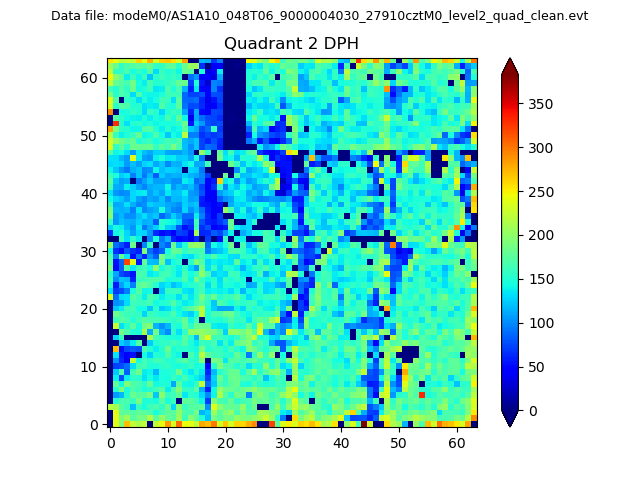
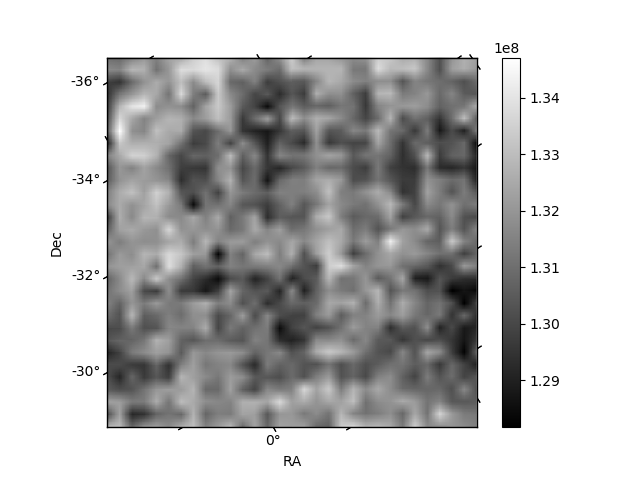
Histogram calculated using DETX and DETY for each event in the final _common_clean file
| Quadrant A | 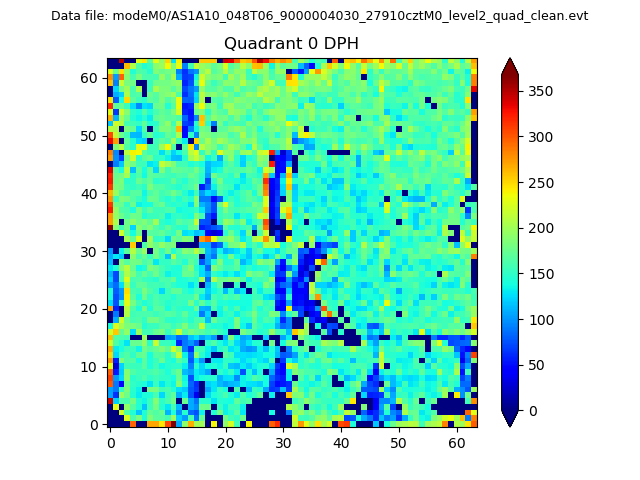 |
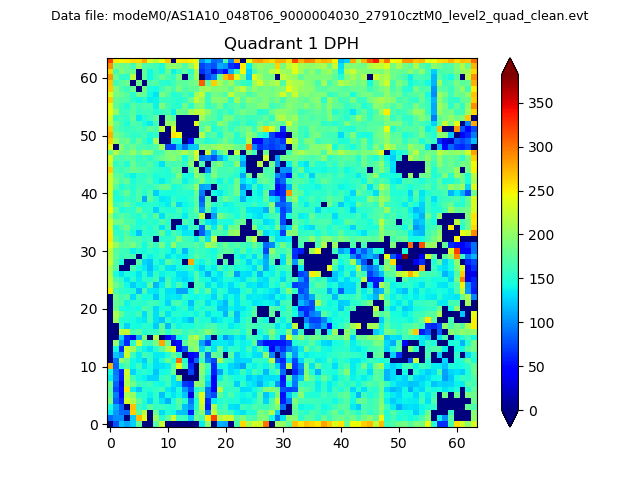 |
Quadrant B |
|---|---|---|---|
| Quadrant D | 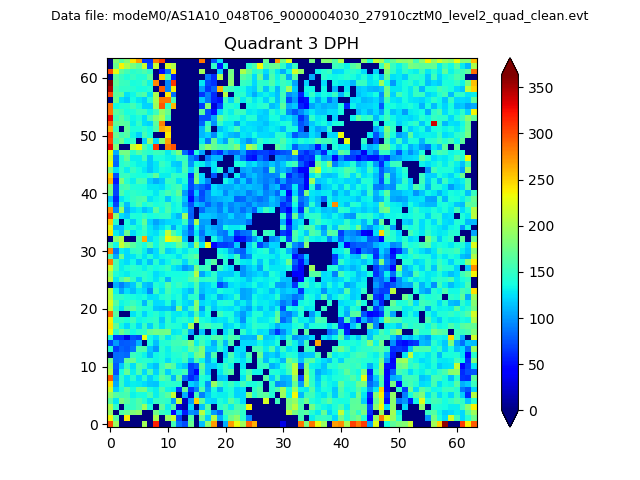 |
 |
Quadrant C |
| Plot type | Count rate plots | Images |
|---|---|---|
| Comparison with Poisson distribution Blue bars denote a histogram of data divided into 1 sec bins. Red curve is a Poisson curve with rate = median count rate of data. |
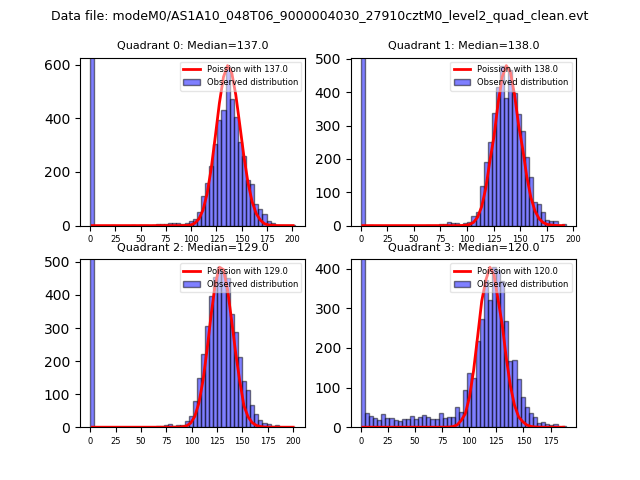 |
 |
| Quadrant-wise count rates Data is divided into 100 sec bins |
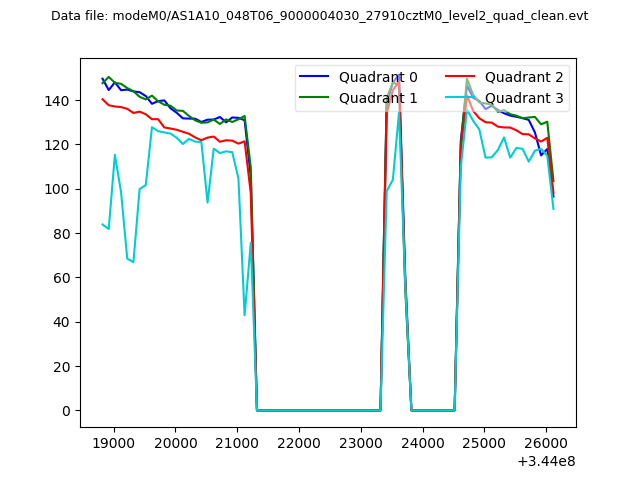 |
|
| Module-wise count rates for Quadrant A Data is divided into 100 sec bins |
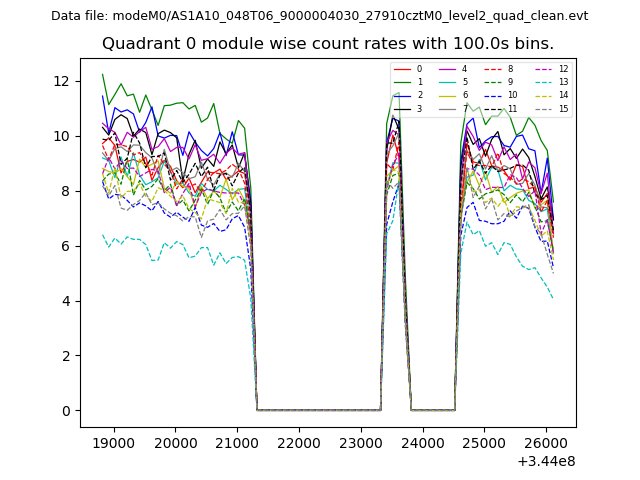 |
 |
| Module-wise count rates for Quadrant B Data is divided into 100 sec bins |
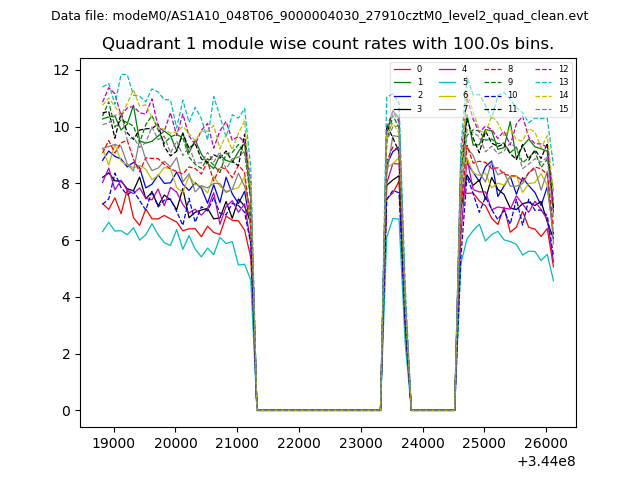 |
 |
| Module-wise count rates for Quadrant C Data is divided into 100 sec bins |
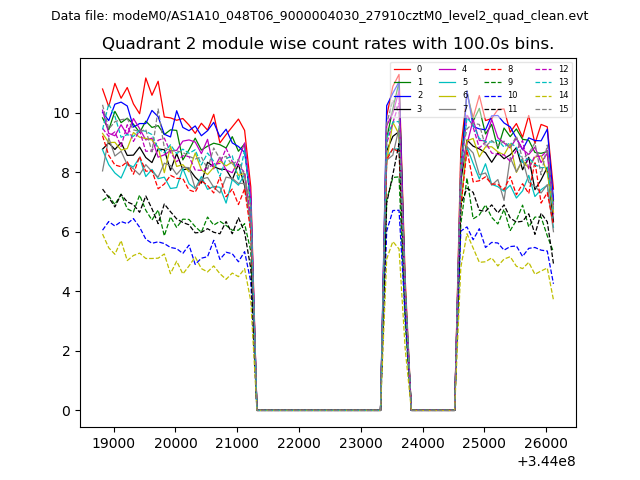 |
 |
| Module-wise count rates for Quadrant D Data is divided into 100 sec bins |
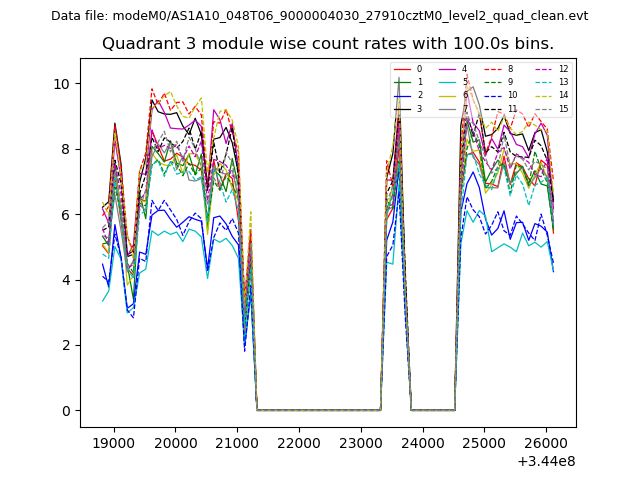 |
 |
| Parameter | Plot |
|---|---|
| CZT HV Monitor | 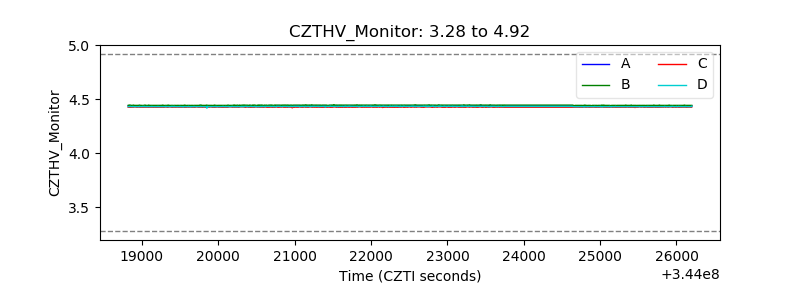 |
| D_VDD | 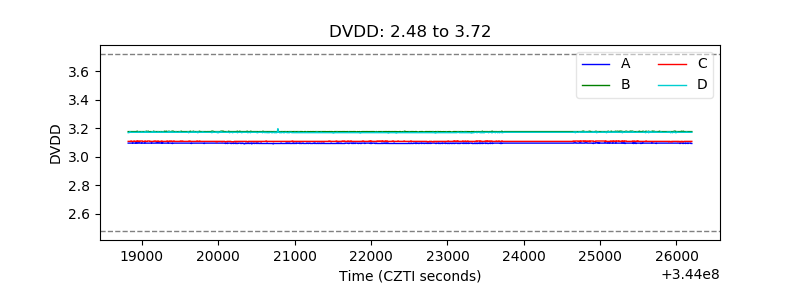 |
| Temperature 1 | 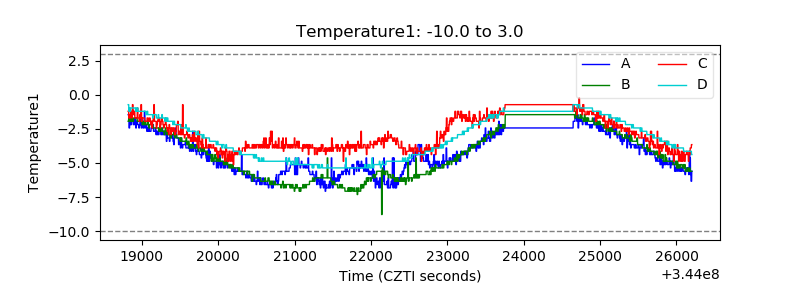 |
| Veto HV Monitor | 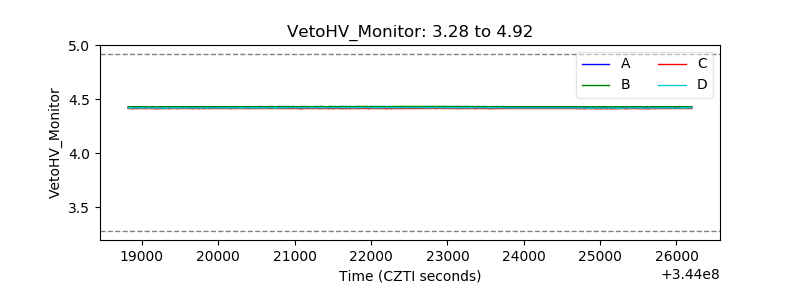 |
| Veto LLD | 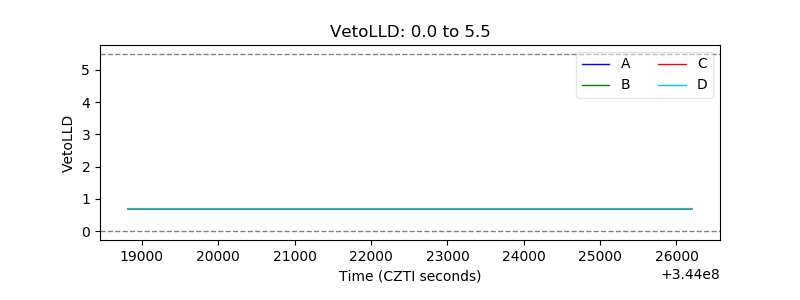 |
| Alpha Counter | 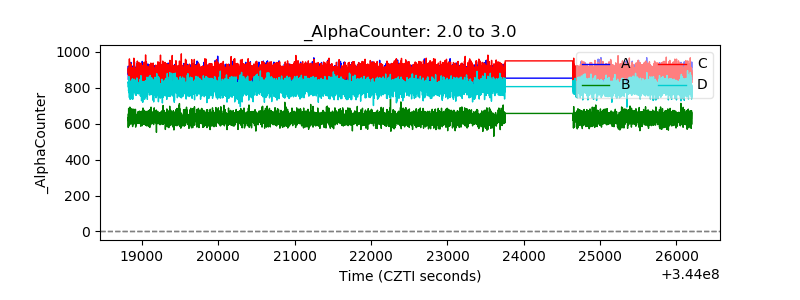 |
| _CPM_Rate | 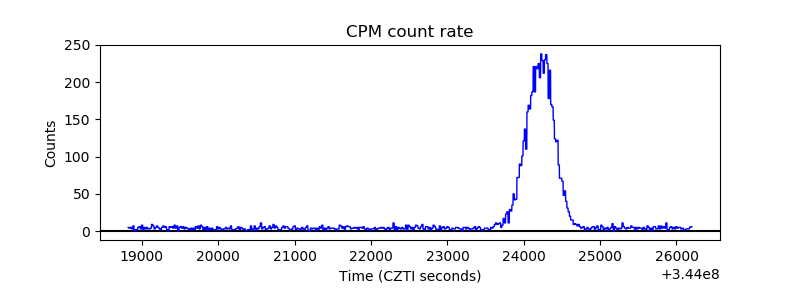 |
| CZT Counter | 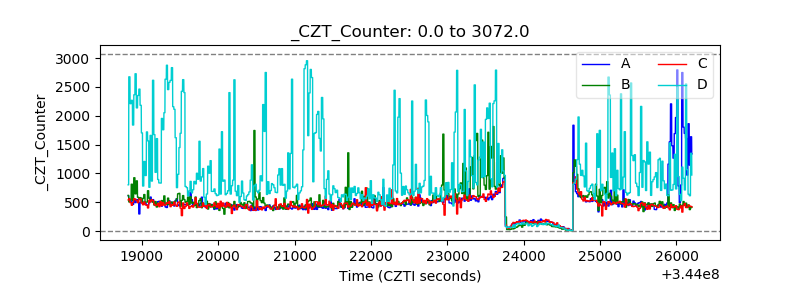 |
| +2.5 Volts monitor |  |
| +5 Volts monitor |  |
| _ROLL_ROT | 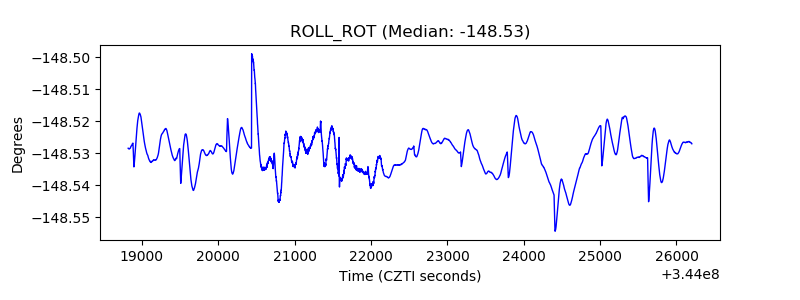 |
| _Roll_DEC | 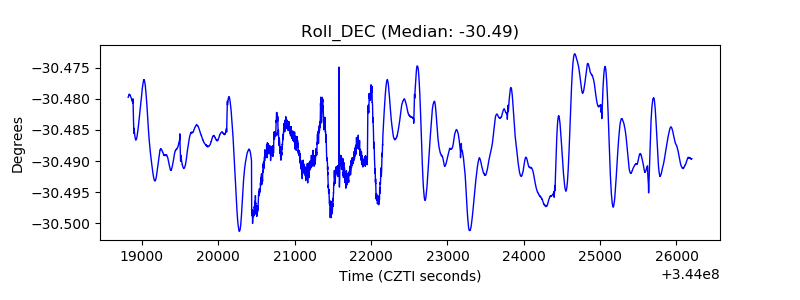 |
| _Roll_RA | 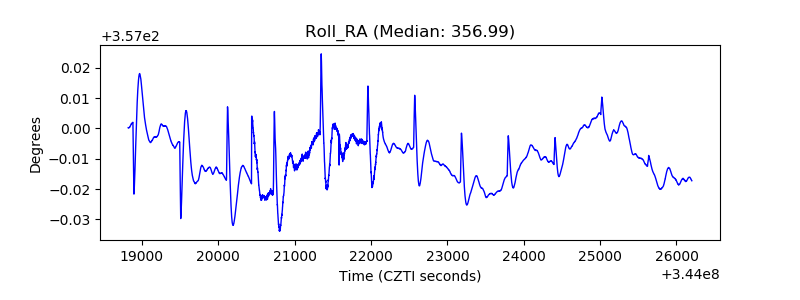 |
| Veto Counter | 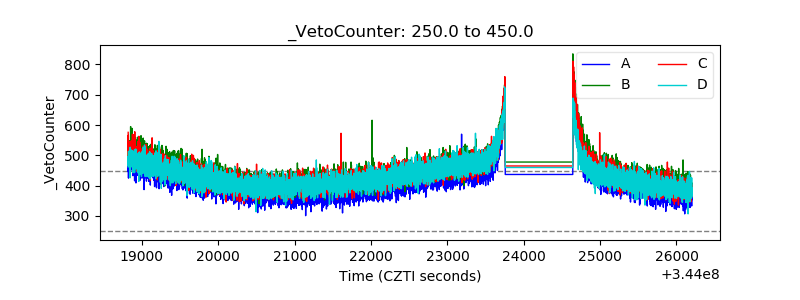 |