| Param | Original file | Final file |
|---|---|---|
| Filename | modeM0/AS1A10_048T06_9000004030_27911cztM0_level2.evt | modeM0/AS1A10_048T06_9000004030_27911cztM0_level2_quad_clean.evt |
| Size (bytes) | 658,198,080 | 102,147,840 |
| Size | 627.7 MB | 97.4 MB |
| Events in quadrant A | 4,085,185 | 669,973 |
| Events in quadrant B | 3,932,499 | 683,087 |
| Events in quadrant C | 3,485,287 | 645,909 |
| Events in quadrant D | 7,942,410 | 591,663 |
| Mode M0 | |||
|---|---|---|---|
| Quadrant | BADHDUFLAG | Total packets | Discarded packets |
| A | 0 | 16821 | 0 |
| B | 0 | 16362 | 0 |
| C | 0 | 15002 | 0 |
| D | 0 | 28825 | 0 |
| Mode M9 | |||
|---|---|---|---|
| Quadrant | BADHDUFLAG | Total packets | Discarded packets |
| A | 0 | 4 | 0 |
| B | 0 | 5 | 0 |
| C | 0 | 5 | 0 |
| D | 0 | 5 | 0 |
| Quadrant | Total seconds | Saturated seconds | Saturation percentage |
|---|---|---|---|
| A | 7212 | 197 | 2.731559% |
| B | 7212 | 120 | 1.663894% |
| C | 7211 | 105 | 1.456109% |
| D | 7211 | 897 | 12.439329% |
Noise dominated data is calculated using 1-second bins in cleaned event files. If a bin has >2000 counts, and if more than 50% of those come from <1% of pixels, then it is considered to be noise-dominated and hence unusable.
| Quadrant | # 1 sec bins | Bins with >0 counts | Bins with >2000 counts | High rate bins dominated by noise | Noise dominated (total time) | Noise dominated (detector-on time) | Marked lightcurve |
|---|---|---|---|---|---|---|---|
| A | 7647 | 7213 | 175 | 175 | 2.29% | 2.43% | 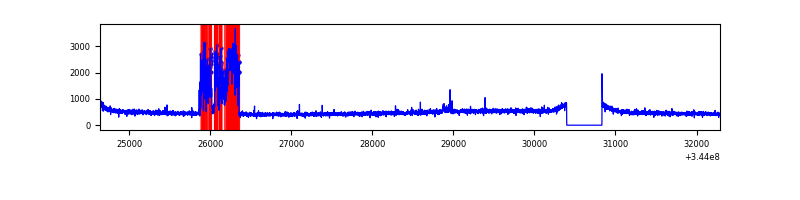 |
| B | 7647 | 7213 | 6 | 6 | 0.08% | 0.08% | 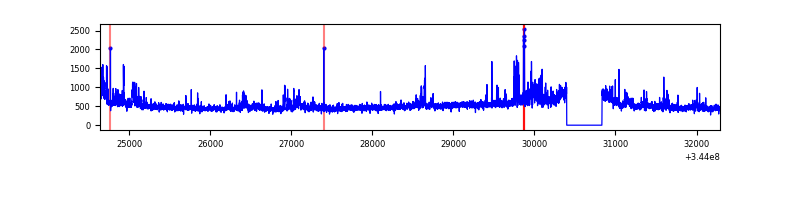 |
| C | 7646 | 7211 | 0 | 0 | 0.00% | 0.00% |  |
| D | 7646 | 7212 | 861 | 861 | 11.26% | 11.94% | 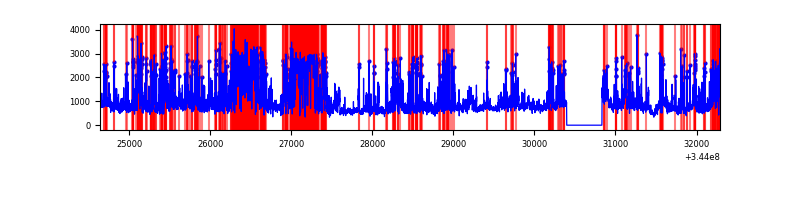 |
Top three noisy pixels from each quadrant. If the there are fewer than three noisy pixels in the level2.evt file, extra rows are filled as -1
| Pixel properties | Quadrant properties | ||||||
|---|---|---|---|---|---|---|---|
| Quadrant | DetID | PixID | Counts | Sigma | Mean | Median | Sigma |
| A | 6 | 16 | 645573 | 3626.52 | 883 | 863 | 177.8 |
| A | 15 | 174 | 19599 | 105.39 | 883 | 863 | 177.8 |
| A | 13 | 254 | 13409 | 70.57 | 883 | 863 | 177.8 |
| B | 10 | 245 | 310301 | 1811.95 | 884 | 861 | 170.8 |
| B | 0 | 230 | 123545 | 718.39 | 884 | 861 | 170.8 |
| B | 12 | 111 | 20712 | 116.24 | 884 | 861 | 170.8 |
| C | 14 | 238 | 133667 | 673.13 | 839 | 844 | 197.3 |
| C | 3 | 233 | 69258 | 346.71 | 839 | 844 | 197.3 |
| C | 15 | 208 | 7640 | 34.44 | 839 | 844 | 197.3 |
| D | 1 | 52 | 2954258 | 15230.99 | 811 | 789 | 193.9 |
| D | 8 | 195 | 1136524 | 5856.97 | 811 | 789 | 193.9 |
| D | 7 | 69 | 316677 | 1629.03 | 811 | 789 | 193.9 |
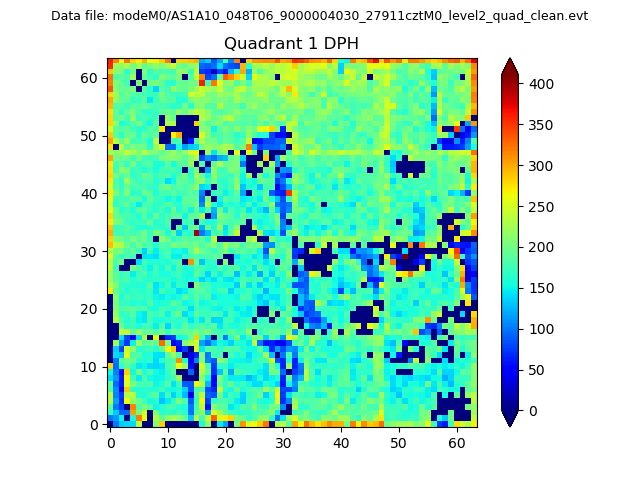
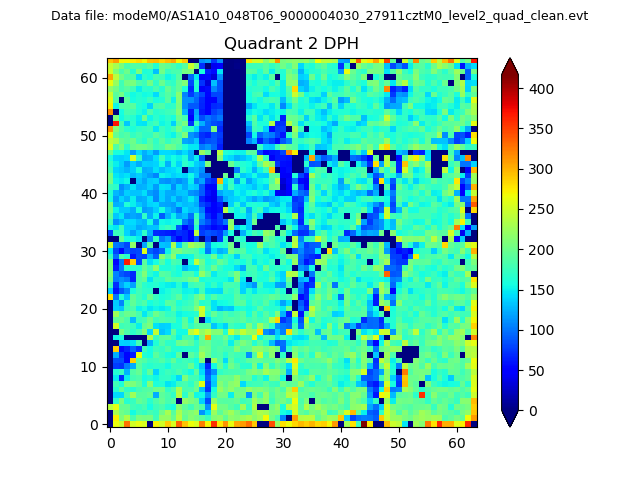
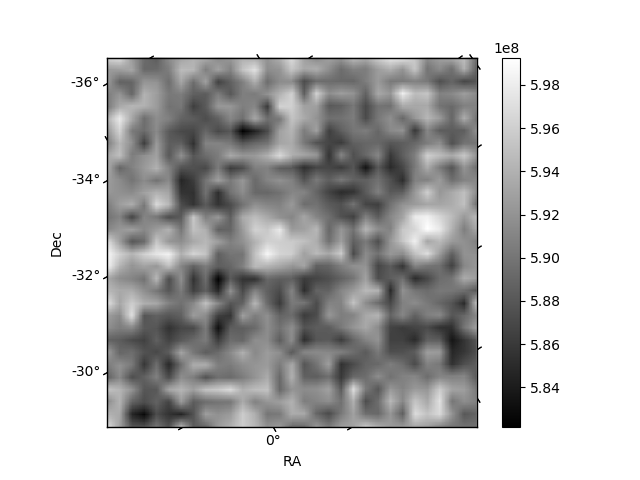
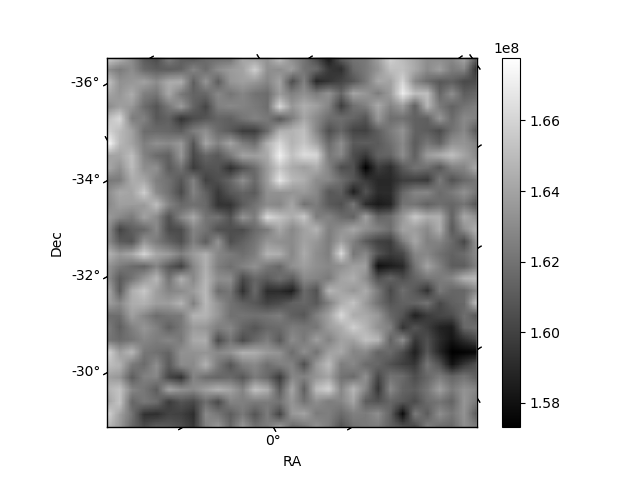
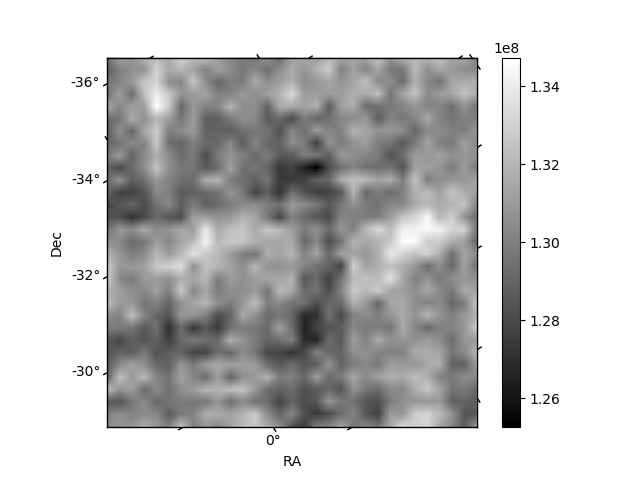
Histogram calculated using DETX and DETY for each event in the final _common_clean file
| Quadrant A | 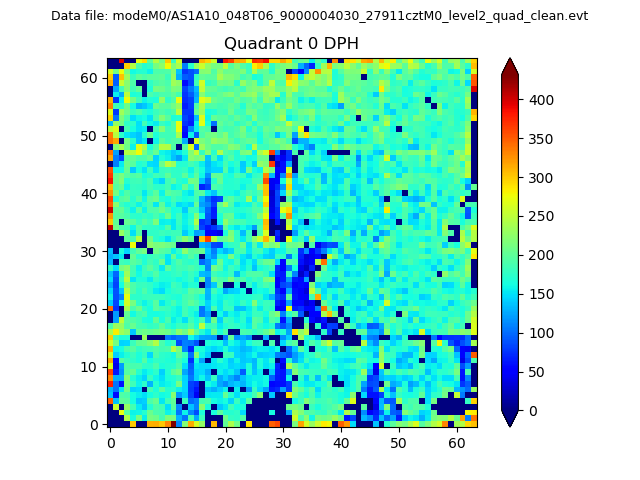 |
 |
Quadrant B |
|---|---|---|---|
| Quadrant D | 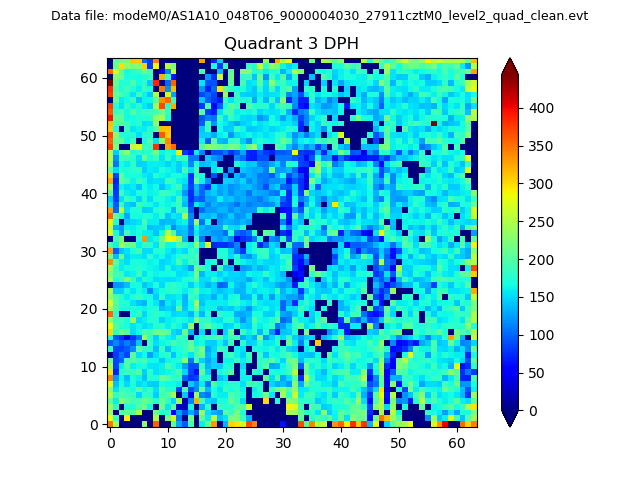 |
 |
Quadrant C |
| Plot type | Count rate plots | Images |
|---|---|---|
| Comparison with Poisson distribution Blue bars denote a histogram of data divided into 1 sec bins. Red curve is a Poisson curve with rate = median count rate of data. |
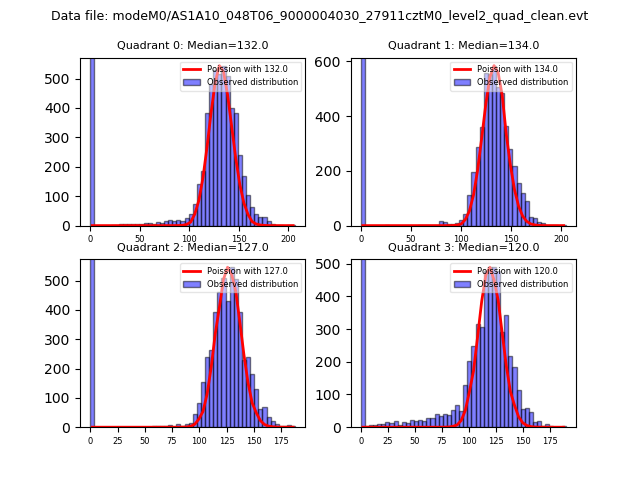 |
 |
| Quadrant-wise count rates Data is divided into 100 sec bins |
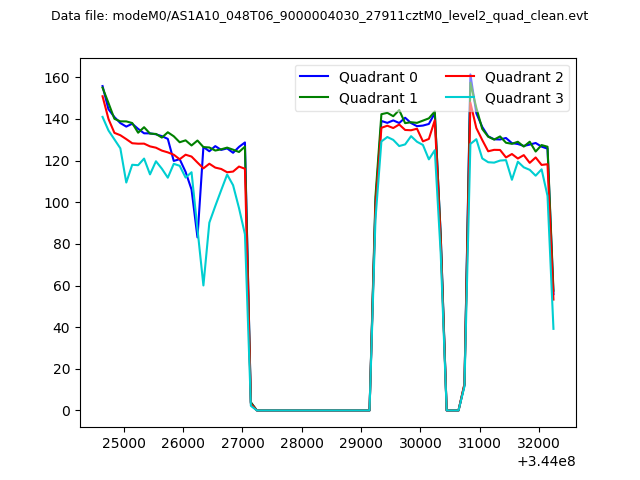 |
|
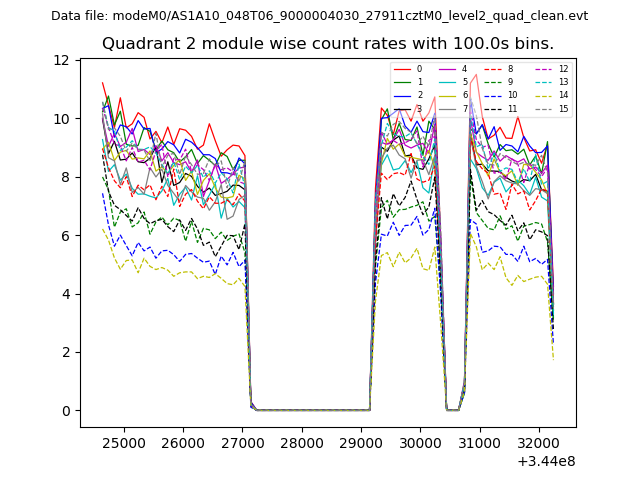
| Module-wise count rates for Quadrant A Data is divided into 100 sec bins |
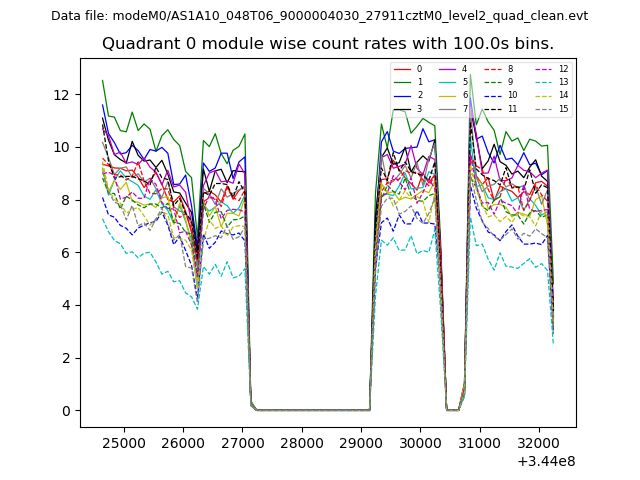 |
 |
| Module-wise count rates for Quadrant B Data is divided into 100 sec bins |
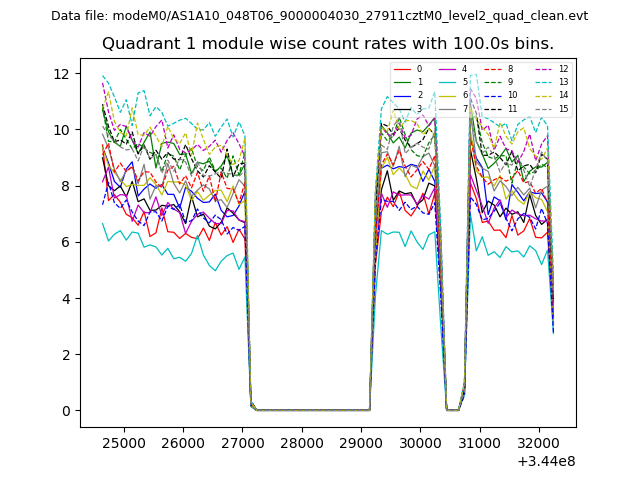 |
 |
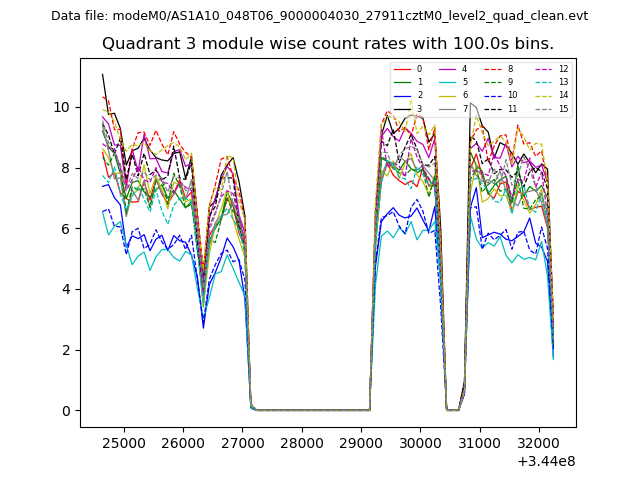
| Module-wise count rates for Quadrant C Data is divided into 100 sec bins |
 |
 |
| Module-wise count rates for Quadrant D Data is divided into 100 sec bins |
 |
 |
| Parameter | Plot |
|---|---|
| CZT HV Monitor | 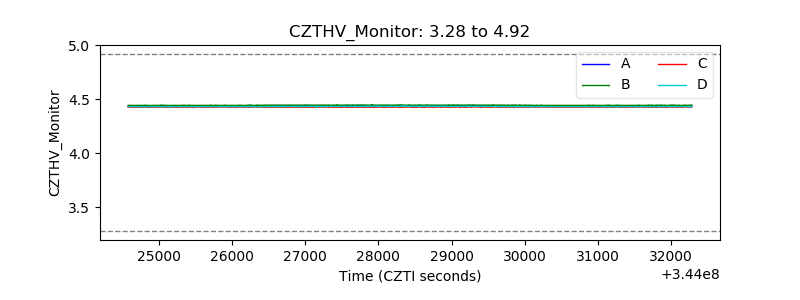 |
| D_VDD | 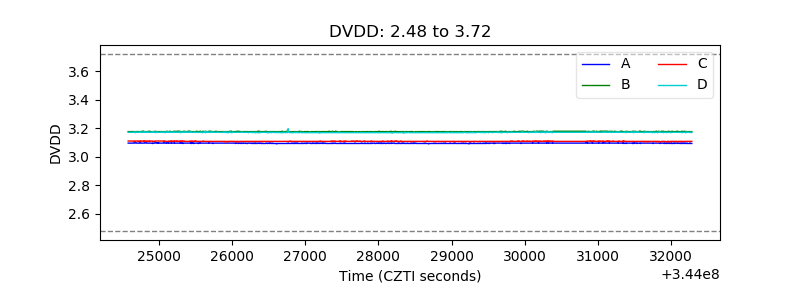 |
| Temperature 1 | 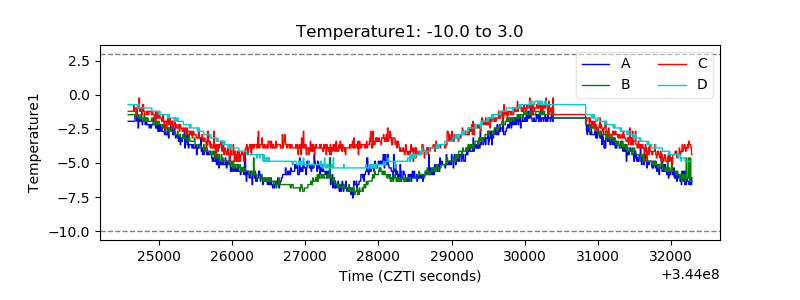 |
| Veto HV Monitor | 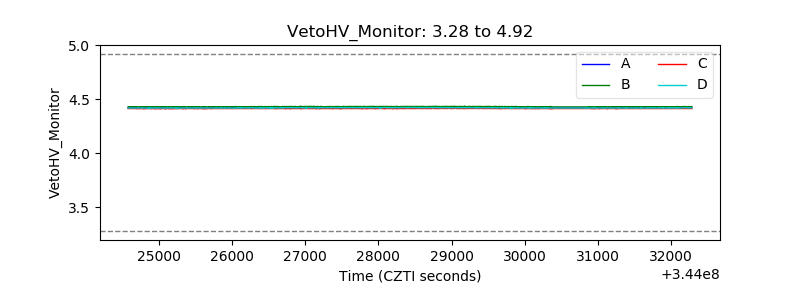 |
| Veto LLD | 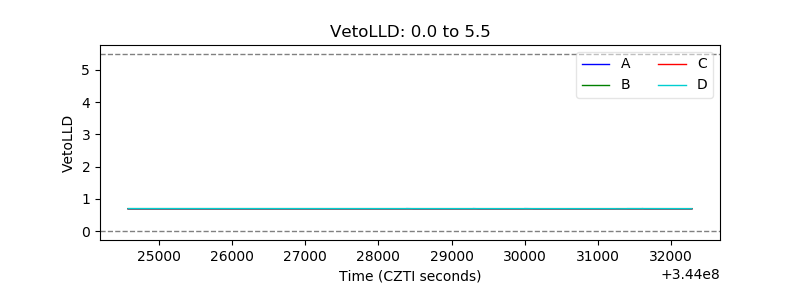 |
| Alpha Counter | 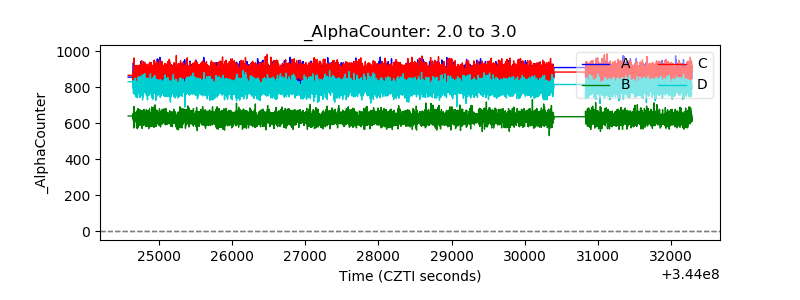 |
| _CPM_Rate | 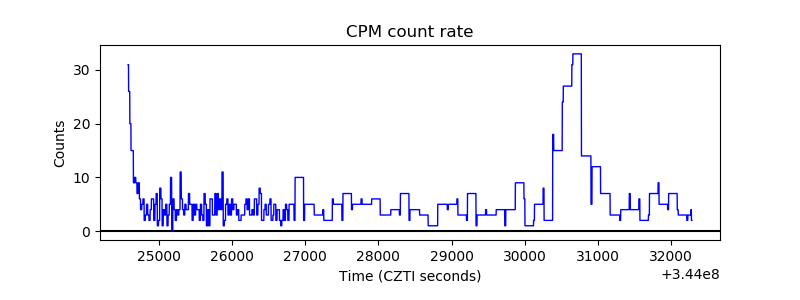 |
| CZT Counter | 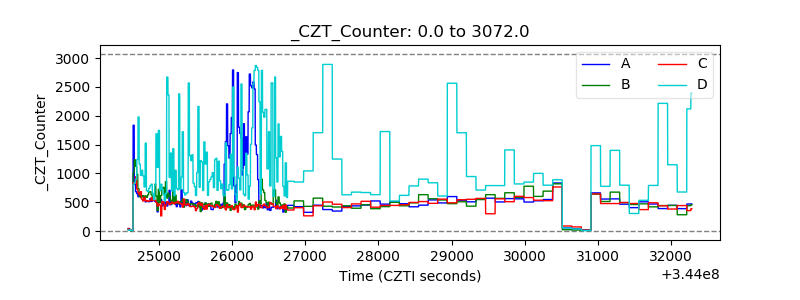 |
| +2.5 Volts monitor |  |
| +5 Volts monitor |  |
| _ROLL_ROT | 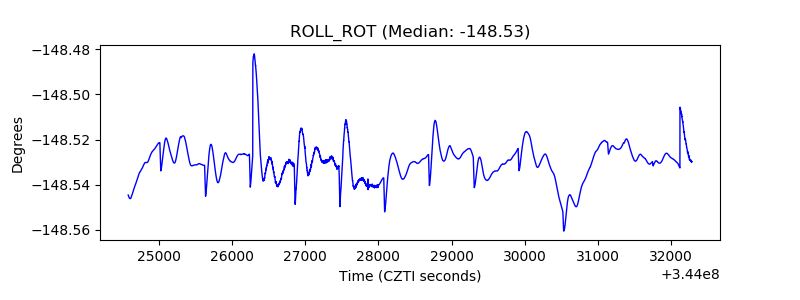 |
| _Roll_DEC | 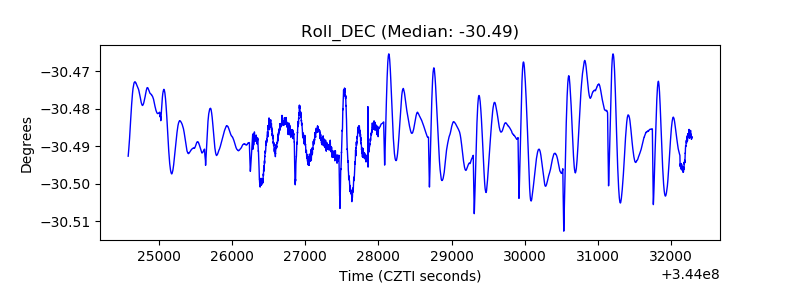 |
| _Roll_RA | 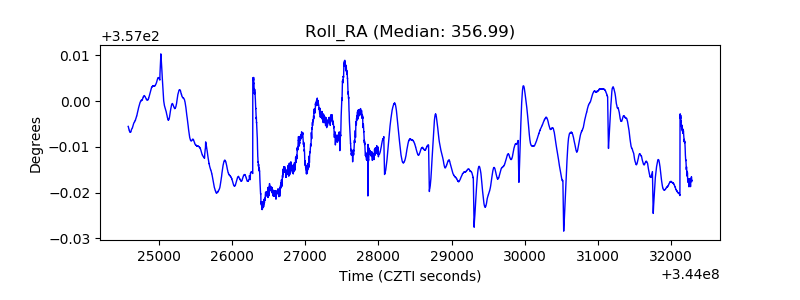 |
| Veto Counter | 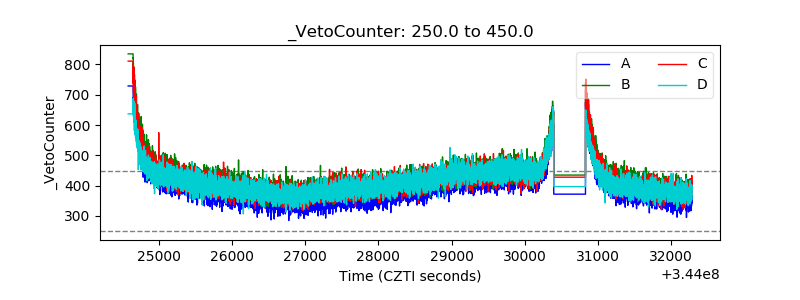 |