| Param | Original file | Final file |
|---|---|---|
| Filename | modeM0/AS1A10_048T06_9000004030_27912cztM0_level2.evt | modeM0/AS1A10_048T06_9000004030_27912cztM0_level2_quad_clean.evt |
| Size (bytes) | 691,344,000 | 120,418,560 |
| Size | 659.3 MB | 114.8 MB |
| Events in quadrant A | 3,935,907 | 804,592 |
| Events in quadrant B | 4,470,604 | 806,987 |
| Events in quadrant C | 4,178,815 | 762,995 |
| Events in quadrant D | 7,793,043 | 698,226 |
| Mode M0 | |||
|---|---|---|---|
| Quadrant | BADHDUFLAG | Total packets | Discarded packets |
| A | 0 | 17159 | 0 |
| B | 0 | 18730 | 0 |
| C | 0 | 17618 | 0 |
| D | 0 | 28800 | 0 |
| Mode M9 | |||
|---|---|---|---|
| Quadrant | BADHDUFLAG | Total packets | Discarded packets |
| A | 0 | 6 | 0 |
| B | 0 | 6 | 0 |
| C | 0 | 6 | 0 |
| D | 0 | 6 | 0 |
| Quadrant | Total seconds | Saturated seconds | Saturation percentage |
|---|---|---|---|
| A | 8261 | 66 | 0.798935% |
| B | 8261 | 158 | 1.912601% |
| C | 8261 | 173 | 2.094177% |
| D | 8261 | 1002 | 12.129282% |
Noise dominated data is calculated using 1-second bins in cleaned event files. If a bin has >2000 counts, and if more than 50% of those come from <1% of pixels, then it is considered to be noise-dominated and hence unusable.
| Quadrant | # 1 sec bins | Bins with >0 counts | Bins with >2000 counts | High rate bins dominated by noise | Noise dominated (total time) | Noise dominated (detector-on time) | Marked lightcurve |
|---|---|---|---|---|---|---|---|
| A | 8841 | 8263 | 1 | 1 | 0.01% | 0.01% | 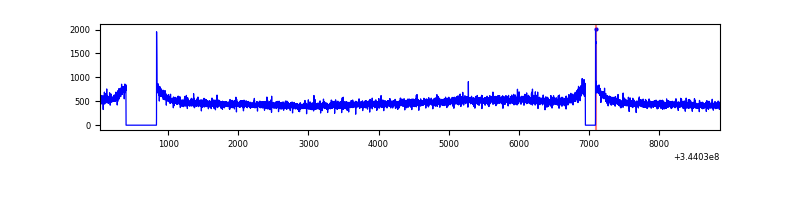 |
| B | 8841 | 8263 | 7 | 7 | 0.08% | 0.08% | 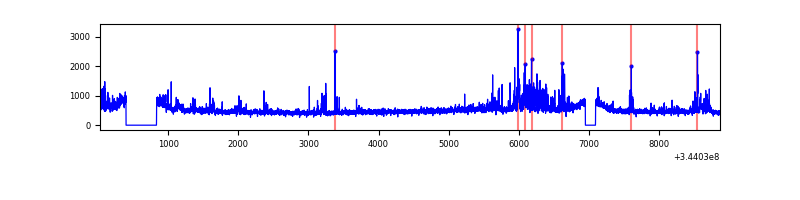 |
| C | 8841 | 8262 | 0 | 0 | 0.00% | 0.00% | 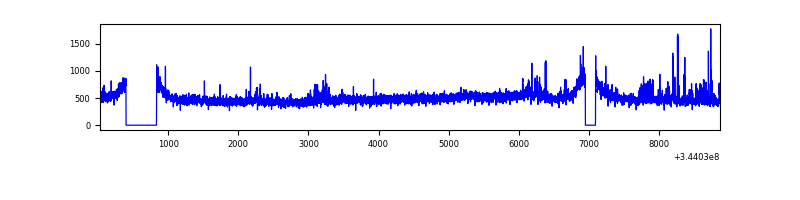 |
| D | 8841 | 8263 | 752 | 752 | 8.51% | 9.10% | 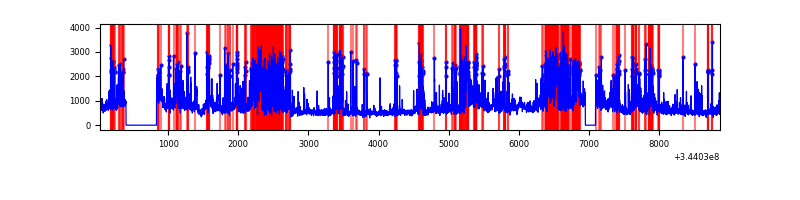 |
Top three noisy pixels from each quadrant. If the there are fewer than three noisy pixels in the level2.evt file, extra rows are filled as -1
| Pixel properties | Quadrant properties | ||||||
|---|---|---|---|---|---|---|---|
| Quadrant | DetID | PixID | Counts | Sigma | Mean | Median | Sigma |
| A | 13 | 254 | 14884 | 67.48 | 1016 | 994 | 205.8 |
| A | 8 | 192 | 11836 | 52.67 | 1016 | 994 | 205.8 |
| A | 3 | 137 | 10078 | 44.13 | 1016 | 994 | 205.8 |
| B | 0 | 230 | 244993 | 1240.41 | 1012 | 985 | 196.7 |
| B | 10 | 245 | 170246 | 860.44 | 1012 | 985 | 196.7 |
| B | 15 | 32 | 30197 | 148.5 | 1012 | 985 | 196.7 |
| C | 3 | 233 | 159039 | 703.73 | 961 | 965 | 224.6 |
| C | 14 | 238 | 153146 | 677.5 | 961 | 965 | 224.6 |
| C | 6 | 112 | 71864 | 315.64 | 961 | 965 | 224.6 |
| D | 1 | 52 | 2226801 | 10096.94 | 926 | 901 | 220.5 |
| D | 8 | 195 | 972209 | 4405.97 | 926 | 901 | 220.5 |
| D | 7 | 238 | 639269 | 2895.71 | 926 | 901 | 220.5 |
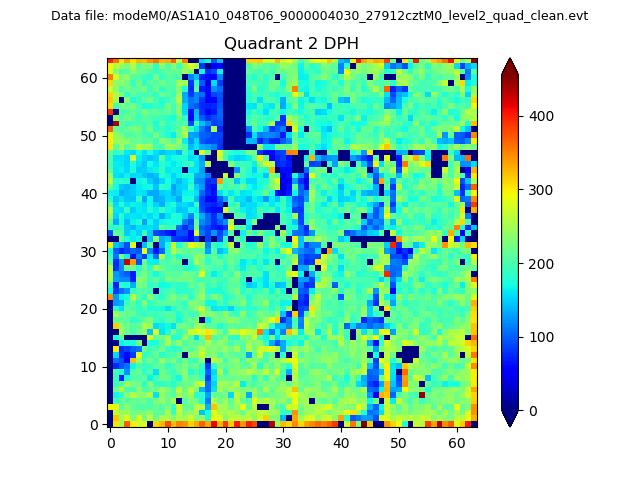
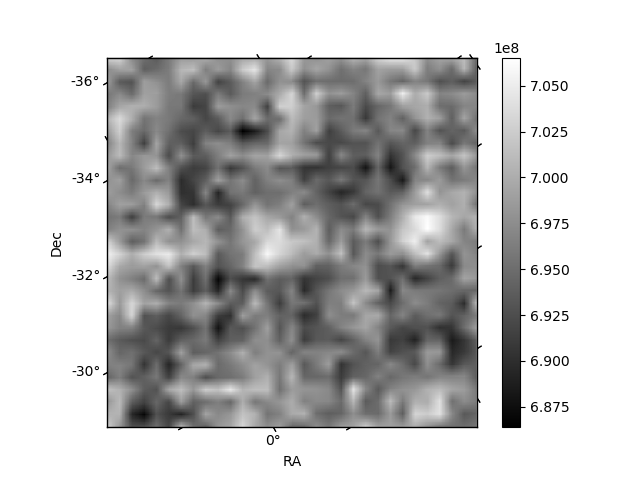
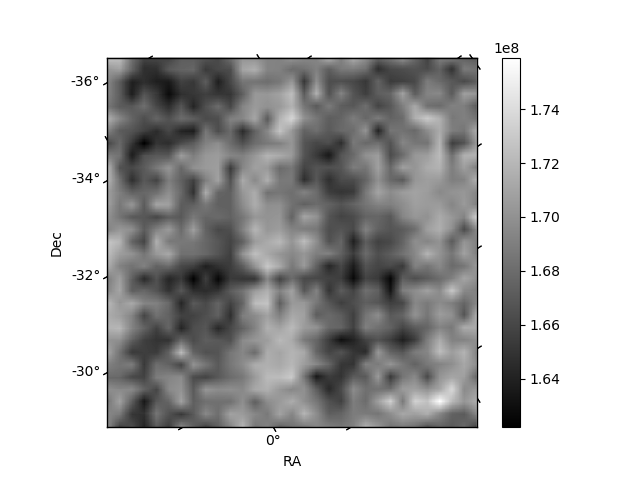
Histogram calculated using DETX and DETY for each event in the final _common_clean file
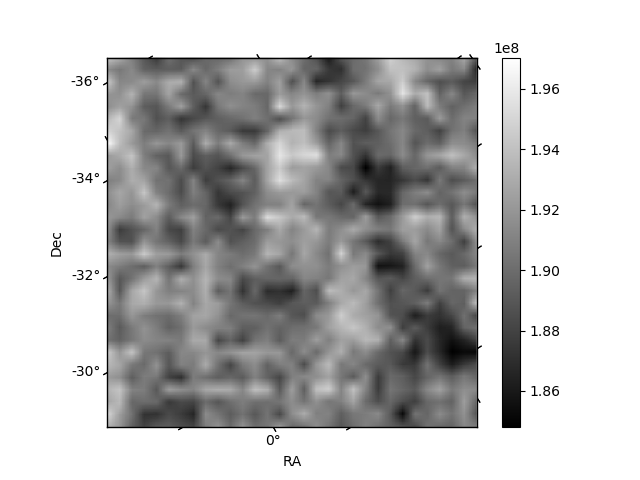
| Quadrant A | 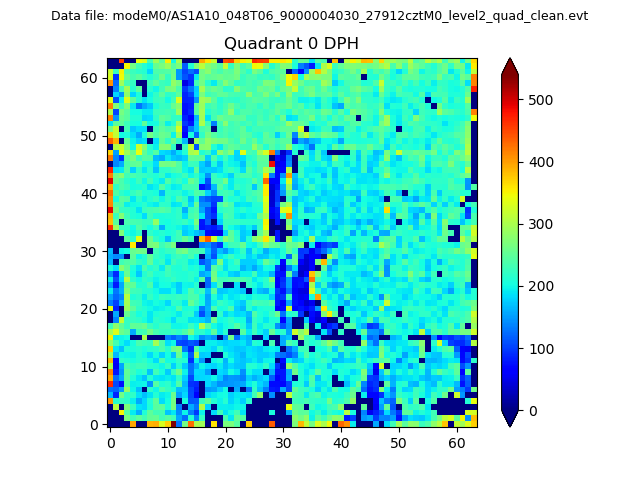 |
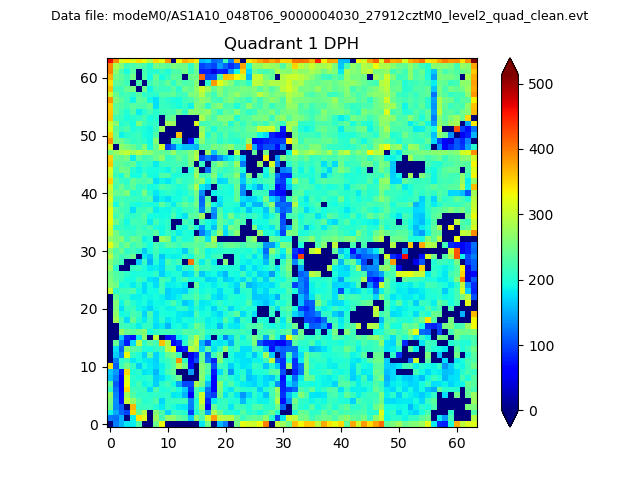 |
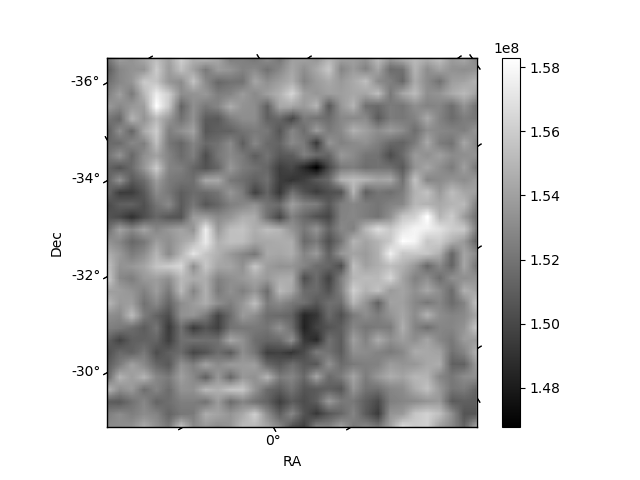
Quadrant B |
|---|---|---|---|
| Quadrant D | 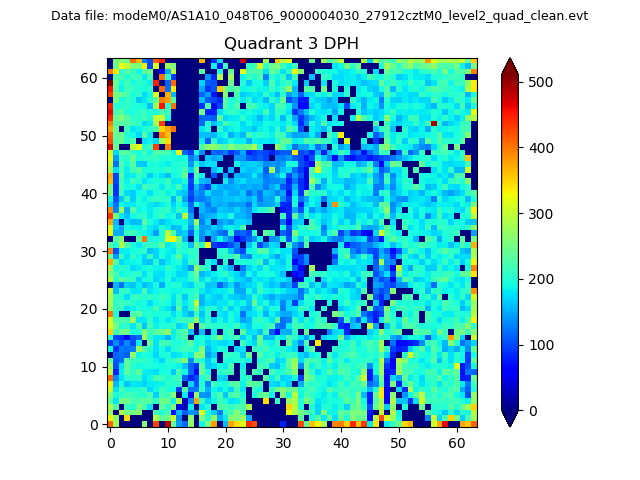 |
 |
Quadrant C |
| Plot type | Count rate plots | Images |
|---|---|---|
| Comparison with Poisson distribution Blue bars denote a histogram of data divided into 1 sec bins. Red curve is a Poisson curve with rate = median count rate of data. |
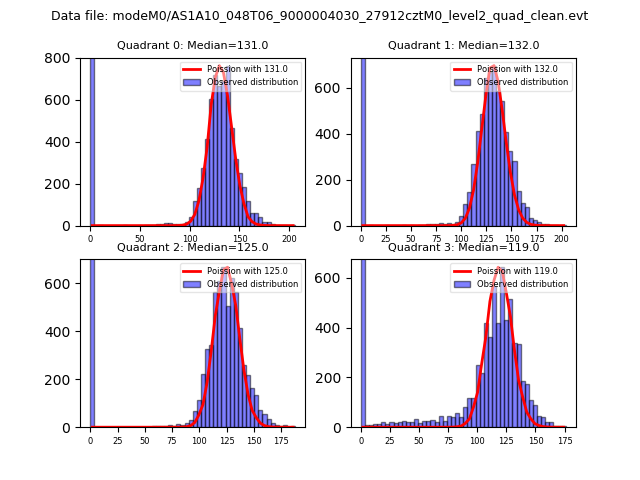 |
 |
| Quadrant-wise count rates Data is divided into 100 sec bins |
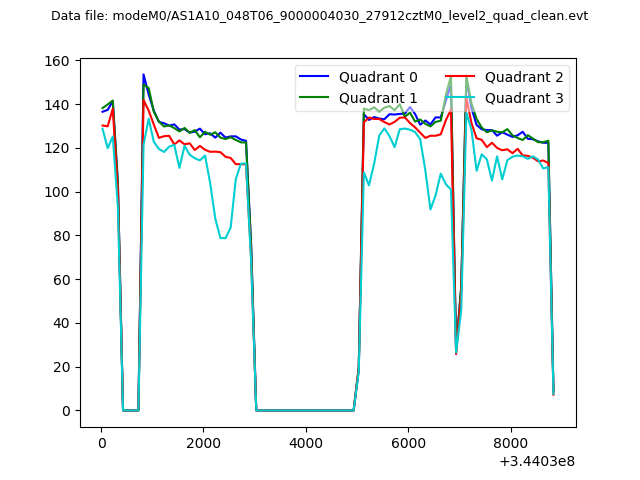 |
|
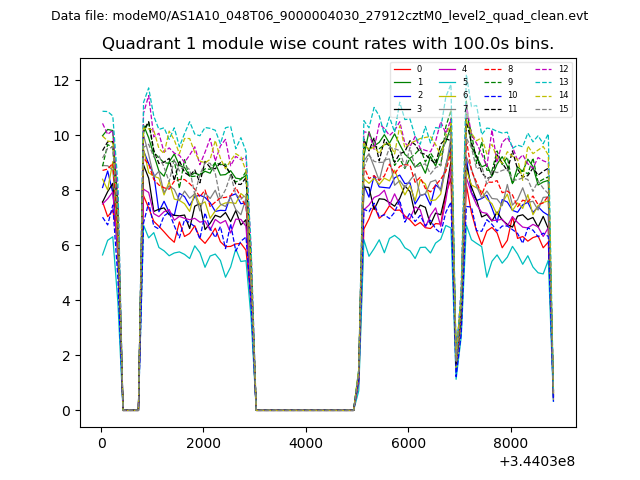
| Module-wise count rates for Quadrant A Data is divided into 100 sec bins |
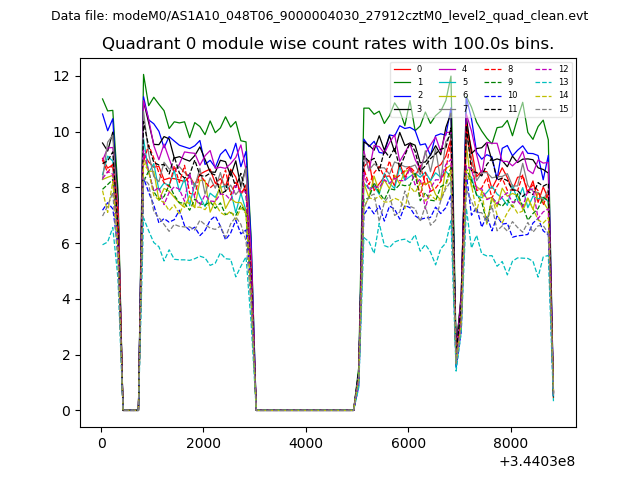 |
 |
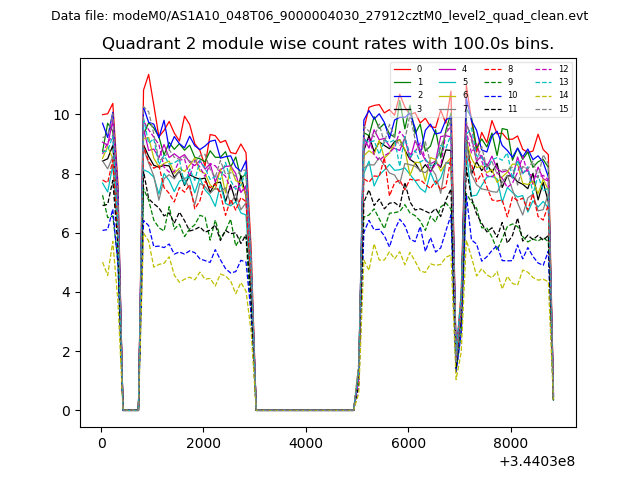
| Module-wise count rates for Quadrant B Data is divided into 100 sec bins |
 |
 |
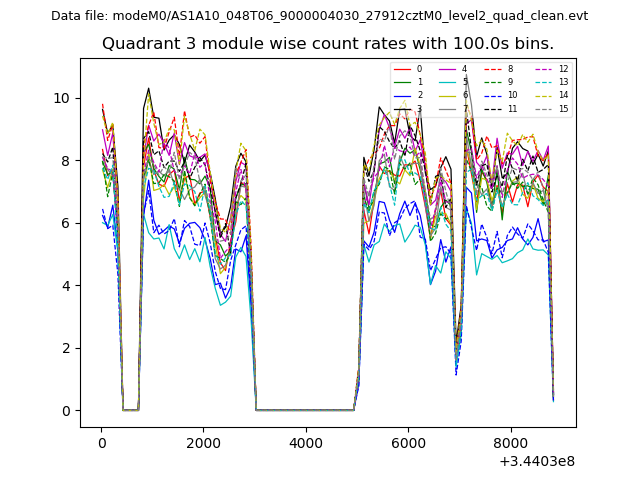
| Module-wise count rates for Quadrant C Data is divided into 100 sec bins |
 |
 |
| Module-wise count rates for Quadrant D Data is divided into 100 sec bins |
 |
 |
| Parameter | Plot |
|---|---|
| CZT HV Monitor | 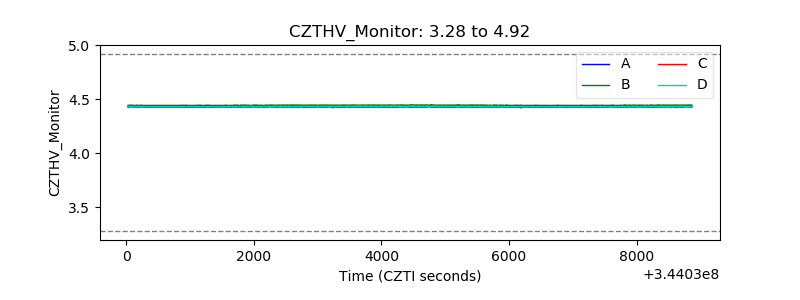 |
| D_VDD | 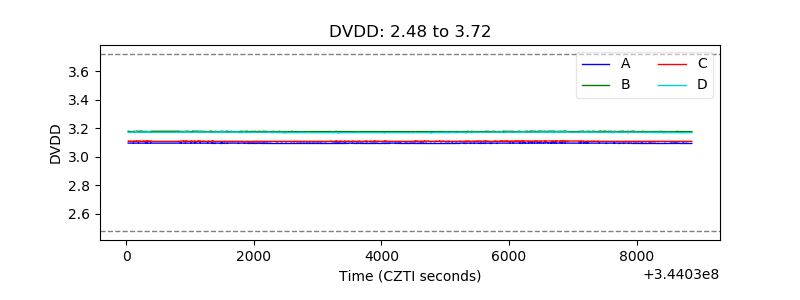 |
| Temperature 1 | 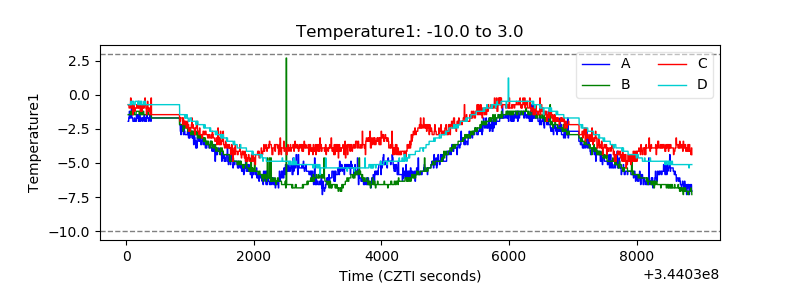 |
| Veto HV Monitor | 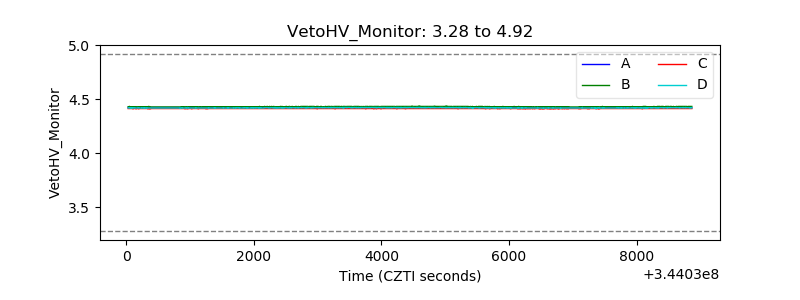 |
| Veto LLD | 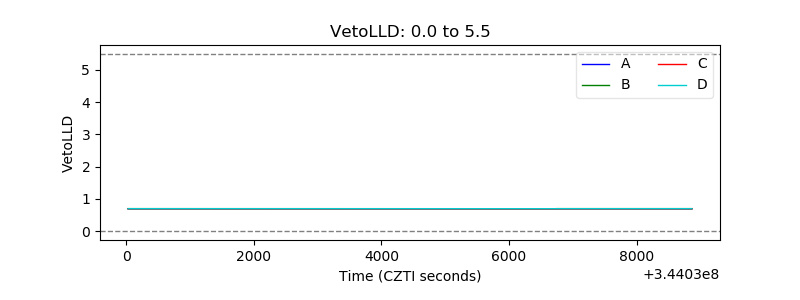 |
| Alpha Counter | 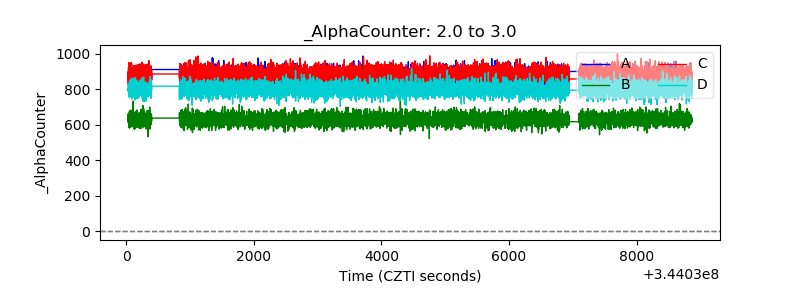 |
| _CPM_Rate | 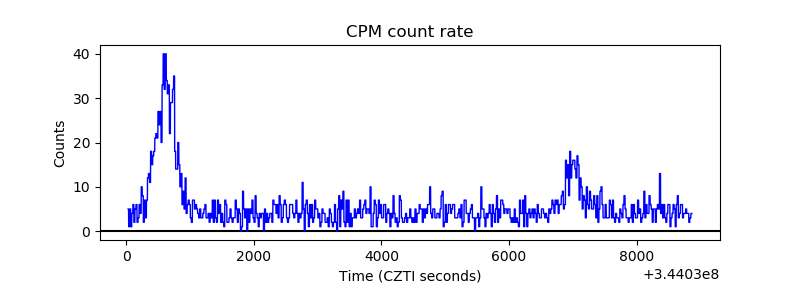 |
| CZT Counter | 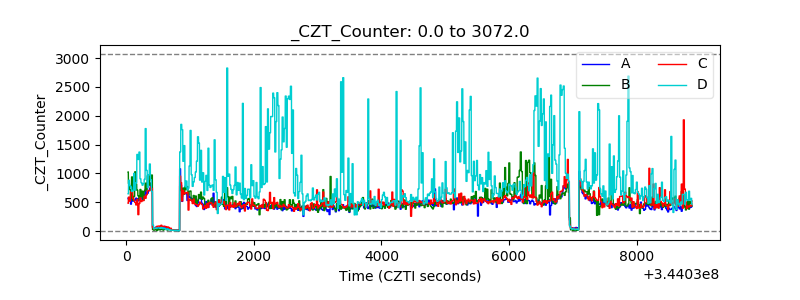 |
| +2.5 Volts monitor |  |
| +5 Volts monitor |  |
| _ROLL_ROT | 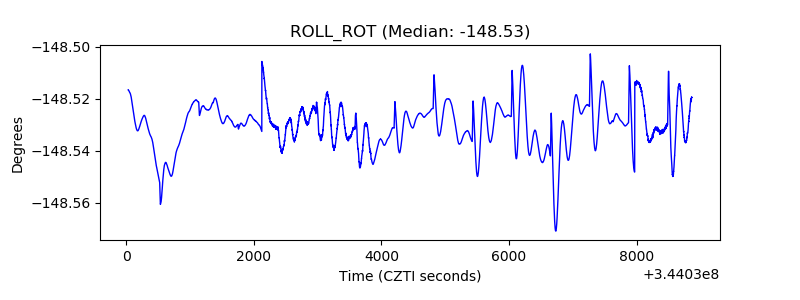 |
| _Roll_DEC | 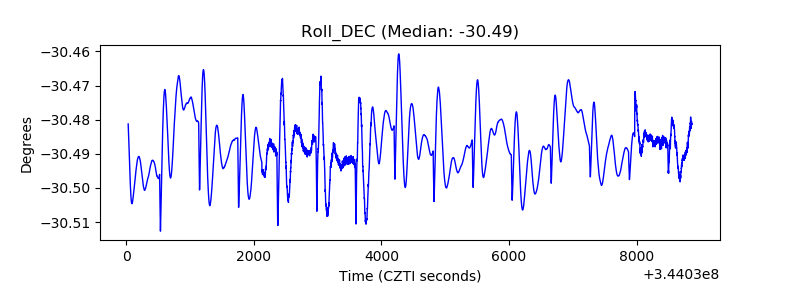 |
| _Roll_RA | 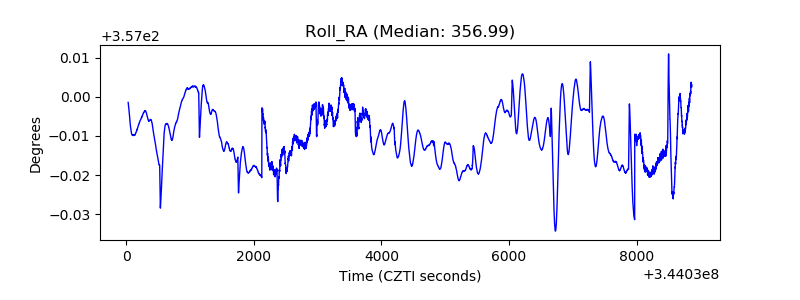 |
| Veto Counter | 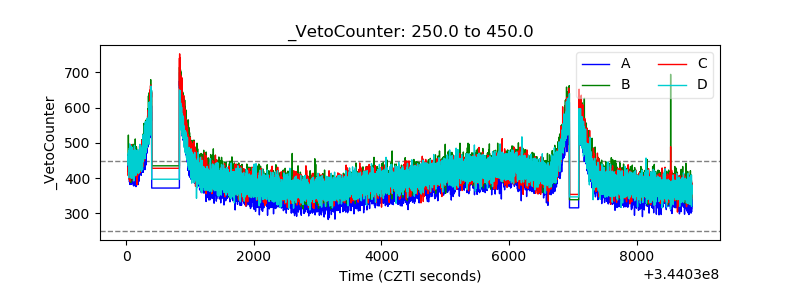 |