| Param | Original file | Final file |
|---|---|---|
| Filename | modeM0/AS1A10_048T06_9000004030_27913cztM0_level2.evt | modeM0/AS1A10_048T06_9000004030_27913cztM0_level2_quad_clean.evt |
| Size (bytes) | 694,958,400 | 116,015,040 |
| Size | 662.8 MB | 110.6 MB |
| Events in quadrant A | 3,982,566 | 765,955 |
| Events in quadrant B | 4,539,547 | 772,124 |
| Events in quadrant C | 4,336,424 | 724,849 |
| Events in quadrant D | 7,620,769 | 667,852 |
| Mode M0 | |||
|---|---|---|---|
| Quadrant | BADHDUFLAG | Total packets | Discarded packets |
| A | 0 | 17402 | 0 |
| B | 0 | 18899 | 0 |
| C | 0 | 18208 | 0 |
| D | 0 | 28390 | 0 |
| Mode M9 | |||
|---|---|---|---|
| Quadrant | BADHDUFLAG | Total packets | Discarded packets |
| A | 0 | 5 | 0 |
| B | 0 | 5 | 0 |
| C | 0 | 5 | 0 |
| D | 0 | 5 | 0 |
| Quadrant | Total seconds | Saturated seconds | Saturation percentage |
|---|---|---|---|
| A | 8389 | 94 | 1.120515% |
| B | 8389 | 170 | 2.026463% |
| C | 8389 | 231 | 2.753606% |
| D | 8390 | 905 | 10.786651% |
Noise dominated data is calculated using 1-second bins in cleaned event files. If a bin has >2000 counts, and if more than 50% of those come from <1% of pixels, then it is considered to be noise-dominated and hence unusable.
| Quadrant | # 1 sec bins | Bins with >0 counts | Bins with >2000 counts | High rate bins dominated by noise | Noise dominated (total time) | Noise dominated (detector-on time) | Marked lightcurve |
|---|---|---|---|---|---|---|---|
| A | 8784 | 8391 | 1 | 1 | 0.01% | 0.01% | 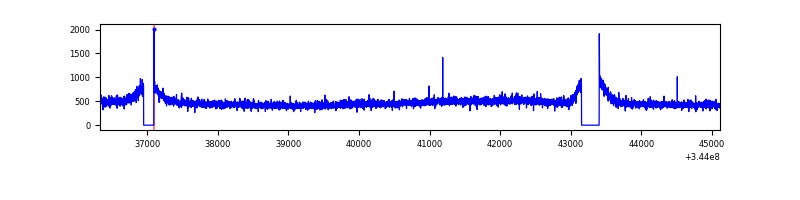 |
| B | 8784 | 8390 | 10 | 10 | 0.11% | 0.12% |  |
| C | 8784 | 8390 | 4 | 4 | 0.05% | 0.05% | 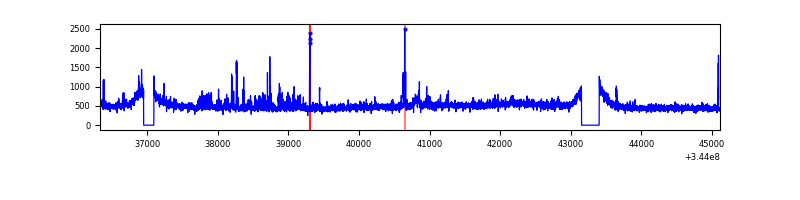 |
| D | 8785 | 8391 | 631 | 631 | 7.18% | 7.52% | 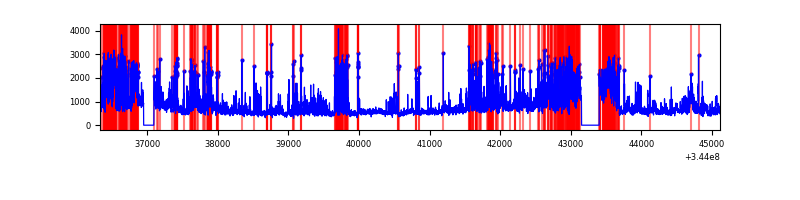 |
Top three noisy pixels from each quadrant. If the there are fewer than three noisy pixels in the level2.evt file, extra rows are filled as -1
| Pixel properties | Quadrant properties | ||||||
|---|---|---|---|---|---|---|---|
| Quadrant | DetID | PixID | Counts | Sigma | Mean | Median | Sigma |
| A | 13 | 254 | 15080 | 67.03 | 1029 | 1004 | 210.0 |
| A | 8 | 192 | 11660 | 50.75 | 1029 | 1004 | 210.0 |
| A | 3 | 137 | 10109 | 43.36 | 1029 | 1004 | 210.0 |
| B | 10 | 245 | 343416 | 1726.86 | 1024 | 995 | 198.3 |
| B | 0 | 230 | 98941 | 493.95 | 1024 | 995 | 198.3 |
| B | 15 | 32 | 38428 | 188.78 | 1024 | 995 | 198.3 |
| C | 3 | 233 | 159445 | 690.01 | 977 | 983 | 229.7 |
| C | 14 | 238 | 155149 | 671.3 | 977 | 983 | 229.7 |
| C | 6 | 112 | 106756 | 460.58 | 977 | 983 | 229.7 |
| D | 1 | 52 | 2764323 | 12138.27 | 943 | 915 | 227.7 |
| D | 8 | 195 | 870376 | 3819.11 | 943 | 915 | 227.7 |
| D | 2 | 250 | 258060 | 1129.51 | 943 | 915 | 227.7 |
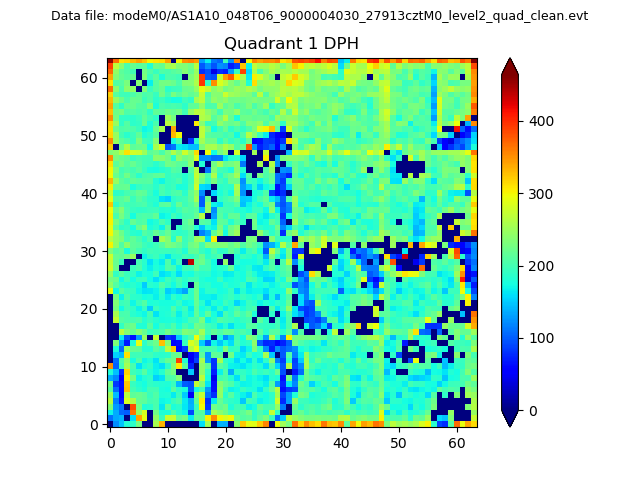
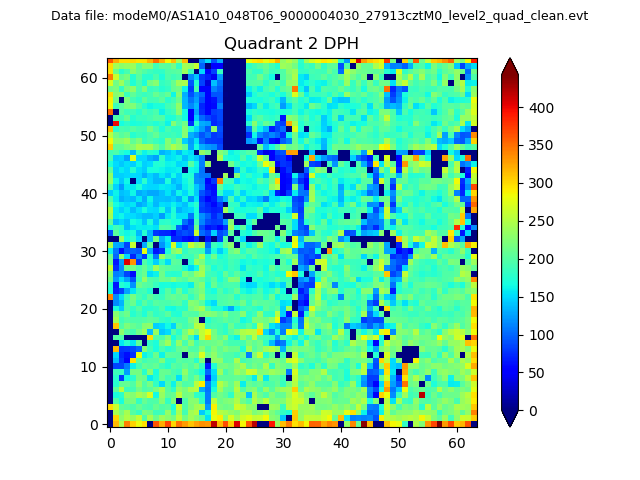
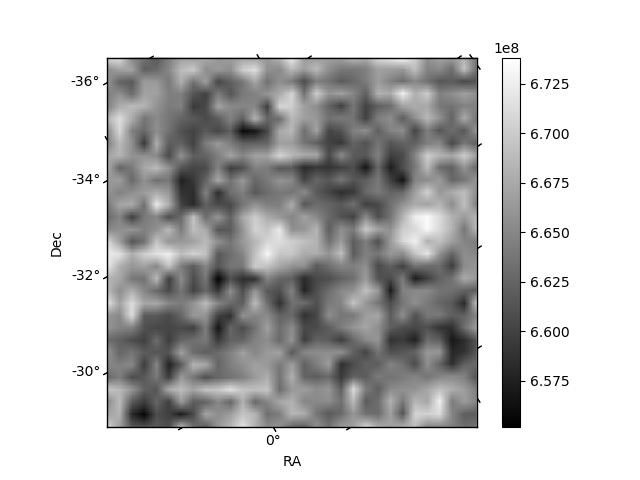
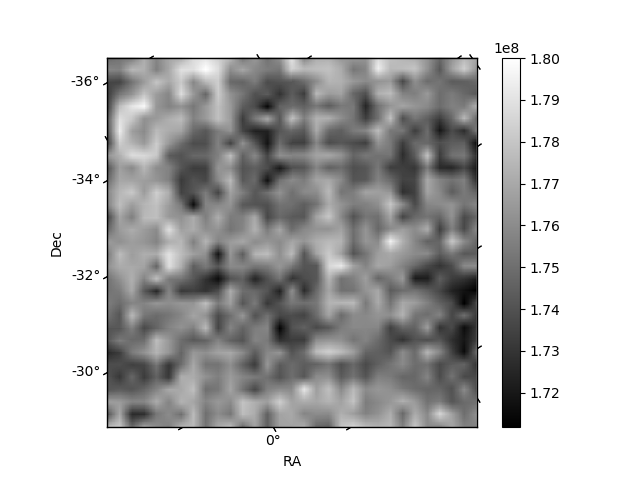
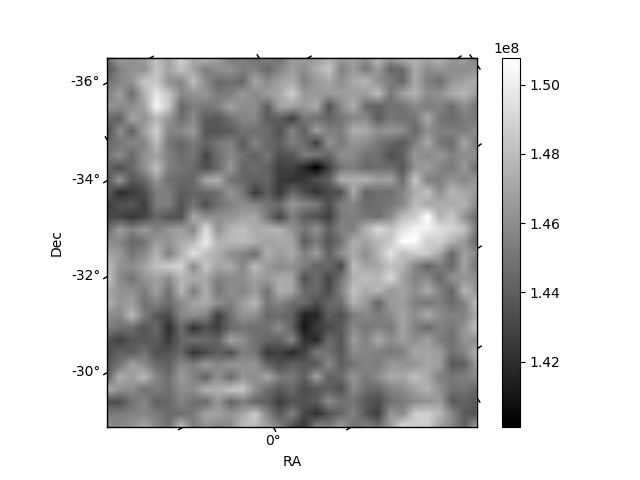
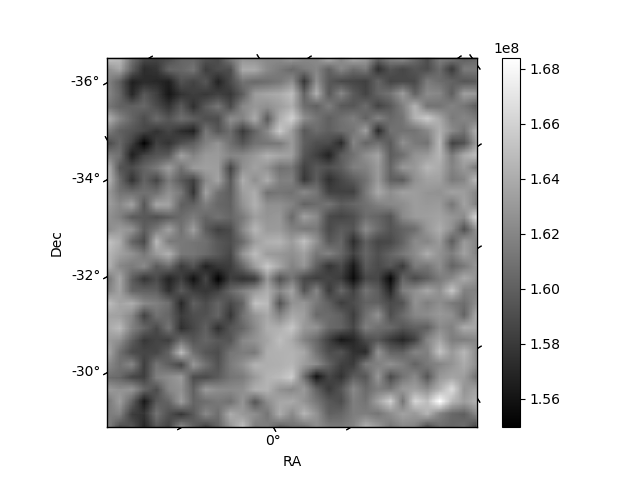
Histogram calculated using DETX and DETY for each event in the final _common_clean file
| Quadrant A | 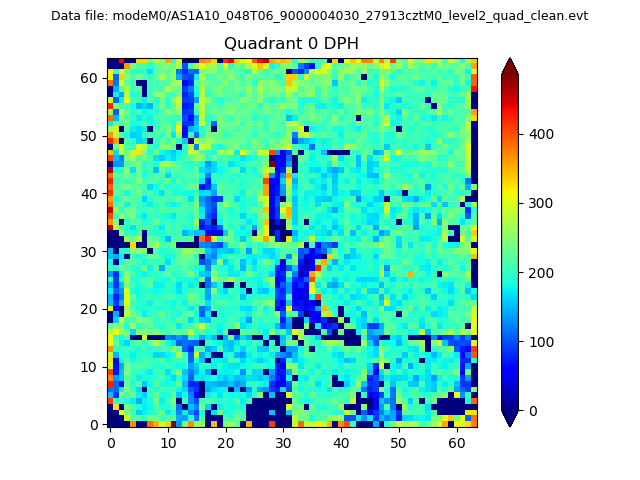 |
 |
Quadrant B |
|---|---|---|---|
| Quadrant D | 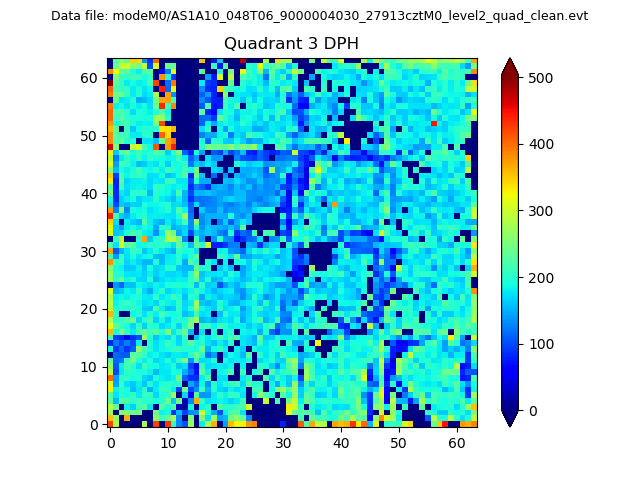 |
 |
Quadrant C |
| Plot type | Count rate plots | Images |
|---|---|---|
| Comparison with Poisson distribution Blue bars denote a histogram of data divided into 1 sec bins. Red curve is a Poisson curve with rate = median count rate of data. |
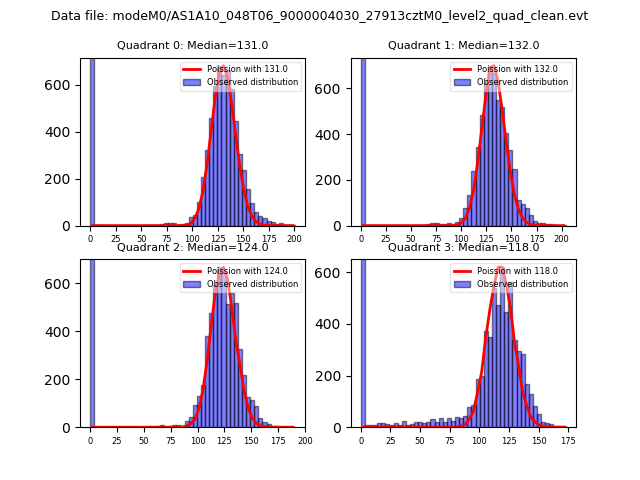 |
 |
| Quadrant-wise count rates Data is divided into 100 sec bins |
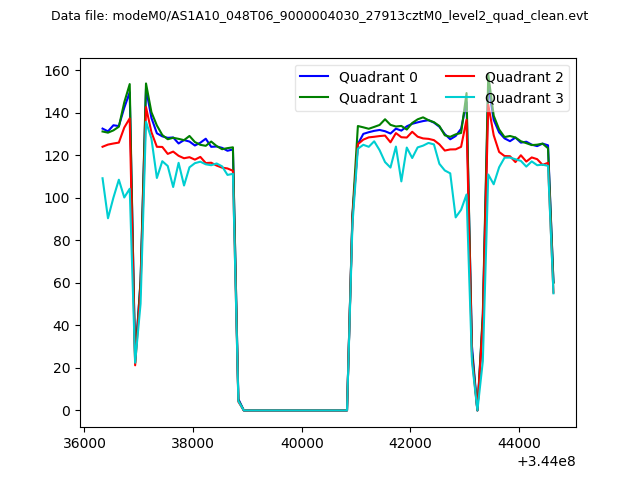 |
|
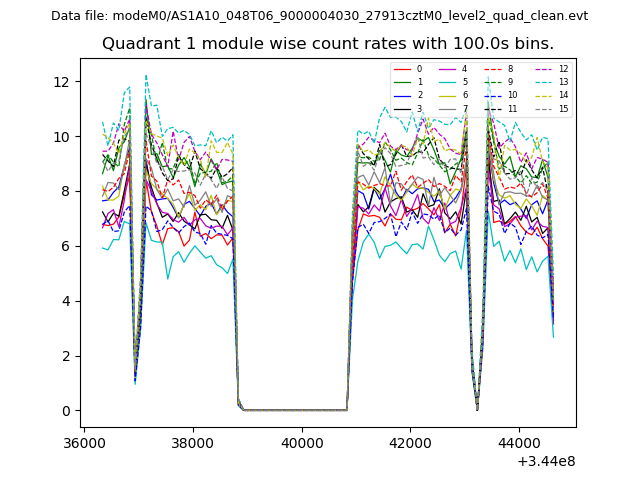
| Module-wise count rates for Quadrant A Data is divided into 100 sec bins |
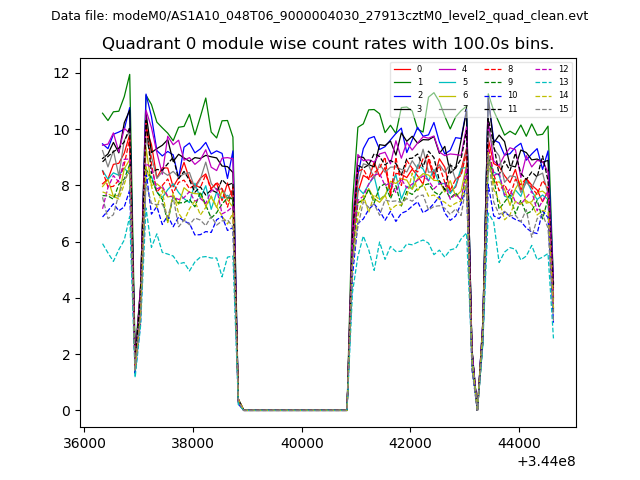 |
 |
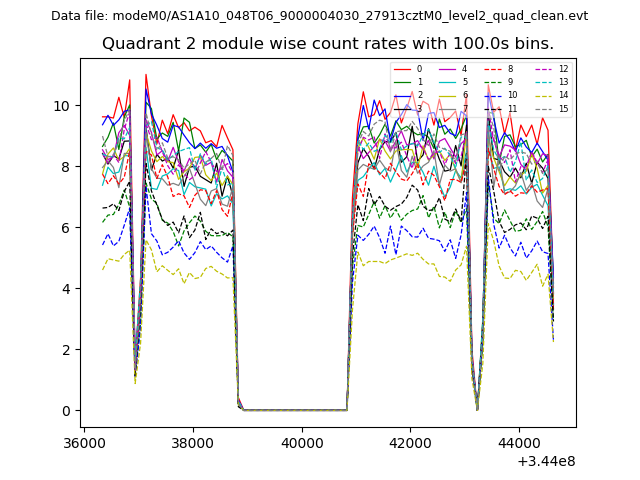
| Module-wise count rates for Quadrant B Data is divided into 100 sec bins |
 |
 |
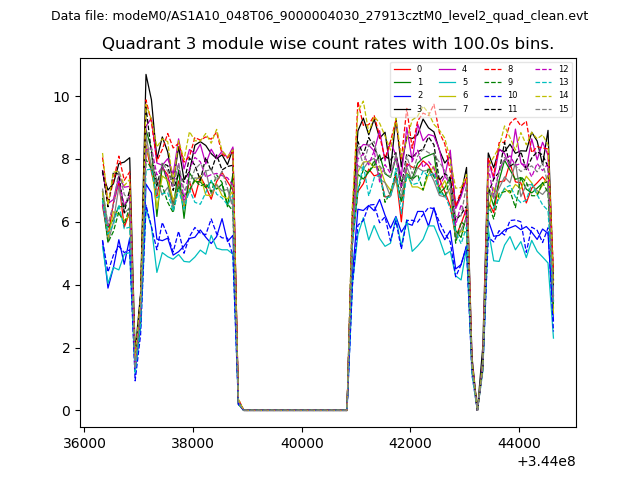
| Module-wise count rates for Quadrant C Data is divided into 100 sec bins |
 |
 |
| Module-wise count rates for Quadrant D Data is divided into 100 sec bins |
 |
 |
| Parameter | Plot |
|---|---|
| CZT HV Monitor | 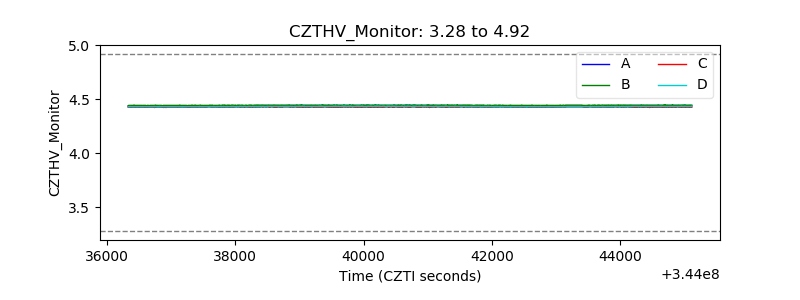 |
| D_VDD |  |
| Temperature 1 | 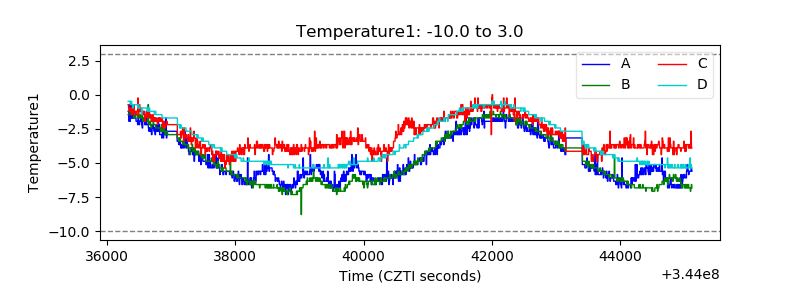 |
| Veto HV Monitor | 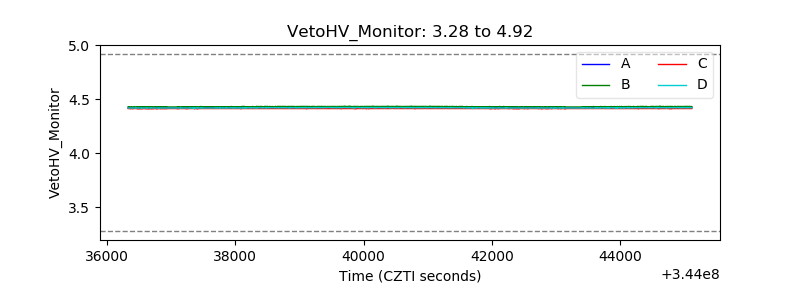 |
| Veto LLD | 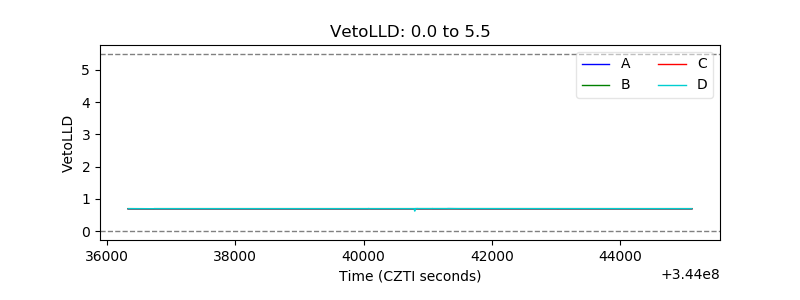 |
| Alpha Counter | 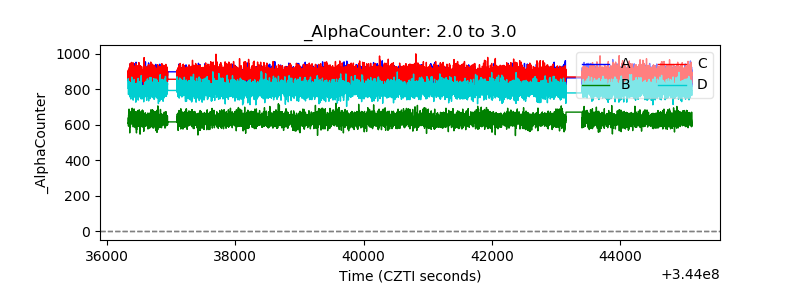 |
| _CPM_Rate | 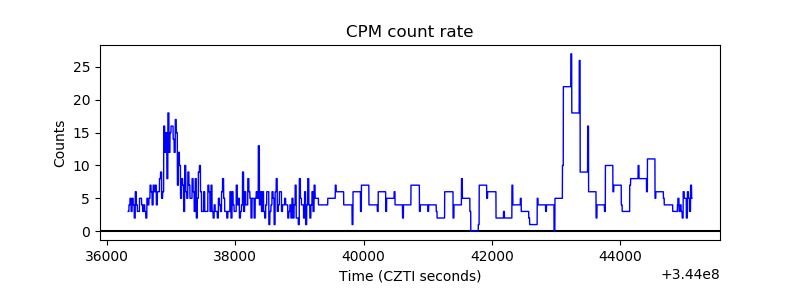 |
| CZT Counter | 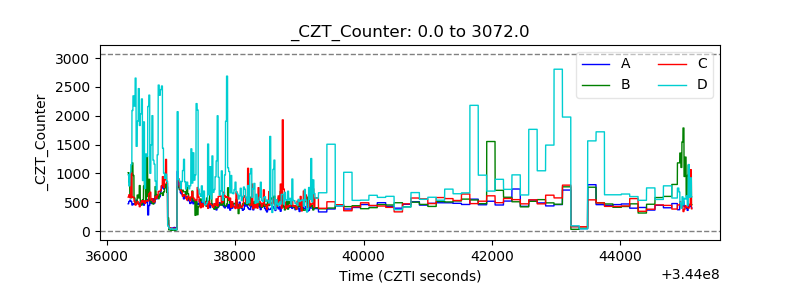 |
| +2.5 Volts monitor |  |
| +5 Volts monitor |  |
| _ROLL_ROT | 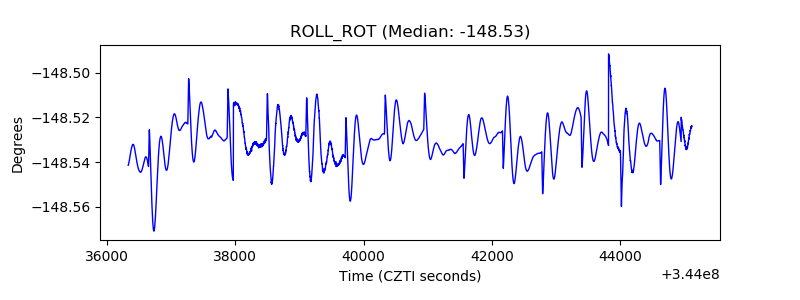 |
| _Roll_DEC | 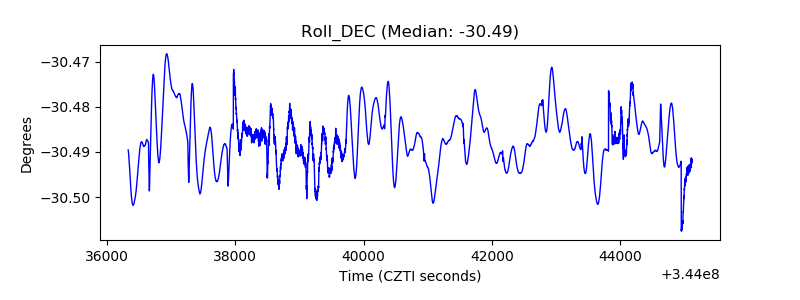 |
| _Roll_RA | 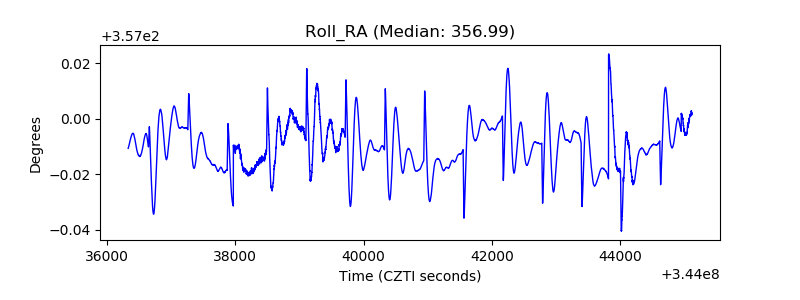 |
| Veto Counter | 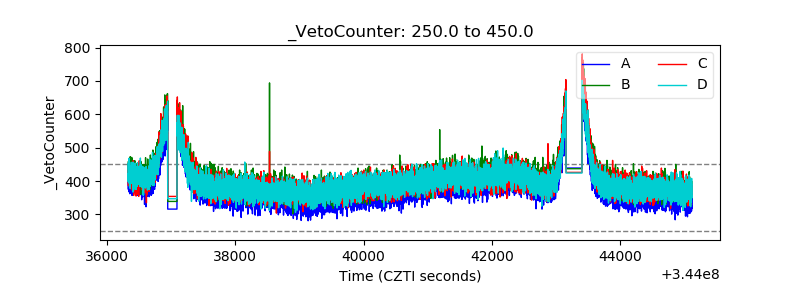 |