| Param | Original file | Final file |
|---|---|---|
| Filename | modeM0/AS1A10_048T06_9000004030_27916cztM0_level2.evt | modeM0/AS1A10_048T06_9000004030_27916cztM0_level2_quad_clean.evt |
| Size (bytes) | 1,473,523,200 | 224,913,600 |
| Size | 1.4 GB | 214.5 MB |
| Events in quadrant A | 8,876,298 | 1,420,252 |
| Events in quadrant B | 10,836,303 | 1,428,885 |
| Events in quadrant C | 9,354,792 | 1,361,030 |
| Events in quadrant D | 14,287,992 | 1,304,088 |
| Mode M0 | |||
|---|---|---|---|
| Quadrant | BADHDUFLAG | Total packets | Discarded packets |
| A | 0 | 38629 | 0 |
| B | 0 | 44094 | 0 |
| C | 0 | 39549 | 0 |
| D | 0 | 54971 | 0 |
| Mode M9 | |||
|---|---|---|---|
| Quadrant | BADHDUFLAG | Total packets | Discarded packets |
| A | 0 | 24 | 0 |
| B | 0 | 24 | 0 |
| C | 0 | 24 | 0 |
| D | 0 | 24 | 0 |
| Quadrant | Total seconds | Saturated seconds | Saturation percentage |
|---|---|---|---|
| A | 18835 | 148 | 0.785771% |
| B | 18835 | 324 | 1.720202% |
| C | 18835 | 382 | 2.028139% |
| D | 18835 | 1005 | 5.335811% |
Noise dominated data is calculated using 1-second bins in cleaned event files. If a bin has >2000 counts, and if more than 50% of those come from <1% of pixels, then it is considered to be noise-dominated and hence unusable.
| Quadrant | # 1 sec bins | Bins with >0 counts | Bins with >2000 counts | High rate bins dominated by noise | Noise dominated (total time) | Noise dominated (detector-on time) | Marked lightcurve |
|---|---|---|---|---|---|---|---|
| A | 21080 | 18836 | 0 | 0 | 0.00% | 0.00% | 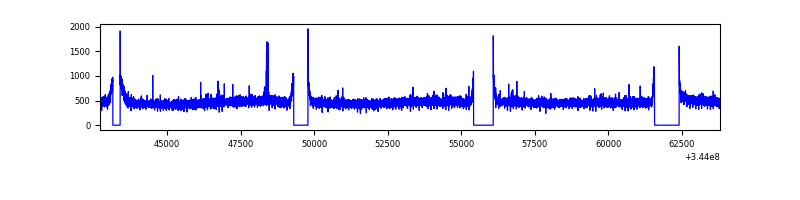 |
| B | 21080 | 18836 | 68 | 68 | 0.32% | 0.36% | 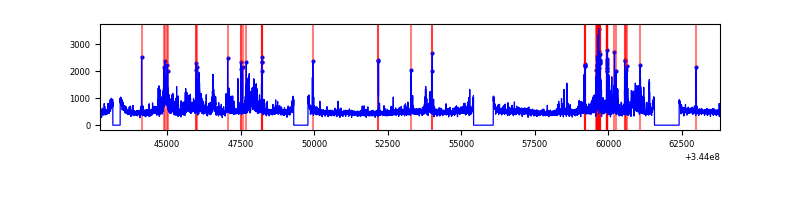 |
| C | 21080 | 18835 | 58 | 58 | 0.28% | 0.31% | 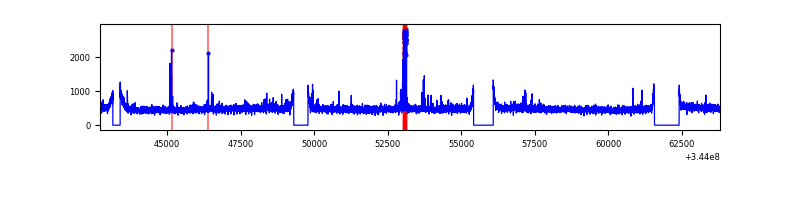 |
| D | 21080 | 18835 | 716 | 716 | 3.40% | 3.80% | 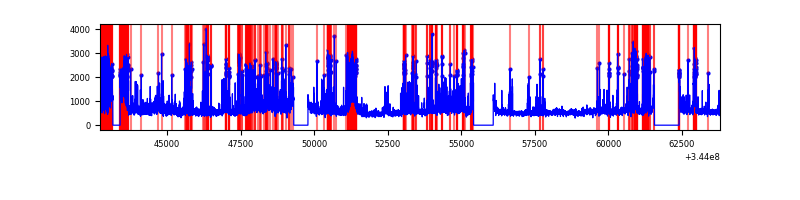 |
Top three noisy pixels from each quadrant. If the there are fewer than three noisy pixels in the level2.evt file, extra rows are filled as -1
| Pixel properties | Quadrant properties | ||||||
|---|---|---|---|---|---|---|---|
| Quadrant | DetID | PixID | Counts | Sigma | Mean | Median | Sigma |
| A | 13 | 254 | 31637 | 63.56 | 2289 | 2244 | 462.5 |
| A | 15 | 174 | 24876 | 48.94 | 2289 | 2244 | 462.5 |
| A | 3 | 137 | 22579 | 43.97 | 2289 | 2244 | 462.5 |
| B | 10 | 245 | 1640336 | 3760.41 | 2272 | 2214 | 435.6 |
| B | 0 | 230 | 77913 | 173.77 | 2272 | 2214 | 435.6 |
| B | 15 | 32 | 77311 | 172.39 | 2272 | 2214 | 435.6 |
| C | 3 | 233 | 394274 | 765.48 | 2183 | 2193 | 512.2 |
| C | 14 | 238 | 349761 | 678.58 | 2183 | 2193 | 512.2 |
| C | 15 | 208 | 56236 | 105.51 | 2183 | 2193 | 512.2 |
| D | 1 | 52 | 3845126 | 7387.19 | 2160 | 2101 | 520.2 |
| D | 8 | 195 | 1764067 | 3386.91 | 2160 | 2101 | 520.2 |
| D | 2 | 250 | 265166 | 505.67 | 2160 | 2101 | 520.2 |
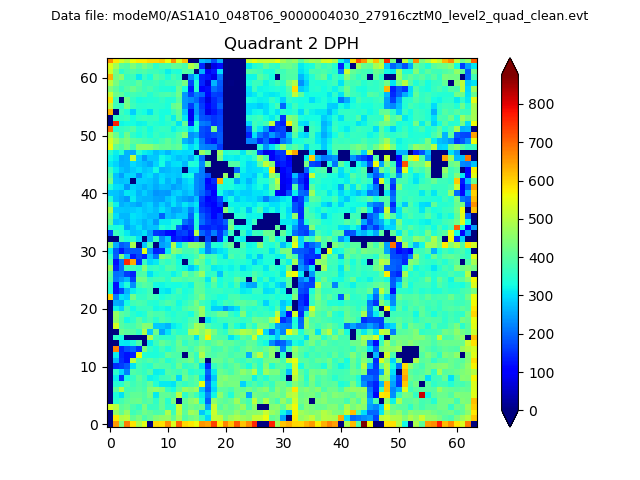
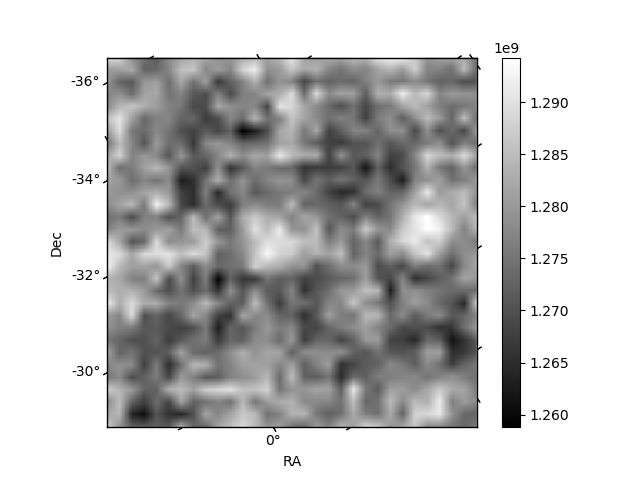
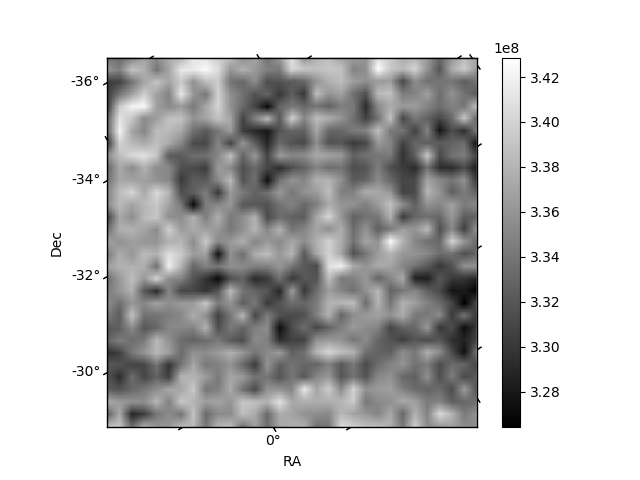
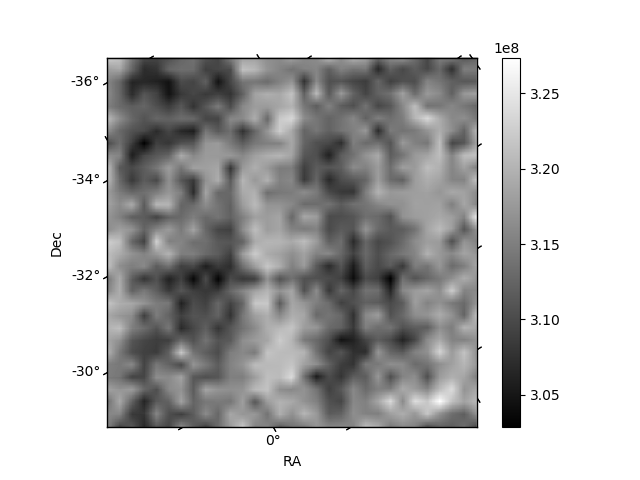
Histogram calculated using DETX and DETY for each event in the final _common_clean file
| Quadrant A | 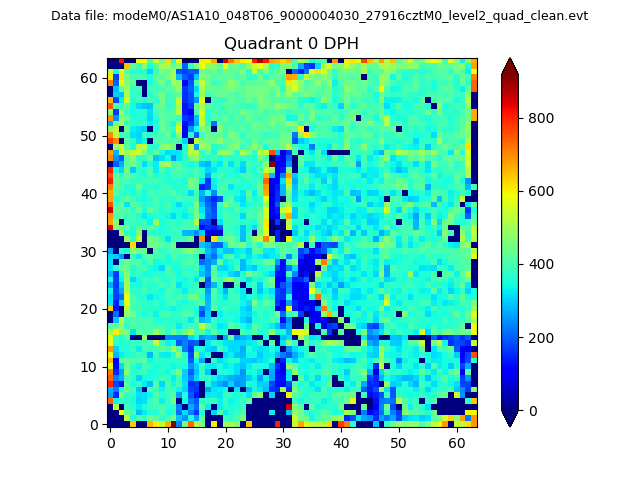 |
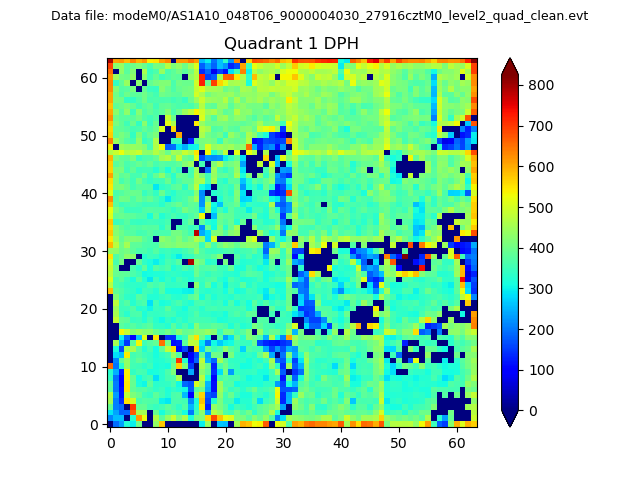 |
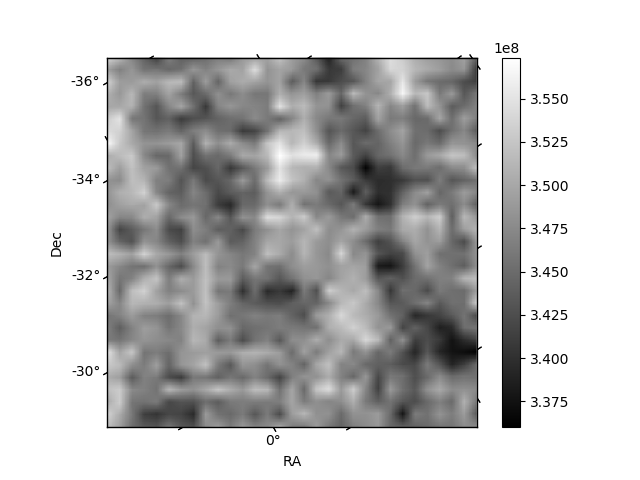
Quadrant B |
|---|---|---|---|
| Quadrant D | 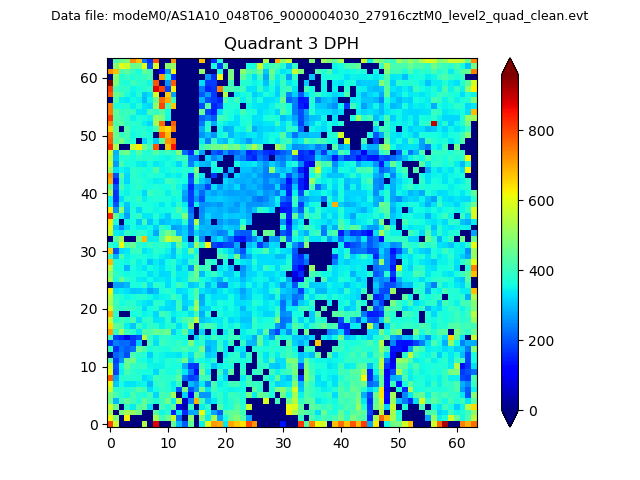 |
 |
Quadrant C |
| Plot type | Count rate plots | Images |
|---|---|---|
| Comparison with Poisson distribution Blue bars denote a histogram of data divided into 1 sec bins. Red curve is a Poisson curve with rate = median count rate of data. |
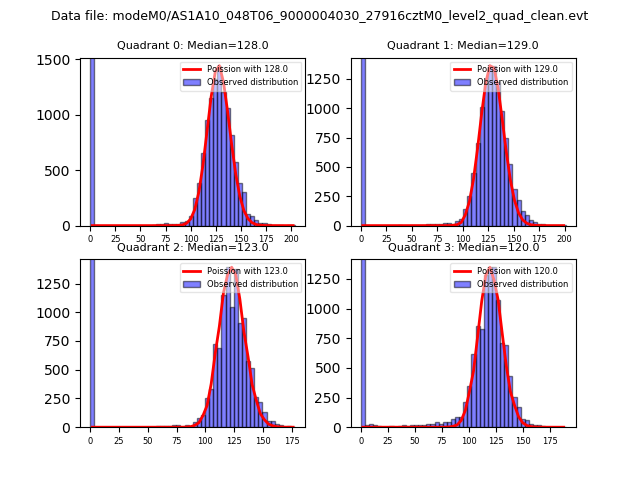 |
 |
| Quadrant-wise count rates Data is divided into 100 sec bins |
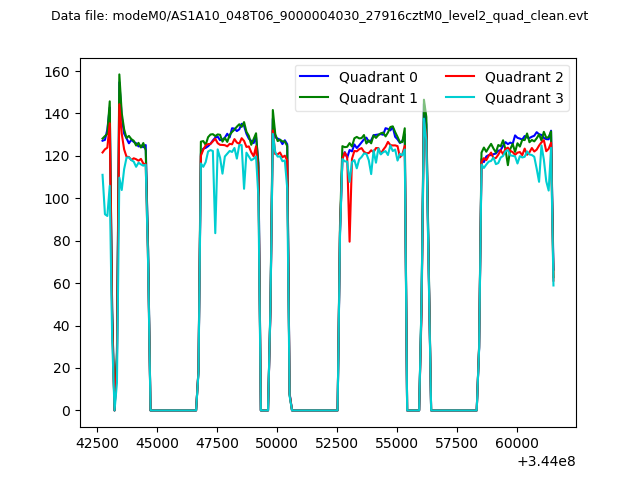 |
|
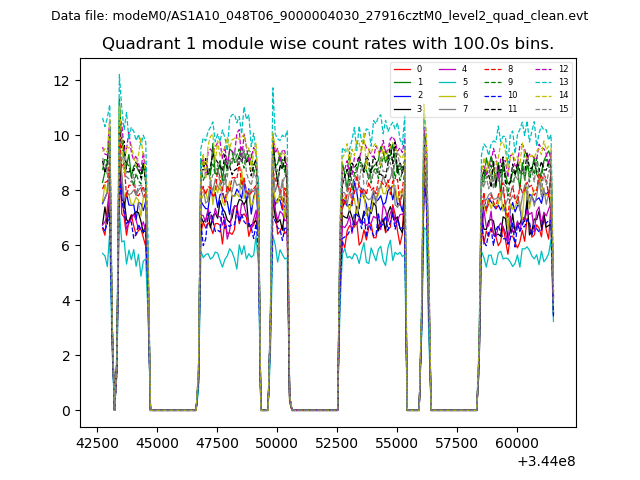
| Module-wise count rates for Quadrant A Data is divided into 100 sec bins |
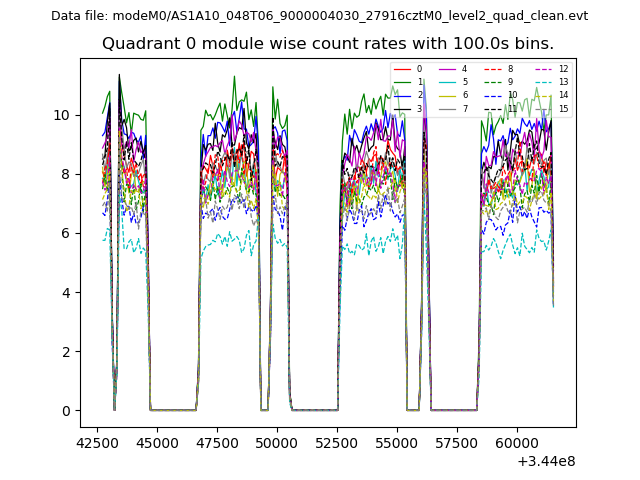 |
 |
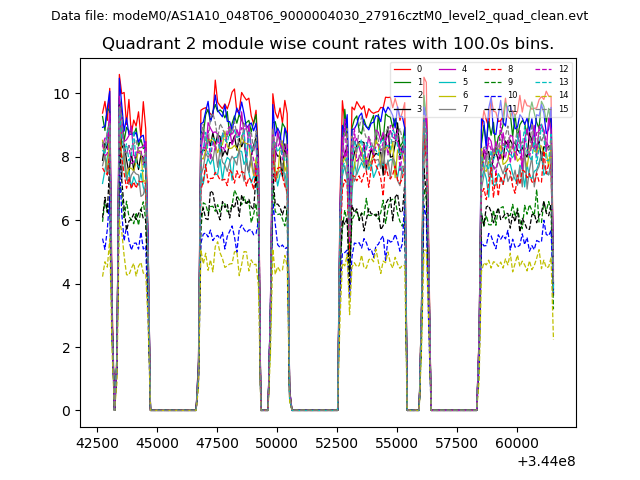
| Module-wise count rates for Quadrant B Data is divided into 100 sec bins |
 |
 |
| Module-wise count rates for Quadrant C Data is divided into 100 sec bins |
 |
 |
| Module-wise count rates for Quadrant D Data is divided into 100 sec bins |
 |
 |
| Parameter | Plot |
|---|---|
| CZT HV Monitor | 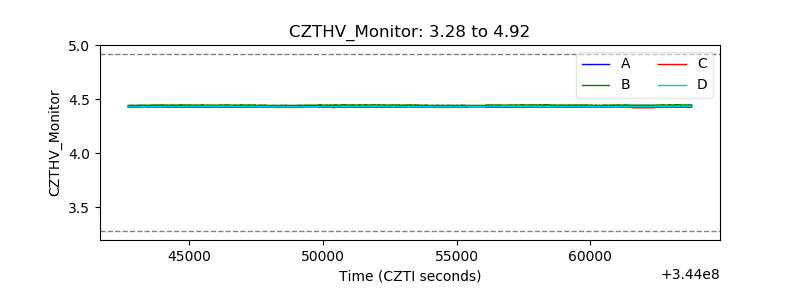 |
| D_VDD | 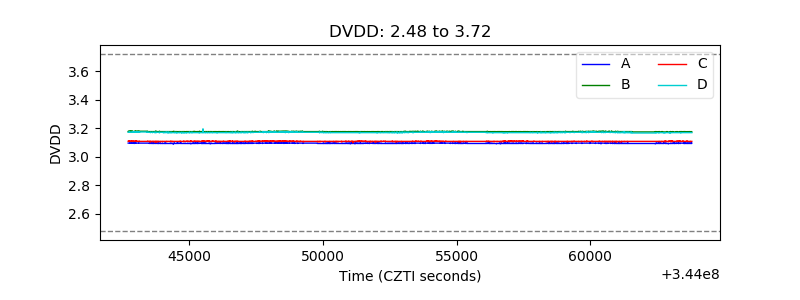 |
| Temperature 1 | 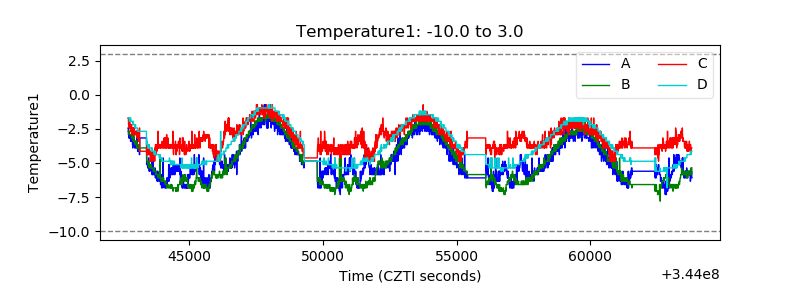 |
| Veto HV Monitor | 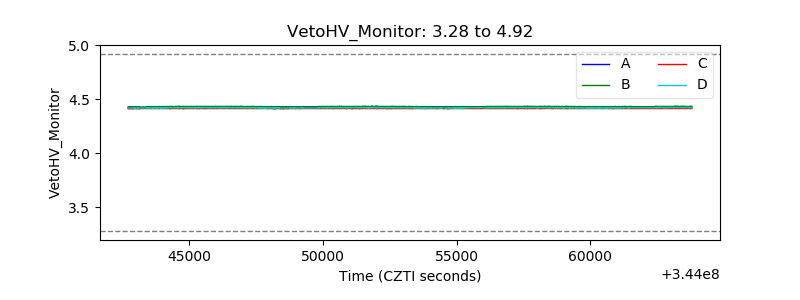 |
| Veto LLD | 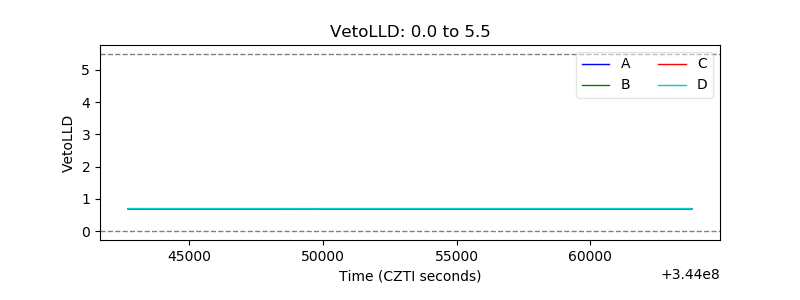 |
| Alpha Counter | 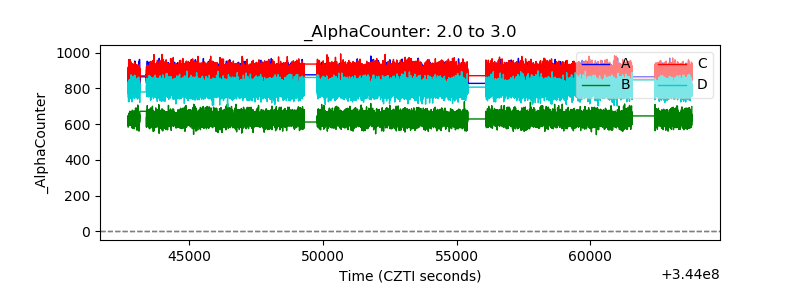 |
| _CPM_Rate | 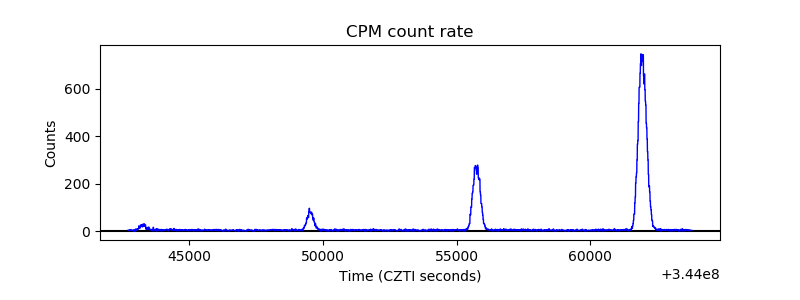 |
| CZT Counter | 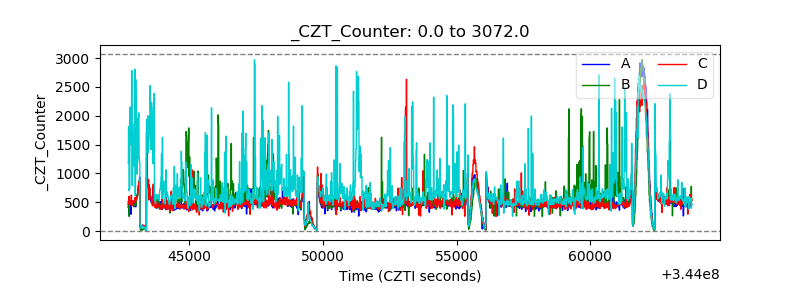 |
| +2.5 Volts monitor |  |
| +5 Volts monitor |  |
| _ROLL_ROT |  |
| _Roll_DEC | 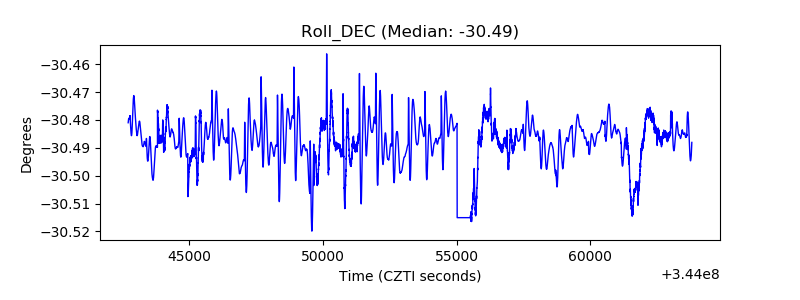 |
| _Roll_RA | 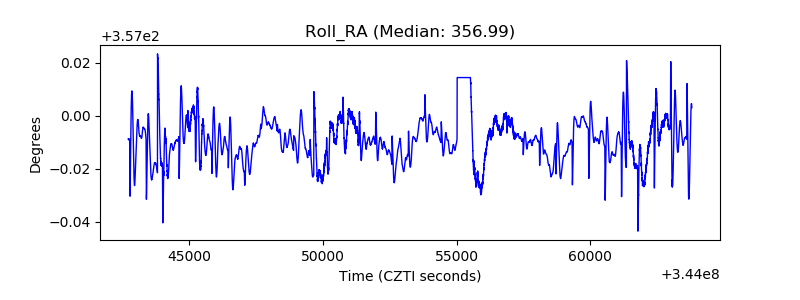 |
| Veto Counter | 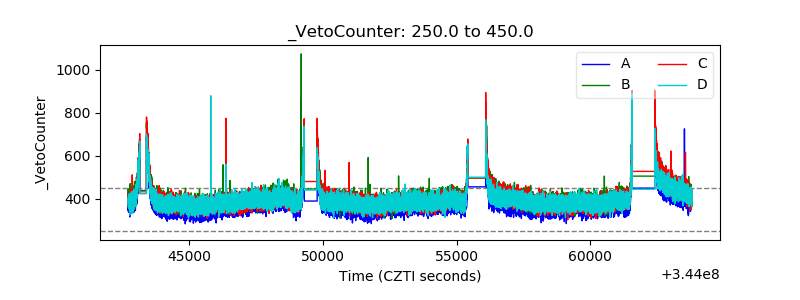 |