| Param | Original file | Final file |
|---|---|---|
| Filename | modeM0/AS1A10_048T06_9000004030_27917cztM0_level2.evt | modeM0/AS1A10_048T06_9000004030_27917cztM0_level2_quad_clean.evt |
| Size (bytes) | 335,039,040 | 47,808,000 |
| Size | 319.5 MB | 45.6 MB |
| Events in quadrant A | 2,009,660 | 295,307 |
| Events in quadrant B | 2,440,680 | 294,561 |
| Events in quadrant C | 2,016,662 | 286,452 |
| Events in quadrant D | 3,388,562 | 269,969 |
| Mode M0 | |||
|---|---|---|---|
| Quadrant | BADHDUFLAG | Total packets | Discarded packets |
| A | 0 | 8678 | 0 |
| B | 0 | 9894 | 0 |
| C | 0 | 8699 | 0 |
| D | 0 | 12836 | 0 |
| Mode M9 | |||
|---|---|---|---|
| Quadrant | BADHDUFLAG | Total packets | Discarded packets |
| A | 0 | 6 | 0 |
| B | 0 | 7 | 0 |
| C | 0 | 7 | 0 |
| D | 0 | 7 | 0 |
| Quadrant | Total seconds | Saturated seconds | Saturation percentage |
|---|---|---|---|
| A | 4271 | 13 | 0.304378% |
| B | 4271 | 21 | 0.491688% |
| C | 4271 | 25 | 0.585343% |
| D | 4271 | 249 | 5.830016% |
Noise dominated data is calculated using 1-second bins in cleaned event files. If a bin has >2000 counts, and if more than 50% of those come from <1% of pixels, then it is considered to be noise-dominated and hence unusable.
| Quadrant | # 1 sec bins | Bins with >0 counts | Bins with >2000 counts | High rate bins dominated by noise | Noise dominated (total time) | Noise dominated (detector-on time) | Marked lightcurve |
|---|---|---|---|---|---|---|---|
| A | 4271 | 4271 | 0 | 0 | 0.00% | 0.00% | 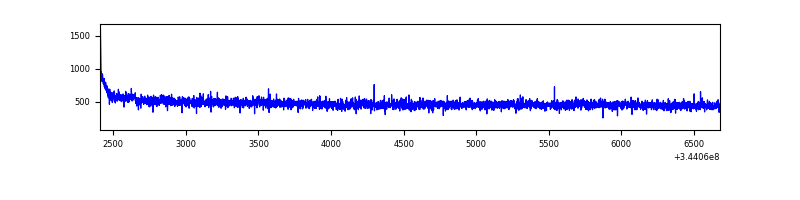 |
| B | 4271 | 4271 | 4 | 4 | 0.09% | 0.09% | 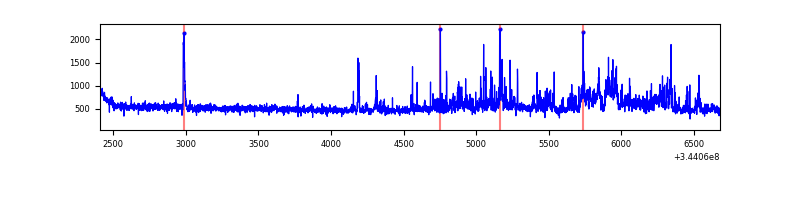 |
| C | 4271 | 4271 | 0 | 0 | 0.00% | 0.00% | 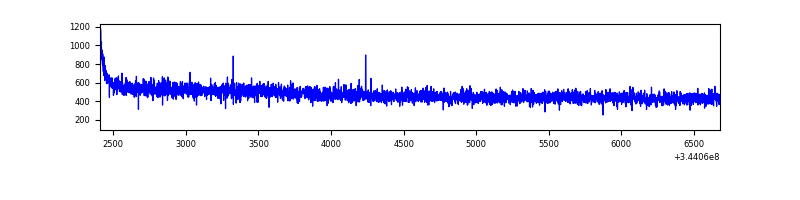 |
| D | 4270 | 4270 | 252 | 252 | 5.90% | 5.90% |  |
Top three noisy pixels from each quadrant. If the there are fewer than three noisy pixels in the level2.evt file, extra rows are filled as -1
| Pixel properties | Quadrant properties | ||||||
|---|---|---|---|---|---|---|---|
| Quadrant | DetID | PixID | Counts | Sigma | Mean | Median | Sigma |
| A | 15 | 174 | 7923 | 70.91 | 517 | 507 | 104.6 |
| A | 13 | 254 | 7052 | 62.58 | 517 | 507 | 104.6 |
| A | 3 | 137 | 4943 | 42.42 | 517 | 507 | 104.6 |
| B | 10 | 245 | 224923 | 2275.42 | 514 | 503 | 98.6 |
| B | 0 | 230 | 122672 | 1238.68 | 514 | 503 | 98.6 |
| B | 4 | 52 | 23008 | 228.18 | 514 | 503 | 98.6 |
| C | 14 | 238 | 80138 | 683.23 | 495 | 498 | 116.6 |
| C | 3 | 233 | 7443 | 59.58 | 495 | 498 | 116.6 |
| C | 13 | 61 | 3366 | 24.6 | 495 | 498 | 116.6 |
| D | 1 | 52 | 929780 | 7878.07 | 489 | 476 | 118.0 |
| D | 8 | 195 | 442359 | 3746.02 | 489 | 476 | 118.0 |
| D | 7 | 238 | 100136 | 844.86 | 489 | 476 | 118.0 |
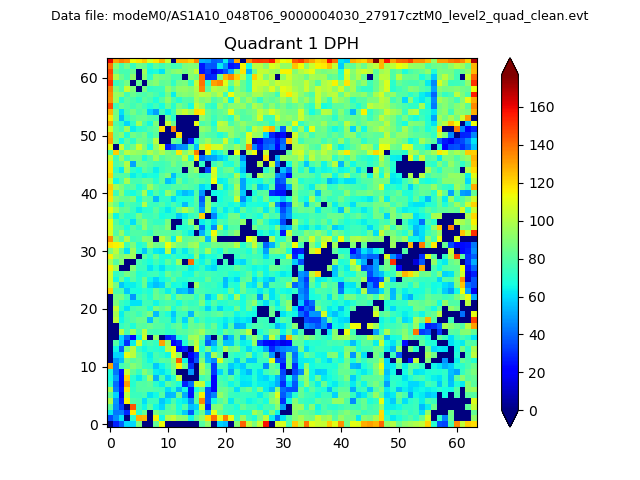
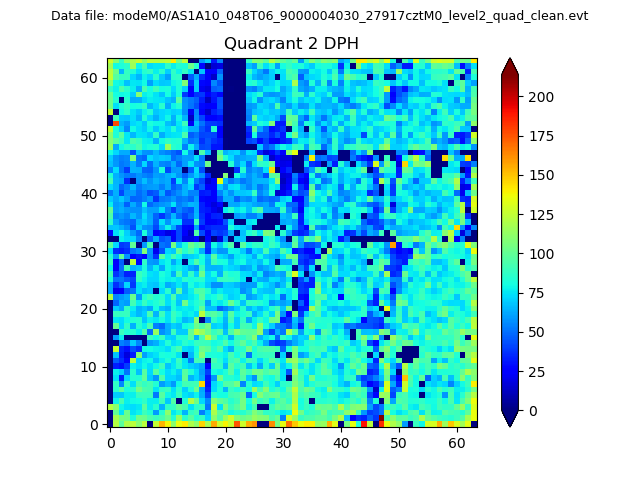
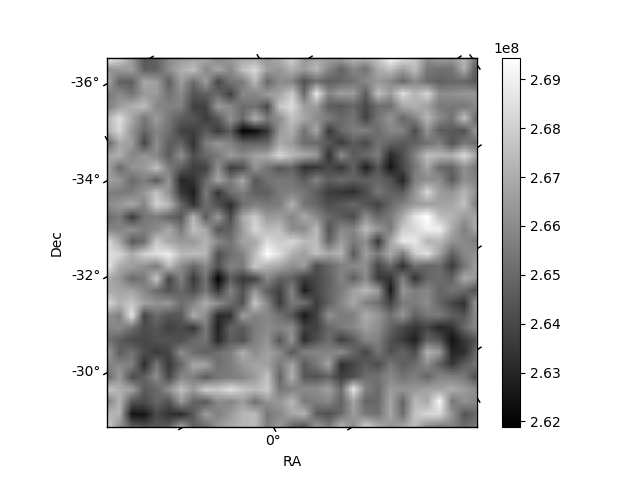
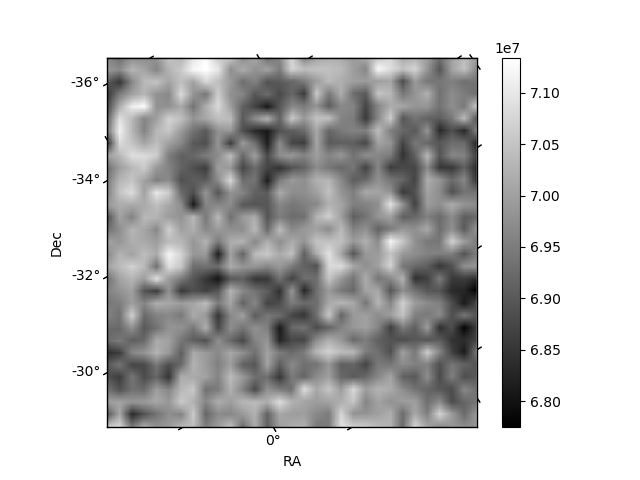
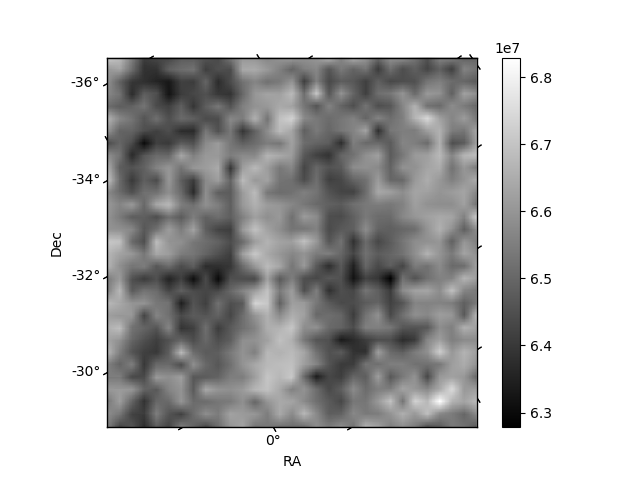
Histogram calculated using DETX and DETY for each event in the final _common_clean file
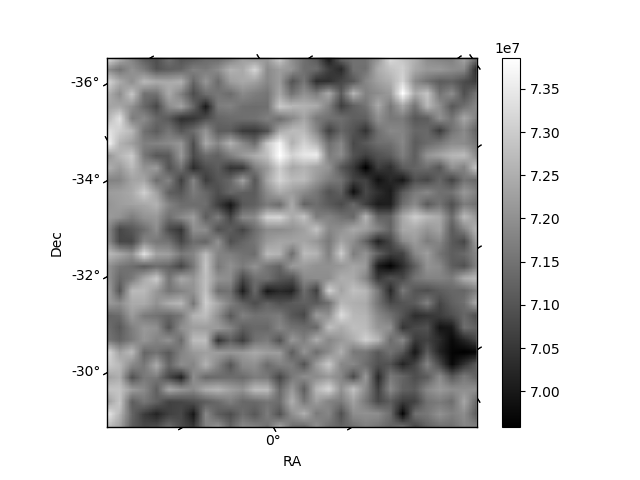
| Quadrant A | 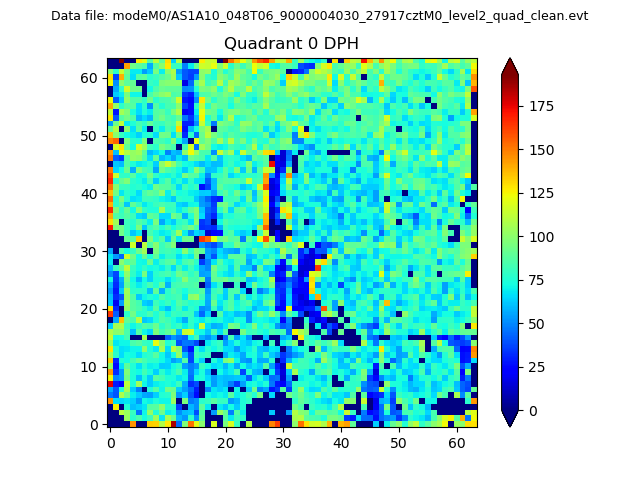 |
 |
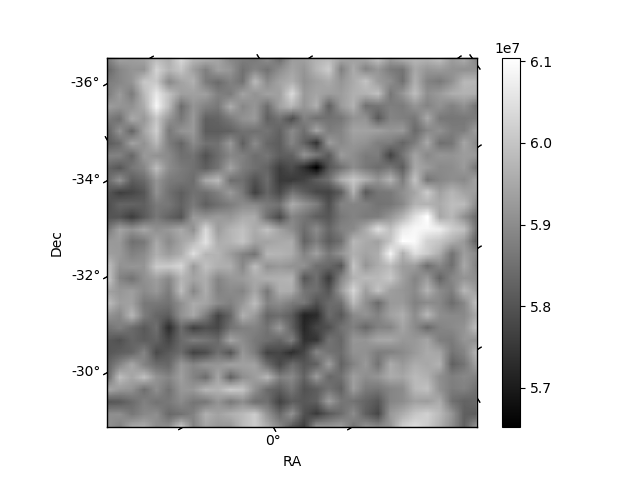
Quadrant B |
|---|---|---|---|
| Quadrant D | 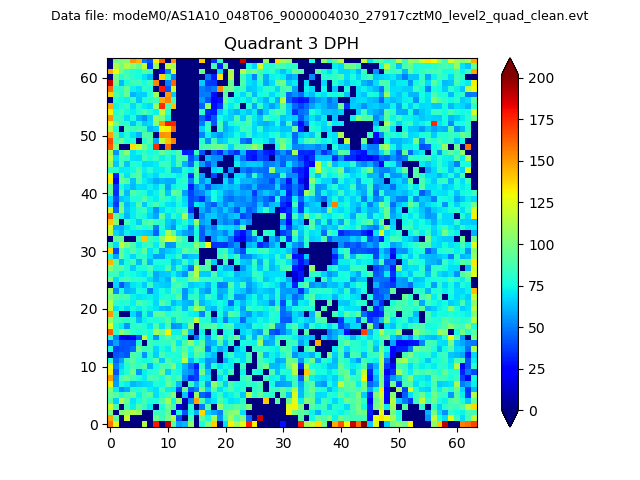 |
 |
Quadrant C |
| Plot type | Count rate plots | Images |
|---|---|---|
| Comparison with Poisson distribution Blue bars denote a histogram of data divided into 1 sec bins. Red curve is a Poisson curve with rate = median count rate of data. |
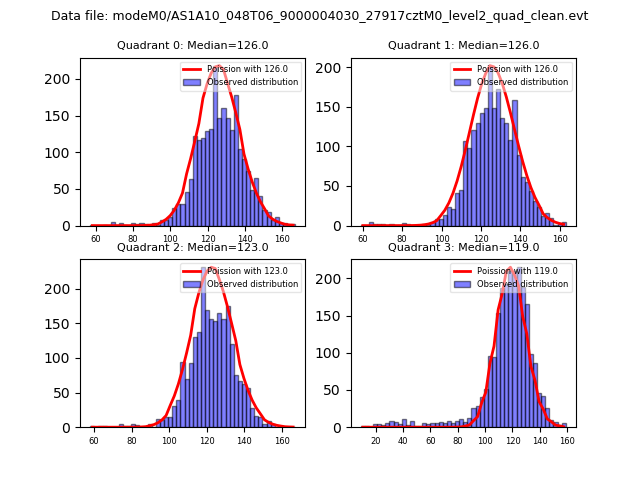 |
 |
| Quadrant-wise count rates Data is divided into 100 sec bins |
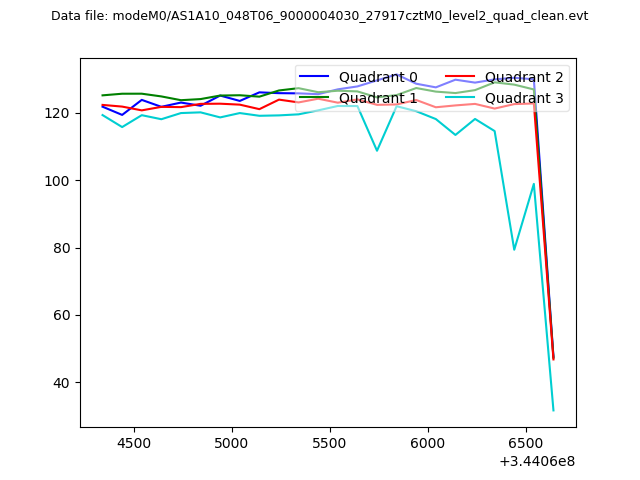 |
|
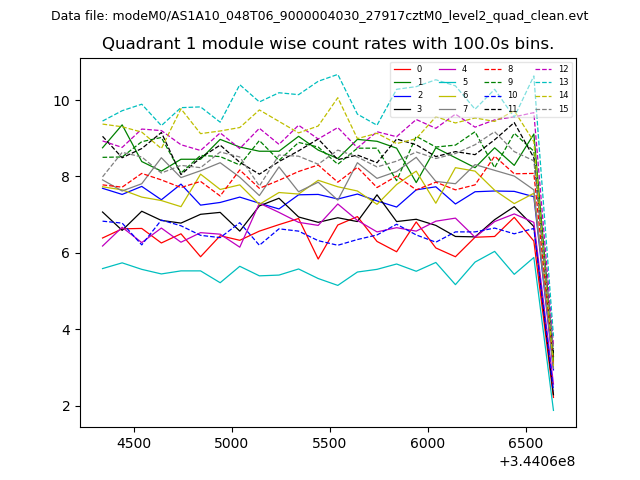
| Module-wise count rates for Quadrant A Data is divided into 100 sec bins |
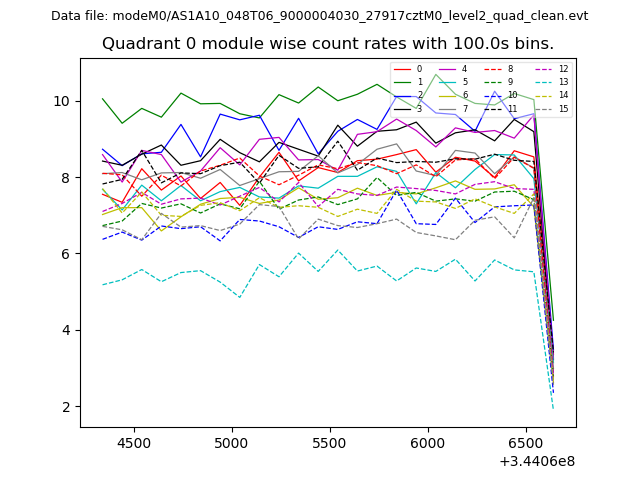 |
 |
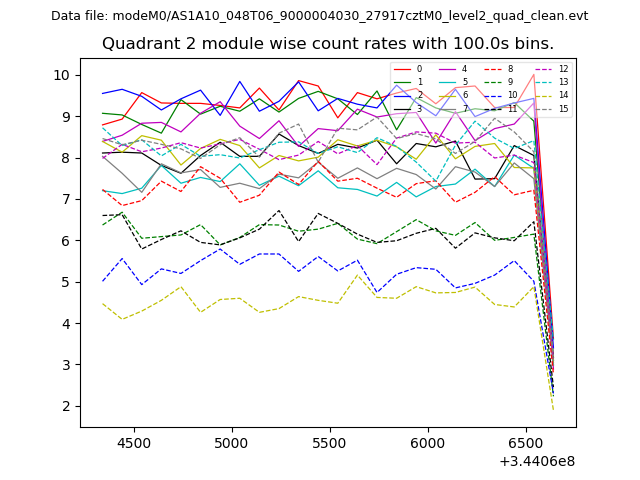
| Module-wise count rates for Quadrant B Data is divided into 100 sec bins |
 |
 |
| Module-wise count rates for Quadrant C Data is divided into 100 sec bins |
 |
 |
| Module-wise count rates for Quadrant D Data is divided into 100 sec bins |
 |
 |
| Parameter | Plot |
|---|---|
| CZT HV Monitor | 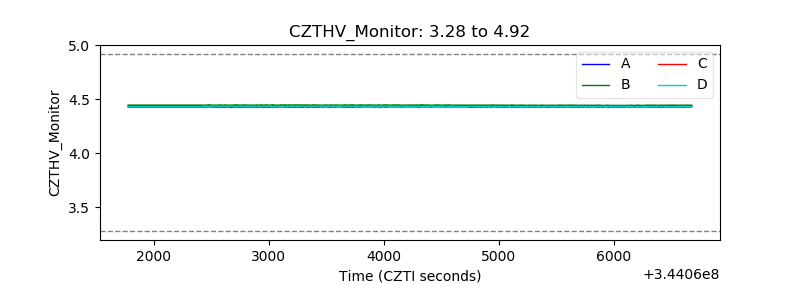 |
| D_VDD |  |
| Temperature 1 | 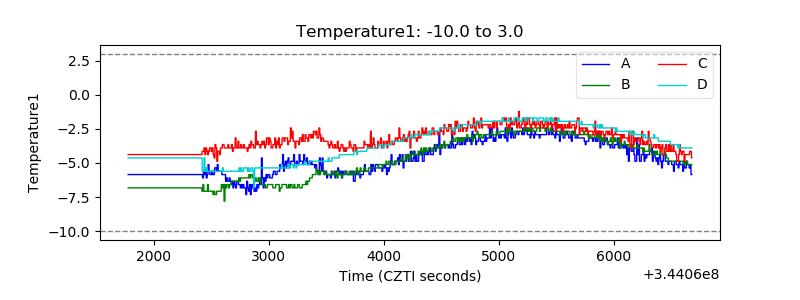 |
| Veto HV Monitor | 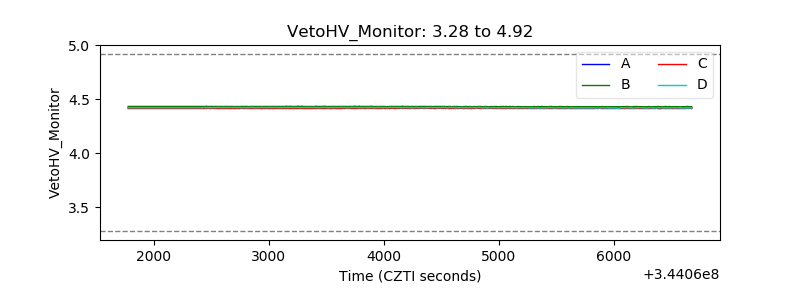 |
| Veto LLD | 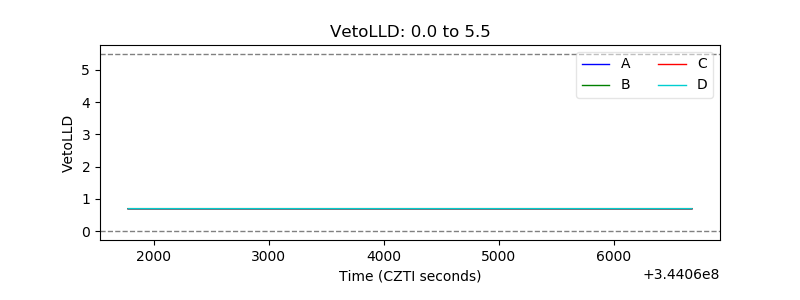 |
| Alpha Counter | 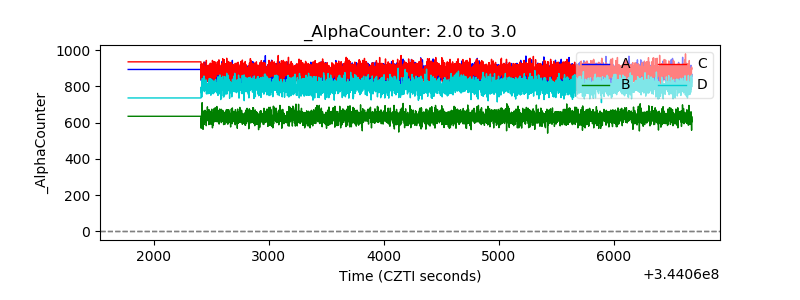 |
| _CPM_Rate | 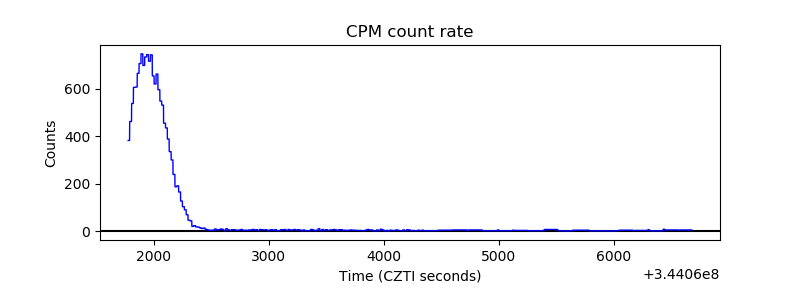 |
| CZT Counter | 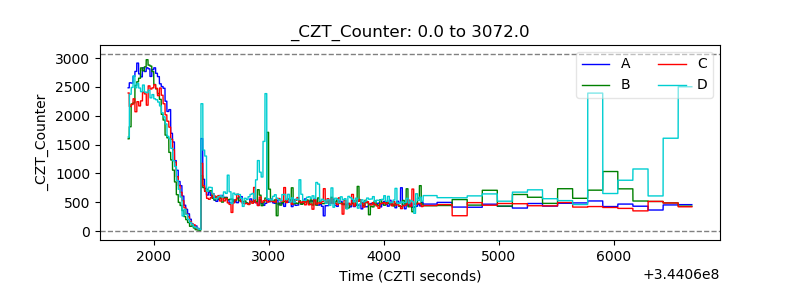 |
| +2.5 Volts monitor |  |
| +5 Volts monitor |  |
| _ROLL_ROT | 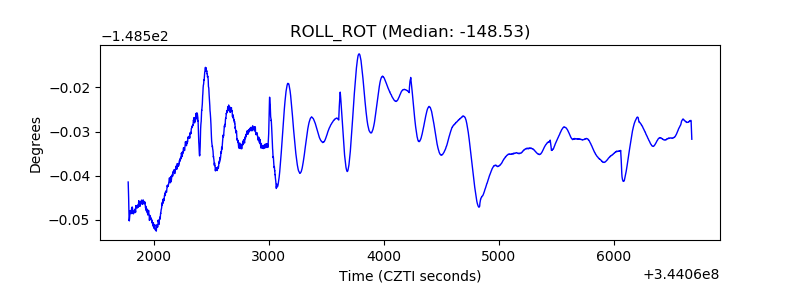 |
| _Roll_DEC | 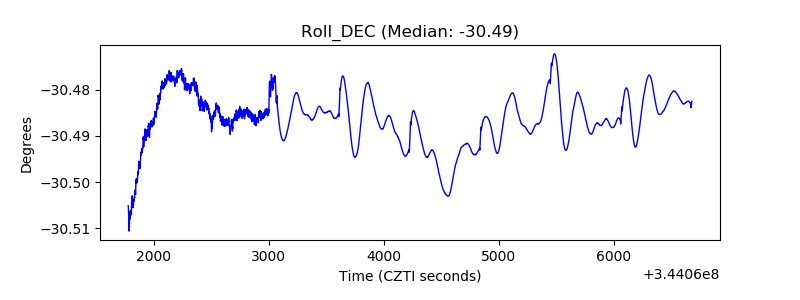 |
| _Roll_RA | 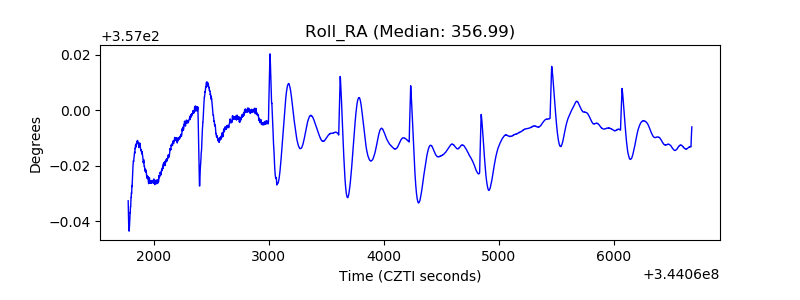 |
| Veto Counter | 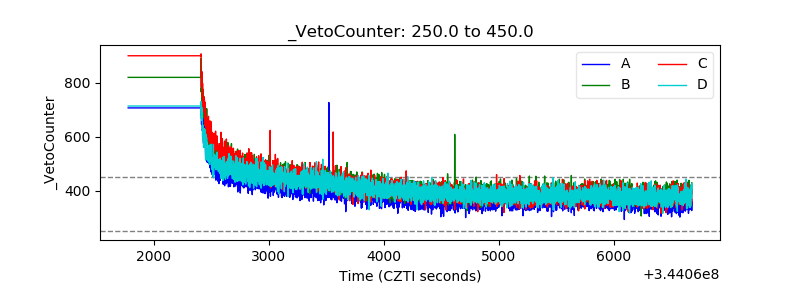 |