| Param | Original file | Final file |
|---|---|---|
| Filename | modeM0/AS1A10_049T01_9000004032cztM0_level2.fits | modeM0/AS1A10_049T01_9000004032cztM0_level2_quad_clean.evt |
| Size (bytes) | 934,254,720 | 834,848,640 |
| Size | 891.0 MB | 796.2 MB |
| Events in quadrant A | 5,940,084 | 5,110,035 |
| Events in quadrant B | 5,599,584 | 4,994,936 |
| Events in quadrant C | 5,648,736 | 4,711,669 |
| Events in quadrant D | 4,897,734 | 4,258,536 |
| Mode M9 | |||
|---|---|---|---|
| Quadrant | BADHDUFLAG | Total packets | Discarded packets |
| A | 0 | 158 | 0 |
| B | 0 | 158 | 0 |
| C | 0 | 158 | 0 |
| D | 0 | 158 | 0 |
| Mode SS | |||
|---|---|---|---|
| Quadrant | BADHDUFLAG | Total packets | Discarded packets |
| A | 0 | 1840 | 0 |
| B | 0 | 1840 | 0 |
| C | 0 | 1840 | 0 |
| D | 0 | 1840 | 0 |
| Mode M0 | |||
|---|---|---|---|
| Quadrant | BADHDUFLAG | Total packets | Discarded packets |
| A | 0 | 192947 | 0 |
| B | 0 | 212031 | 0 |
| C | 0 | 200320 | 0 |
| D | 0 | 277731 | 0 |
| Quadrant | Total seconds | Saturated seconds | Saturation percentage |
|---|---|---|---|
| A | 90573 | 1073 | 1.184680% |
| B | 90573 | 2192 | 2.420147% |
| C | 90573 | 2109 | 2.328508% |
| D | 90573 | 4166 | 4.599605% |
Noise dominated data is calculated using 1-second bins in cleaned event files. If a bin has >2000 counts, and if more than 50% of those come from <1% of pixels, then it is considered to be noise-dominated and hence unusable.
| Quadrant | # 1 sec bins | Bins with >0 counts | Bins with >2000 counts | High rate bins dominated by noise | Noise dominated (total time) | Noise dominated (detector-on time) | Marked lightcurve |
|---|---|---|---|---|---|---|---|
| A | 105993 | 90560 | 0 | 0 | 0.00% | 0.00% |  |
| B | 105993 | 90559 | 0 | 0 | 0.00% | 0.00% |  |
| C | 105993 | 90556 | 0 | 0 | 0.00% | 0.00% |  |
| D | 105993 | 90532 | 0 | 0 | 0.00% | 0.00% |  |
Top three noisy pixels from each quadrant. If the there are fewer than three noisy pixels in the level2.evt file, extra rows are filled as -1
| Pixel properties | Quadrant properties | ||||||
|---|---|---|---|---|---|---|---|
| Quadrant | DetID | PixID | Counts | Sigma | Mean | Median | Sigma |
| A | 0 | 29 | 4823 | 9.16 | 1547 | 1464 | 366.7 |
| A | 7 | 110 | 4645 | 8.67 | 1547 | 1464 | 366.7 |
| A | 9 | 19 | 4398 | 8.0 | 1547 | 1464 | 366.7 |
| B | 2 | 9 | 4324 | 10.18 | 1484 | 1424 | 284.9 |
| B | 5 | 128 | 3729 | 8.09 | 1484 | 1424 | 284.9 |
| B | 14 | 254 | 3610 | 7.67 | 1484 | 1424 | 284.9 |
| C | 1 | 81 | 4367 | 7.94 | 1492 | 1407 | 372.8 |
| C | 1 | 80 | 4313 | 7.8 | 1492 | 1407 | 372.8 |
| C | 12 | 241 | 3885 | 6.65 | 1492 | 1407 | 372.8 |
| D | 6 | 67 | 3564 | 6.23 | 1400 | 1283 | 365.9 |
| D | 10 | 189 | 3522 | 6.12 | 1400 | 1283 | 365.9 |
| D | 6 | 231 | 3436 | 5.88 | 1400 | 1283 | 365.9 |
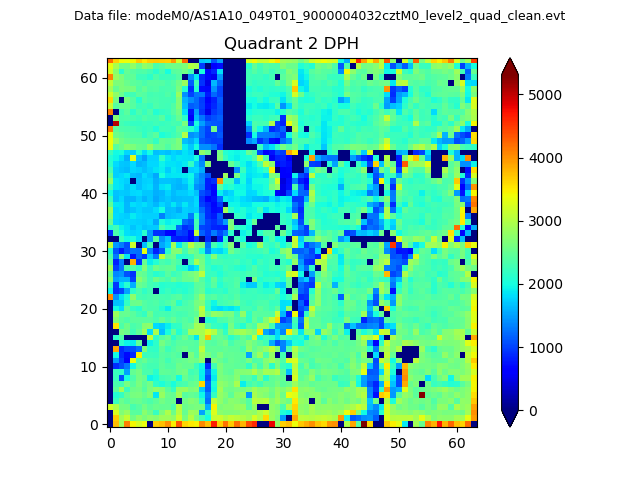
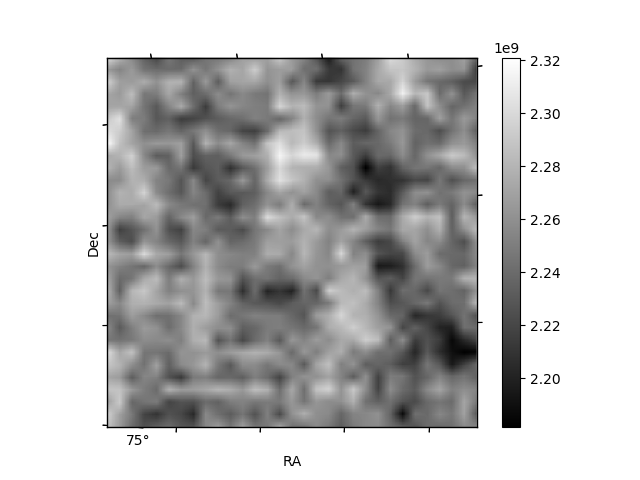
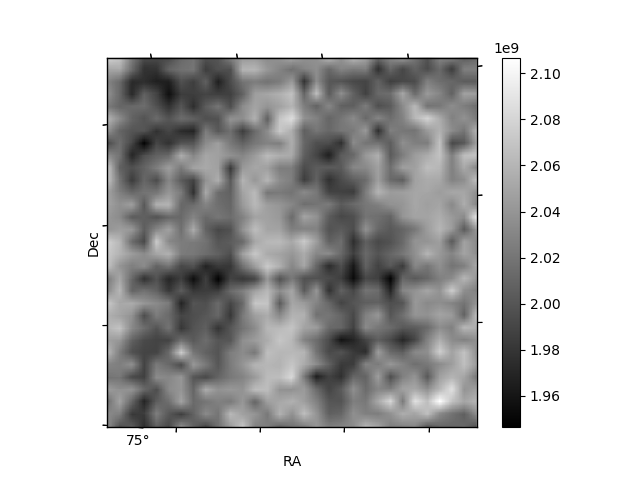
Histogram calculated using DETX and DETY for each event in the final _common_clean file
| Quadrant A | 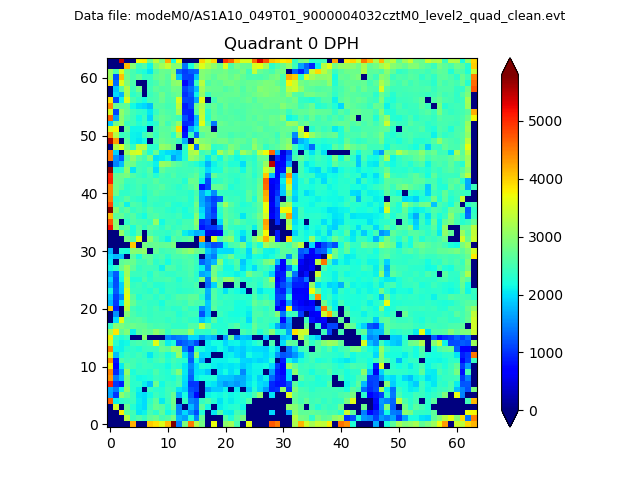 |
 |
Quadrant B |
|---|---|---|---|
| Quadrant D | 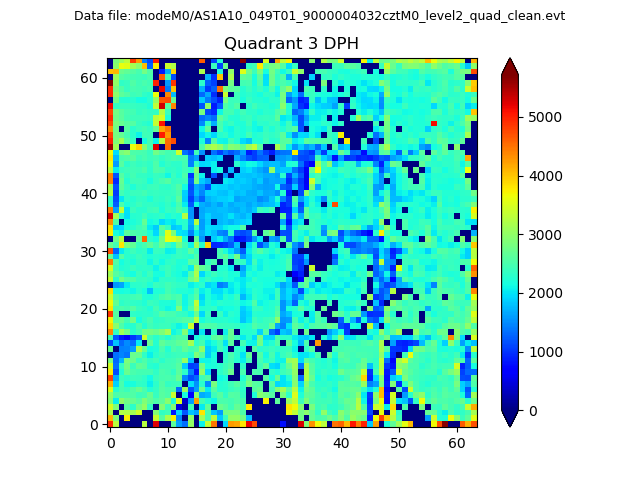 |
 |
Quadrant C |
| Plot type | Count rate plots | Images |
|---|---|---|
| Comparison with Poisson distribution Blue bars denote a histogram of data divided into 1 sec bins. Red curve is a Poisson curve with rate = median count rate of data. |
 |
 |
| Quadrant-wise count rates Data is divided into 100 sec bins |
 |
|
| Module-wise count rates for Quadrant A Data is divided into 100 sec bins |
 |
 |
| Module-wise count rates for Quadrant B Data is divided into 100 sec bins |
 |
 |
| Module-wise count rates for Quadrant C Data is divided into 100 sec bins |
 |
 |
| Module-wise count rates for Quadrant D Data is divided into 100 sec bins |
 |
 |
| Parameter | Plot |
|---|---|
| CZT HV Monitor |  |
| D_VDD |  |
| Temperature 1 |  |
| Veto HV Monitor |  |
| Veto LLD |  |
| Alpha Counter |  |
| _CPM_Rate |  |
| CZT Counter |  |
| +2.5 Volts monitor |  |
| +5 Volts monitor |  |
| _ROLL_ROT |  |
| _Roll_DEC |  |
| _Roll_RA | 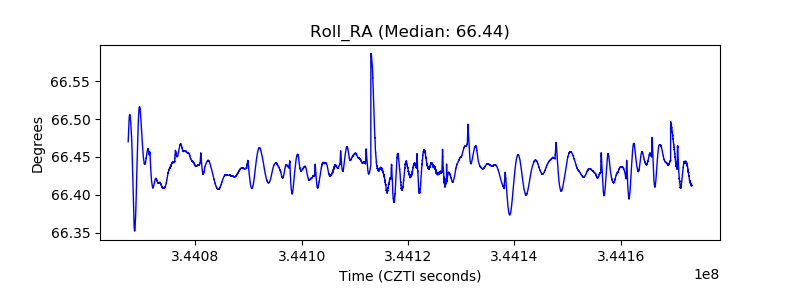 |
| Veto Counter | 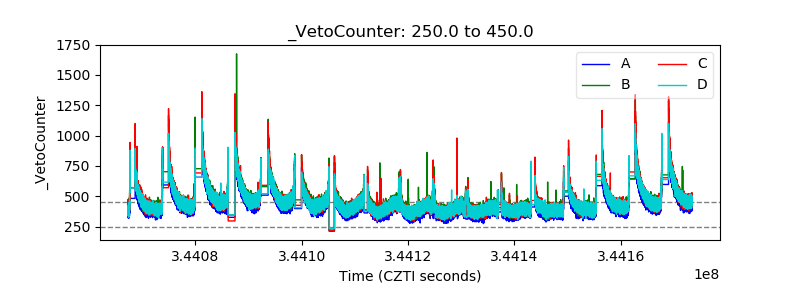 |