| Param | Original file | Final file |
|---|---|---|
| Filename | modeM0/AS1A10_049T01_9000004032_27917cztM0_level2.evt | modeM0/AS1A10_049T01_9000004032_27917cztM0_level2_quad_clean.evt |
| Size (bytes) | 140,523,840 | 29,088,000 |
| Size | 134.0 MB | 27.7 MB |
| Events in quadrant A | 958,836 | 192,064 |
| Events in quadrant B | 992,924 | 195,343 |
| Events in quadrant C | 998,068 | 183,172 |
| Events in quadrant D | 1,183,051 | 180,121 |
| Mode M9 | |||
|---|---|---|---|
| Quadrant | BADHDUFLAG | Total packets | Discarded packets |
| A | 0 | 10 | 0 |
| B | 0 | 10 | 0 |
| C | 0 | 10 | 0 |
| D | 0 | 10 | 0 |
| Mode M0 | |||
|---|---|---|---|
| Quadrant | BADHDUFLAG | Total packets | Discarded packets |
| A | 0 | 3888 | 0 |
| B | 0 | 4032 | 0 |
| C | 0 | 4078 | 0 |
| D | 0 | 4849 | 0 |
| Quadrant | Total seconds | Saturated seconds | Saturation percentage |
|---|---|---|---|
| A | 1777 | 55 | 3.095104% |
| B | 1777 | 69 | 3.882949% |
| C | 1777 | 77 | 4.333146% |
| D | 1777 | 65 | 3.657850% |
Noise dominated data is calculated using 1-second bins in cleaned event files. If a bin has >2000 counts, and if more than 50% of those come from <1% of pixels, then it is considered to be noise-dominated and hence unusable.
| Quadrant | # 1 sec bins | Bins with >0 counts | Bins with >2000 counts | High rate bins dominated by noise | Noise dominated (total time) | Noise dominated (detector-on time) | Marked lightcurve |
|---|---|---|---|---|---|---|---|
| A | 2757 | 1777 | 0 | 0 | 0.00% | 0.00% | 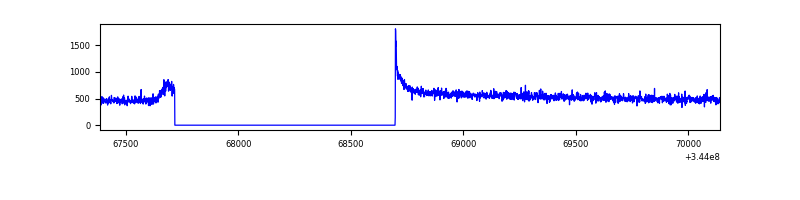 |
| B | 2757 | 1777 | 1 | 1 | 0.04% | 0.06% | 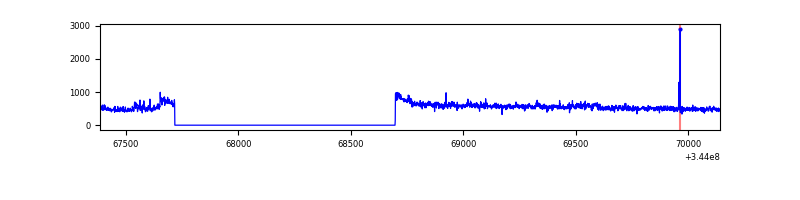 |
| C | 2757 | 1777 | 0 | 0 | 0.00% | 0.00% | 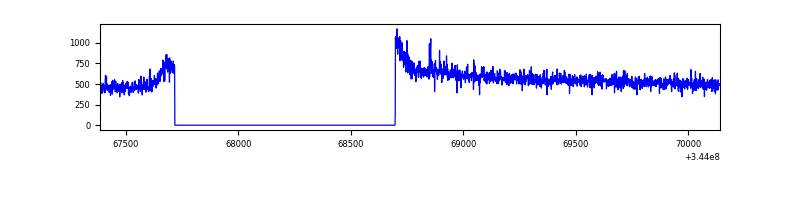 |
| D | 2757 | 1777 | 6 | 6 | 0.22% | 0.34% | 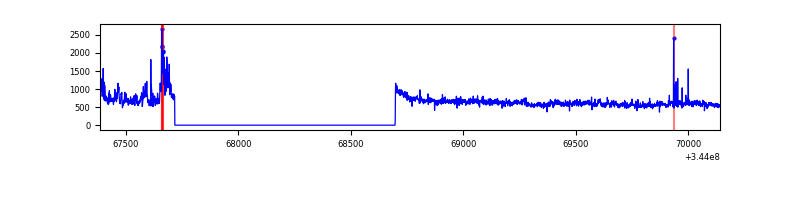 |
Top three noisy pixels from each quadrant. If the there are fewer than three noisy pixels in the level2.evt file, extra rows are filled as -1
| Pixel properties | Quadrant properties | ||||||
|---|---|---|---|---|---|---|---|
| Quadrant | DetID | PixID | Counts | Sigma | Mean | Median | Sigma |
| A | 8 | 192 | 4776 | 88.75 | 247 | 241 | 51.1 |
| A | 13 | 254 | 2911 | 52.25 | 247 | 241 | 51.1 |
| A | 3 | 137 | 2218 | 38.69 | 247 | 241 | 51.1 |
| B | 10 | 245 | 28610 | 594.76 | 245 | 239 | 47.7 |
| B | 12 | 111 | 5661 | 113.66 | 245 | 239 | 47.7 |
| B | 11 | 111 | 5135 | 102.64 | 245 | 239 | 47.7 |
| C | 14 | 238 | 38303 | 662.31 | 242 | 243 | 57.5 |
| C | 3 | 233 | 15773 | 270.25 | 242 | 243 | 57.5 |
| C | 13 | 61 | 1690 | 25.18 | 242 | 243 | 57.5 |
| D | 8 | 195 | 131936 | 2272.55 | 241 | 233 | 58.0 |
| D | 1 | 52 | 83420 | 1435.4 | 241 | 233 | 58.0 |
| D | 13 | 104 | 30841 | 528.14 | 241 | 233 | 58.0 |
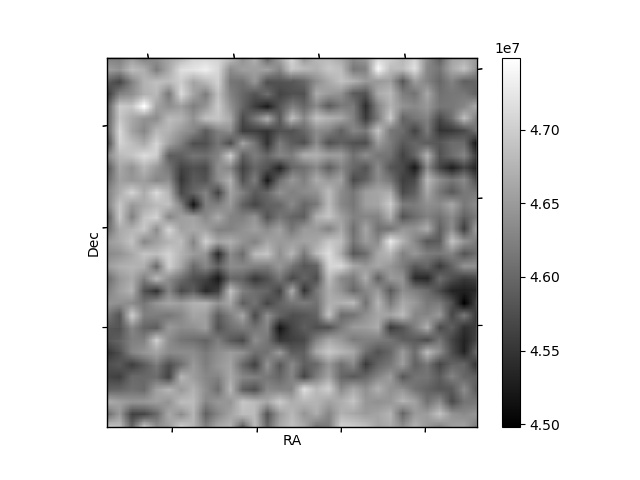
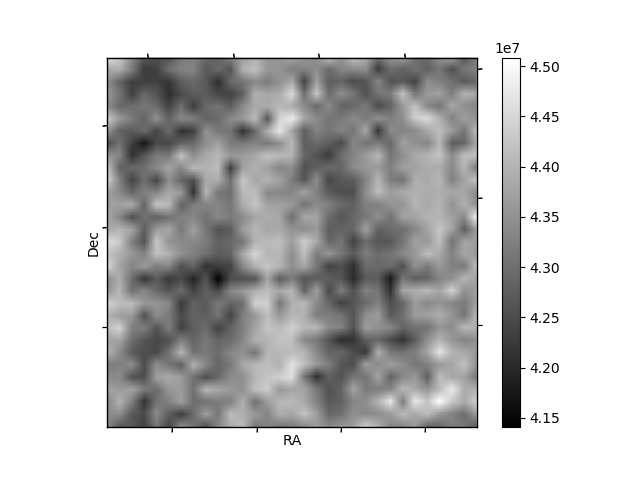
Histogram calculated using DETX and DETY for each event in the final _common_clean file
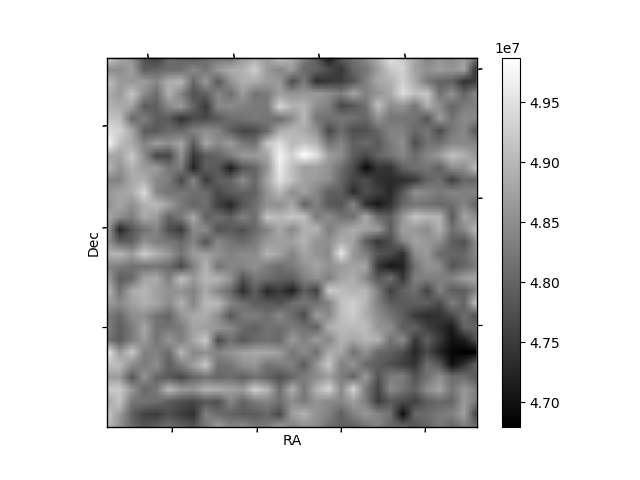
| Quadrant A | 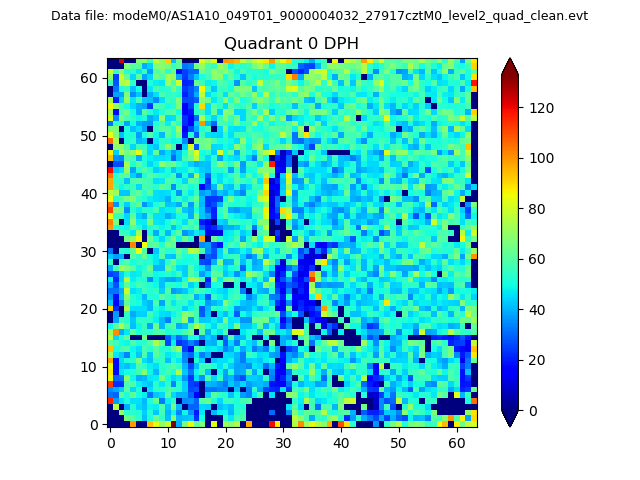 |
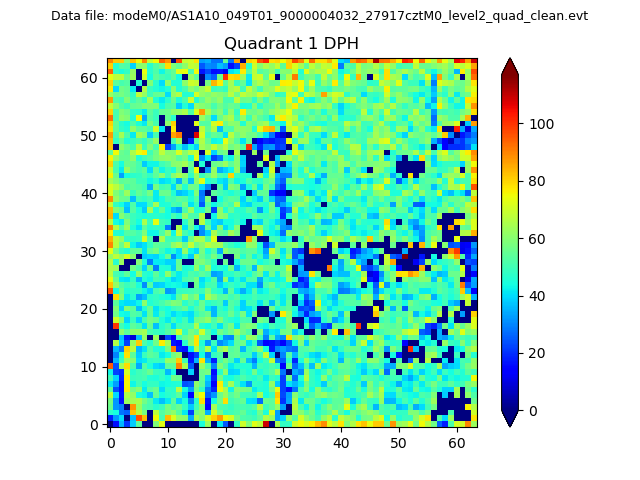 |
Quadrant B |
|---|---|---|---|
| Quadrant D | 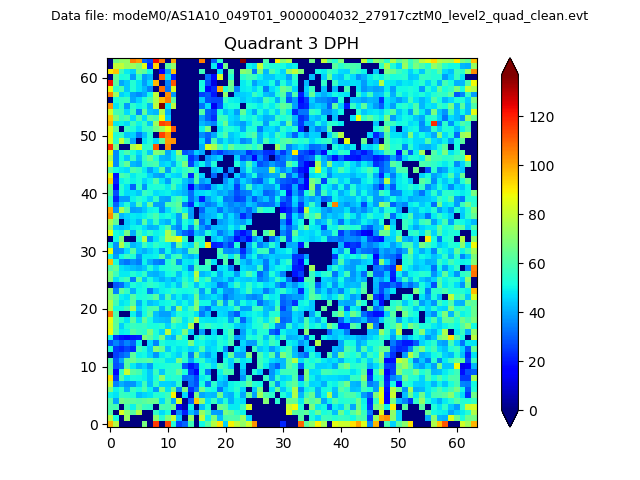 |
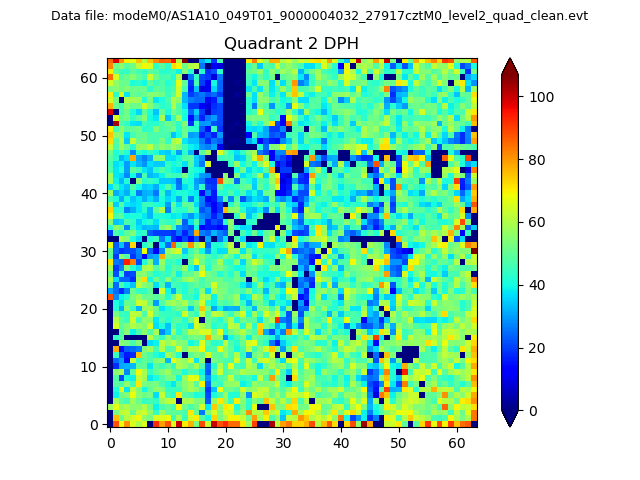 |
Quadrant C |
| Plot type | Count rate plots | Images |
|---|---|---|
| Comparison with Poisson distribution Blue bars denote a histogram of data divided into 1 sec bins. Red curve is a Poisson curve with rate = median count rate of data. |
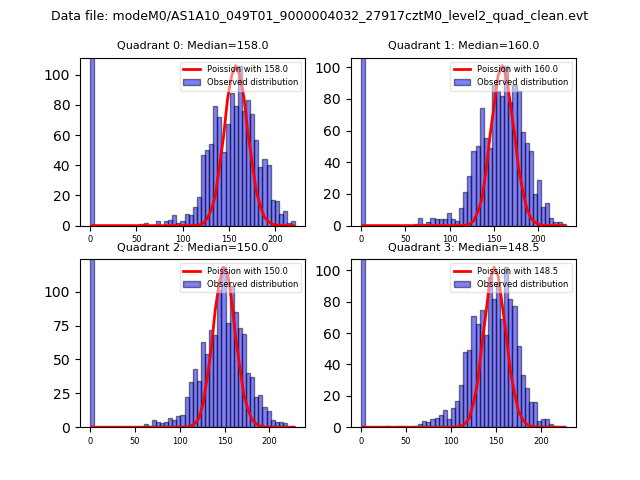 |
 |
| Quadrant-wise count rates Data is divided into 100 sec bins |
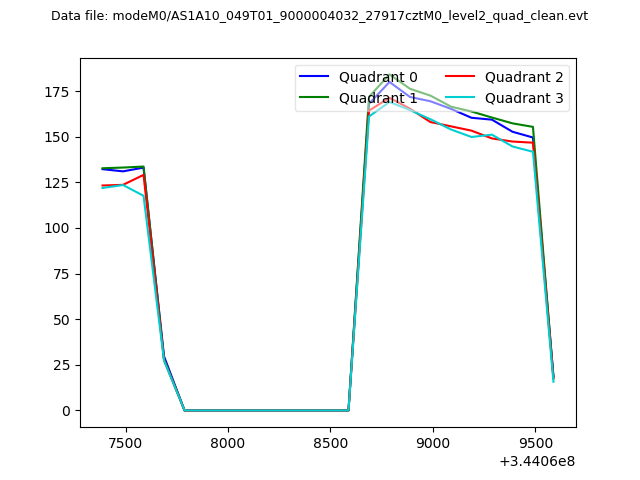 |
|
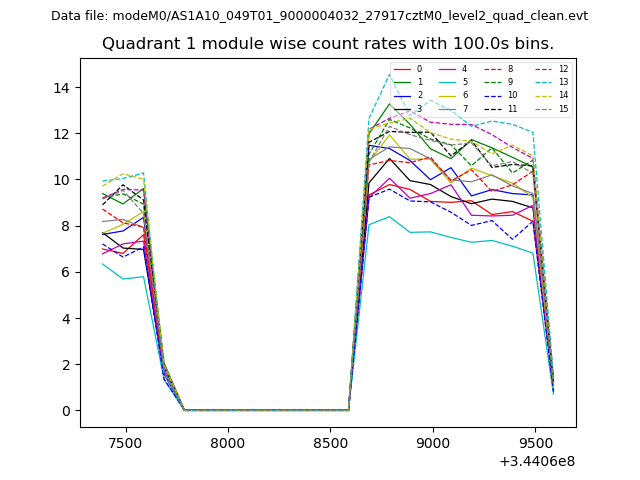
| Module-wise count rates for Quadrant A Data is divided into 100 sec bins |
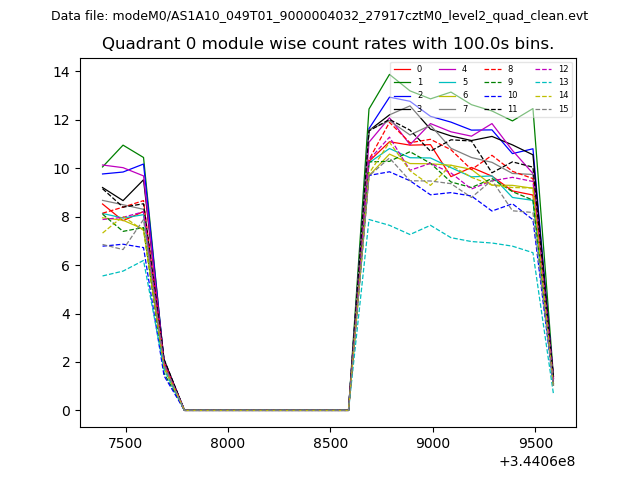 |
 |
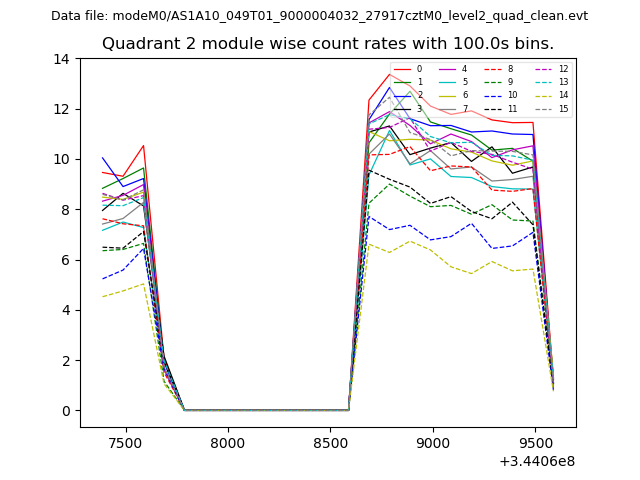
| Module-wise count rates for Quadrant B Data is divided into 100 sec bins |
 |
 |
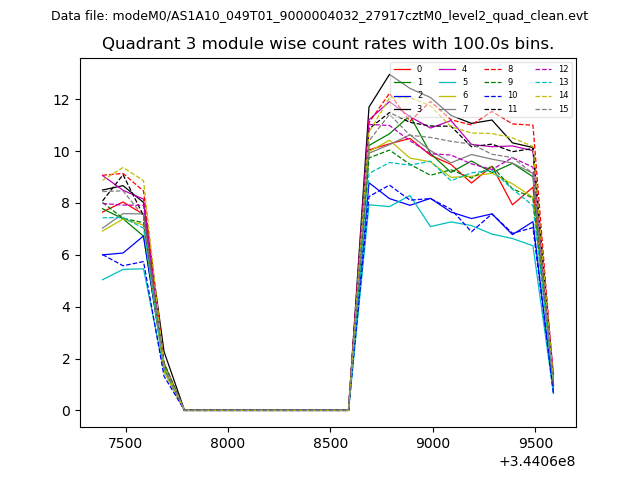
| Module-wise count rates for Quadrant C Data is divided into 100 sec bins |
 |
 |
| Module-wise count rates for Quadrant D Data is divided into 100 sec bins |
 |
 |
| Parameter | Plot |
|---|---|
| CZT HV Monitor | 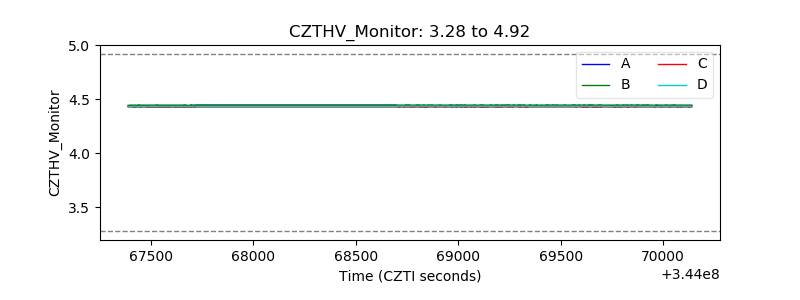 |
| D_VDD |  |
| Temperature 1 | 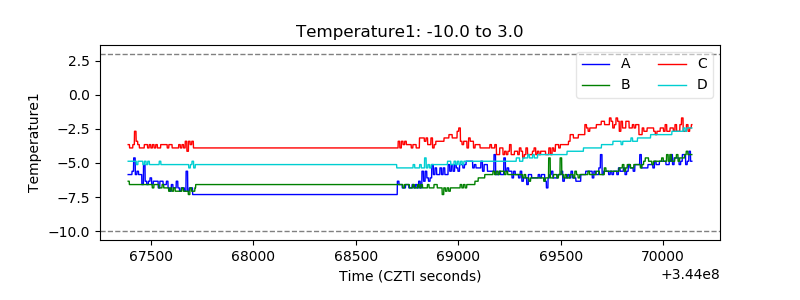 |
| Veto HV Monitor | 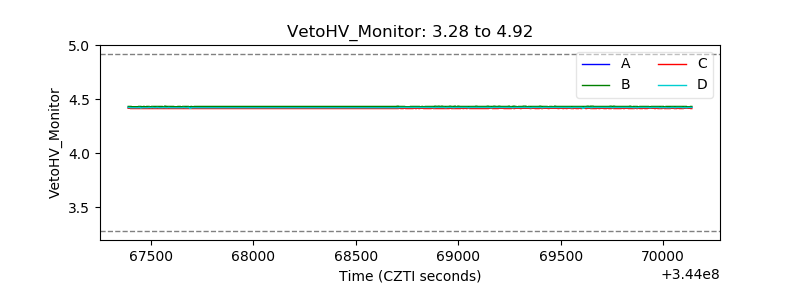 |
| Veto LLD | 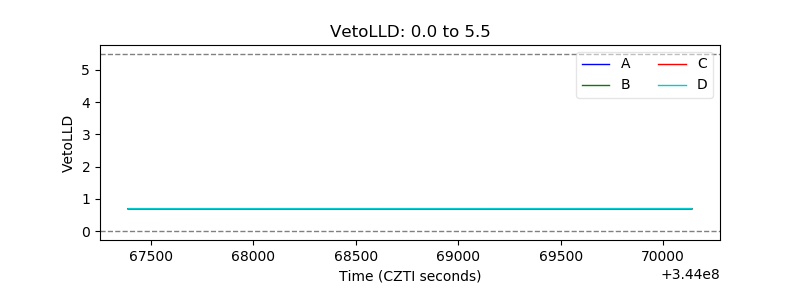 |
| Alpha Counter | 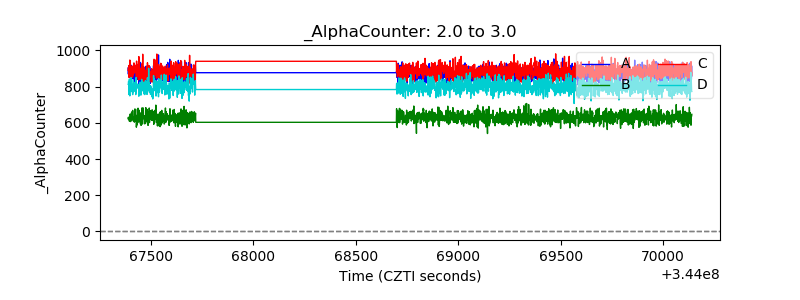 |
| _CPM_Rate | 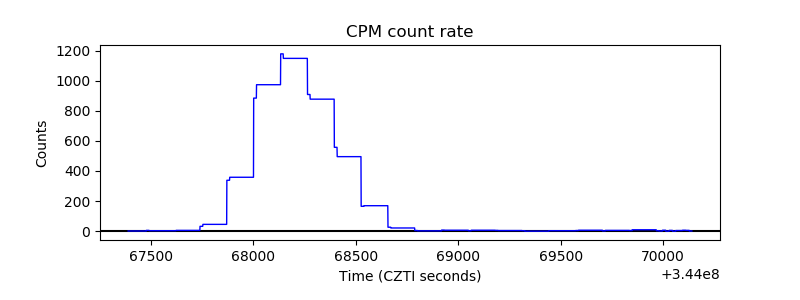 |
| CZT Counter | 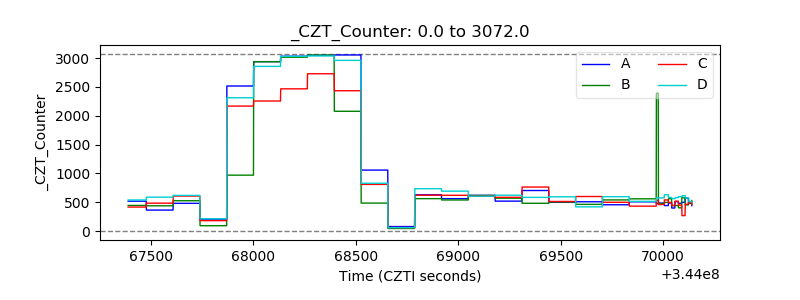 |
| +2.5 Volts monitor |  |
| +5 Volts monitor |  |
| _ROLL_ROT | 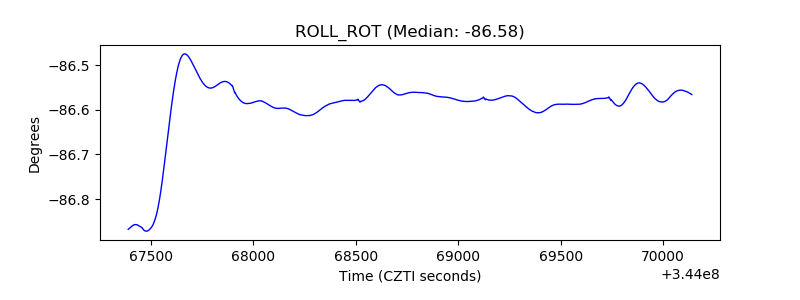 |
| _Roll_DEC | 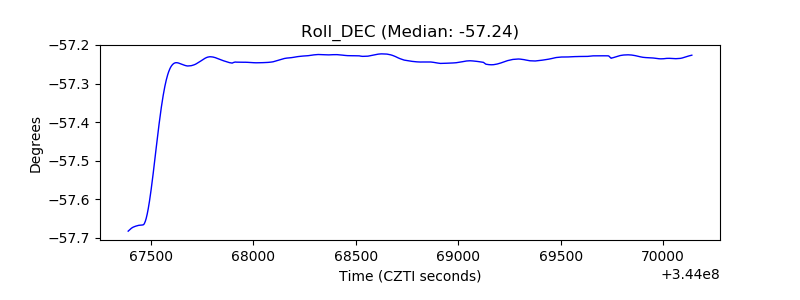 |
| _Roll_RA |  |
| Veto Counter | 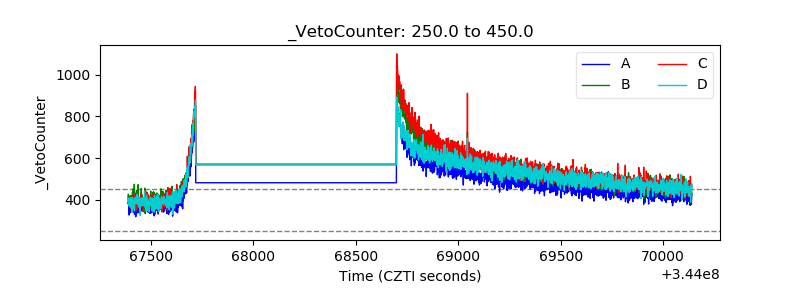 |