| Param | Original file | Final file |
|---|---|---|
| Filename | modeM0/AS1A10_049T01_9000004032_27920cztM0_level2.evt | modeM0/AS1A10_049T01_9000004032_27920cztM0_level2_quad_clean.evt |
| Size (bytes) | 550,120,320 | 82,123,200 |
| Size | 524.6 MB | 78.3 MB |
| Events in quadrant A | 3,465,754 | 526,391 |
| Events in quadrant B | 3,968,399 | 525,306 |
| Events in quadrant C | 3,606,919 | 500,989 |
| Events in quadrant D | 5,185,582 | 487,186 |
| Mode M9 | |||
|---|---|---|---|
| Quadrant | BADHDUFLAG | Total packets | Discarded packets |
| A | 0 | 12 | 0 |
| B | 0 | 13 | 0 |
| C | 0 | 13 | 0 |
| D | 0 | 13 | 0 |
| Mode M0 | |||
|---|---|---|---|
| Quadrant | BADHDUFLAG | Total packets | Discarded packets |
| A | 0 | 14483 | 0 |
| B | 0 | 16039 | 0 |
| C | 0 | 14992 | 0 |
| D | 0 | 20122 | 0 |
| Quadrant | Total seconds | Saturated seconds | Saturation percentage |
|---|---|---|---|
| A | 6405 | 82 | 1.280250% |
| B | 6405 | 155 | 2.419984% |
| C | 6405 | 163 | 2.544887% |
| D | 6404 | 280 | 4.372267% |
Noise dominated data is calculated using 1-second bins in cleaned event files. If a bin has >2000 counts, and if more than 50% of those come from <1% of pixels, then it is considered to be noise-dominated and hence unusable.
| Quadrant | # 1 sec bins | Bins with >0 counts | Bins with >2000 counts | High rate bins dominated by noise | Noise dominated (total time) | Noise dominated (detector-on time) | Marked lightcurve |
|---|---|---|---|---|---|---|---|
| A | 7625 | 6405 | 0 | 0 | 0.00% | 0.00% | 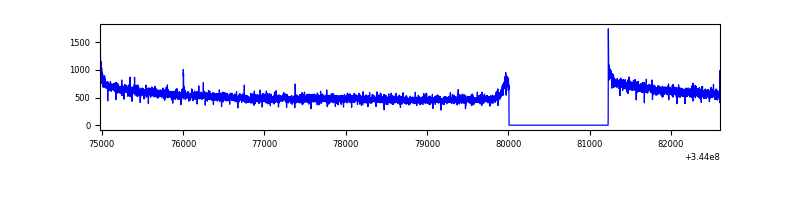 |
| B | 7625 | 6405 | 38 | 38 | 0.50% | 0.59% |  |
| C | 7625 | 6405 | 0 | 0 | 0.00% | 0.00% | 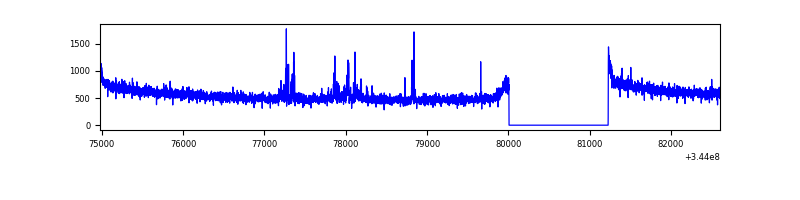 |
| D | 7624 | 6404 | 156 | 156 | 2.05% | 2.44% | 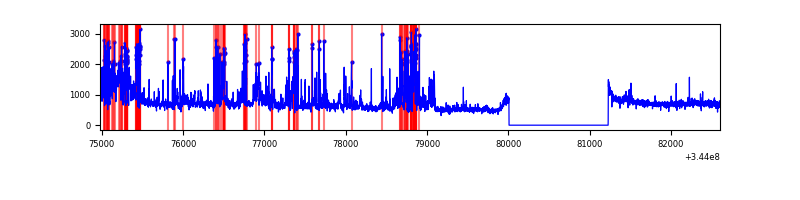 |
Top three noisy pixels from each quadrant. If the there are fewer than three noisy pixels in the level2.evt file, extra rows are filled as -1
| Pixel properties | Quadrant properties | ||||||
|---|---|---|---|---|---|---|---|
| Quadrant | DetID | PixID | Counts | Sigma | Mean | Median | Sigma |
| A | 13 | 254 | 10462 | 54.97 | 896 | 882 | 174.3 |
| A | 8 | 192 | 8919 | 46.12 | 896 | 882 | 174.3 |
| A | 0 | 226 | 7743 | 39.37 | 896 | 882 | 174.3 |
| B | 10 | 245 | 453700 | 2835.8 | 879 | 860 | 159.7 |
| B | 12 | 111 | 18678 | 111.58 | 879 | 860 | 159.7 |
| B | 0 | 230 | 17931 | 106.9 | 879 | 860 | 159.7 |
| C | 14 | 238 | 142399 | 729.8 | 851 | 857 | 193.9 |
| C | 3 | 233 | 130063 | 666.2 | 851 | 857 | 193.9 |
| C | 15 | 208 | 14965 | 72.74 | 851 | 857 | 193.9 |
| D | 1 | 52 | 710331 | 3554.07 | 860 | 839 | 199.6 |
| D | 8 | 195 | 687108 | 3437.74 | 860 | 839 | 199.6 |
| D | 6 | 112 | 460757 | 2303.87 | 860 | 839 | 199.6 |
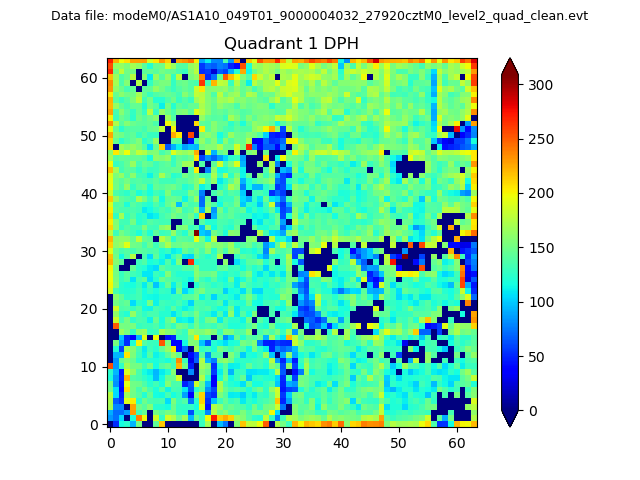
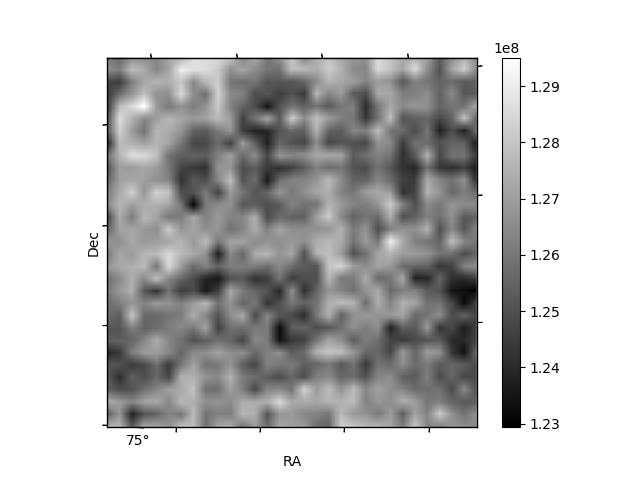
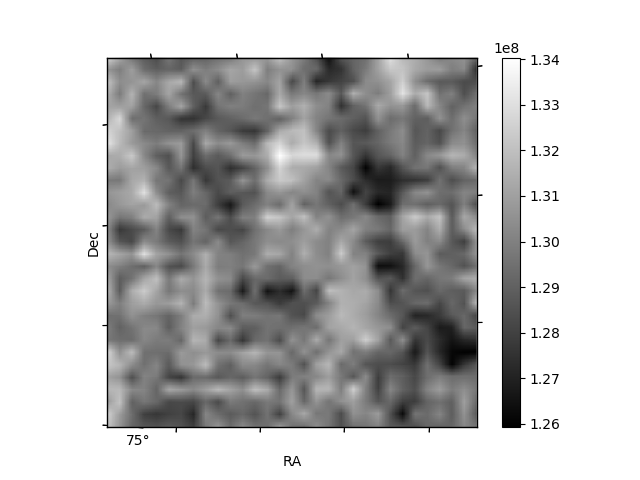
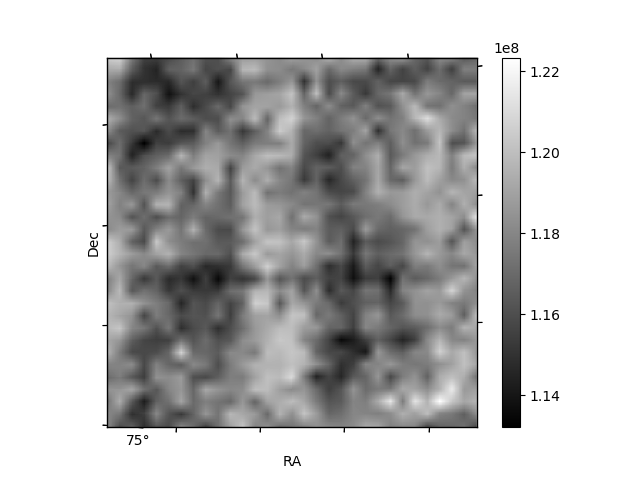
Histogram calculated using DETX and DETY for each event in the final _common_clean file
| Quadrant A | 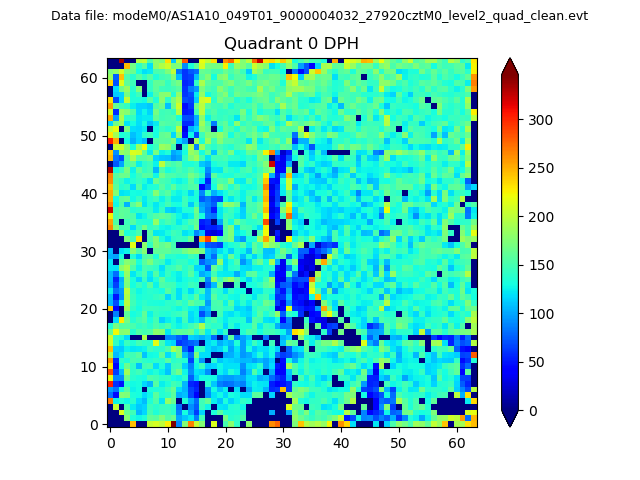 |
 |
Quadrant B |
|---|---|---|---|
| Quadrant D | 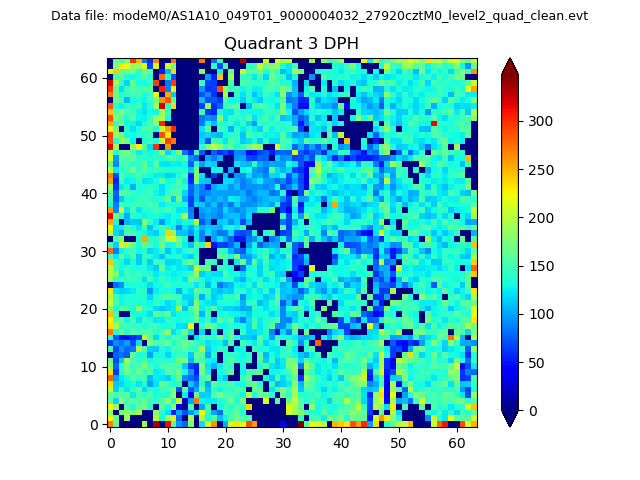 |
 |
Quadrant C |
| Plot type | Count rate plots | Images |
|---|---|---|
| Comparison with Poisson distribution Blue bars denote a histogram of data divided into 1 sec bins. Red curve is a Poisson curve with rate = median count rate of data. |
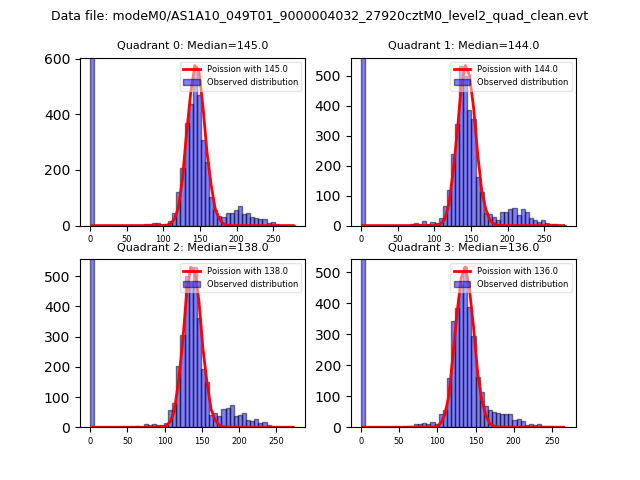 |
 |
| Quadrant-wise count rates Data is divided into 100 sec bins |
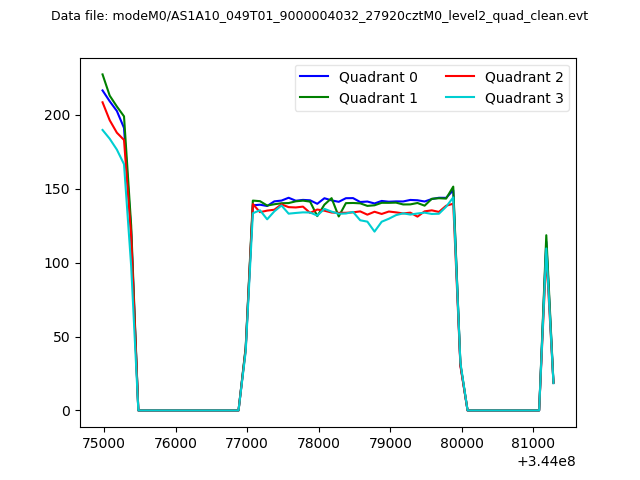 |
|
| Module-wise count rates for Quadrant A Data is divided into 100 sec bins |
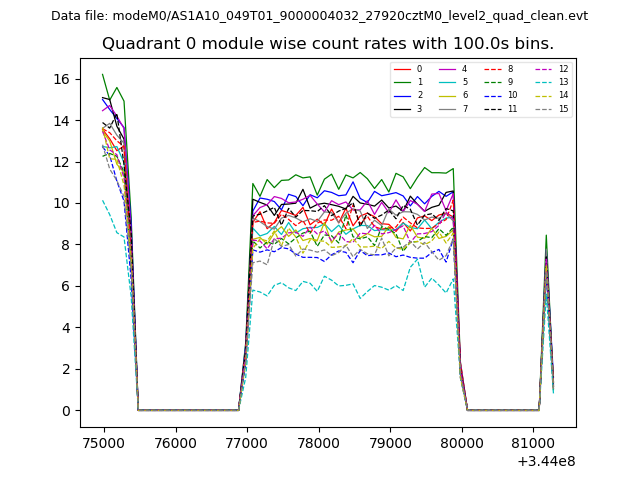 |
 |
| Module-wise count rates for Quadrant B Data is divided into 100 sec bins |
 |
 |
| Module-wise count rates for Quadrant C Data is divided into 100 sec bins |
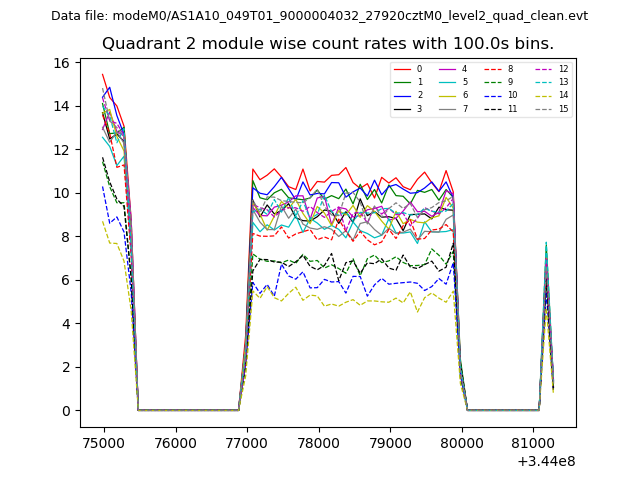 |
 |
| Module-wise count rates for Quadrant D Data is divided into 100 sec bins |
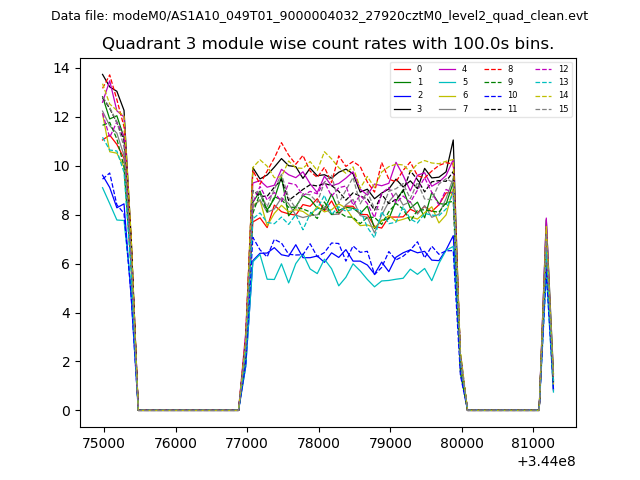 |
 |
| Parameter | Plot |
|---|---|
| CZT HV Monitor | 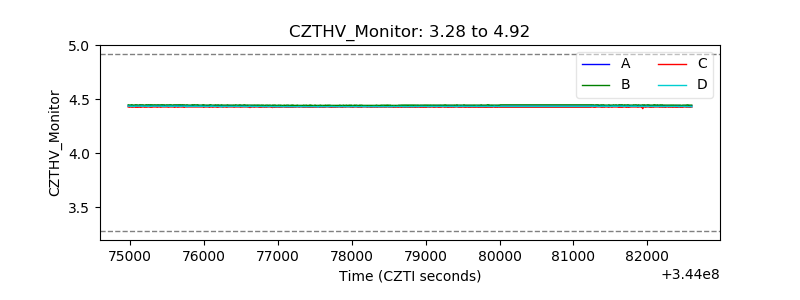 |
| D_VDD | 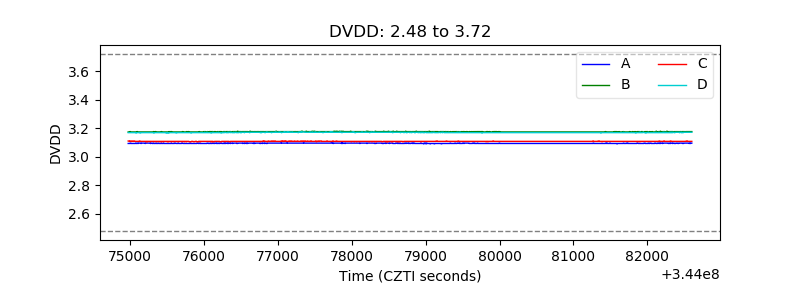 |
| Temperature 1 | 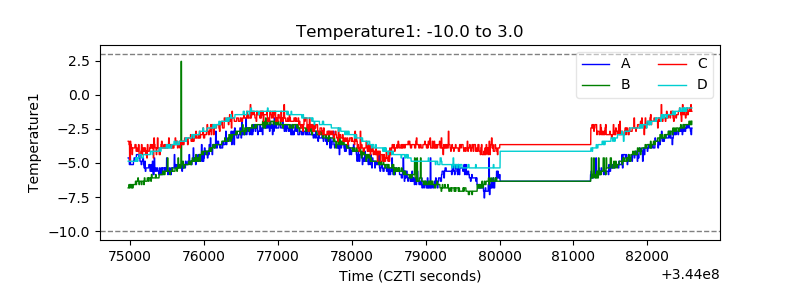 |
| Veto HV Monitor |  |
| Veto LLD | 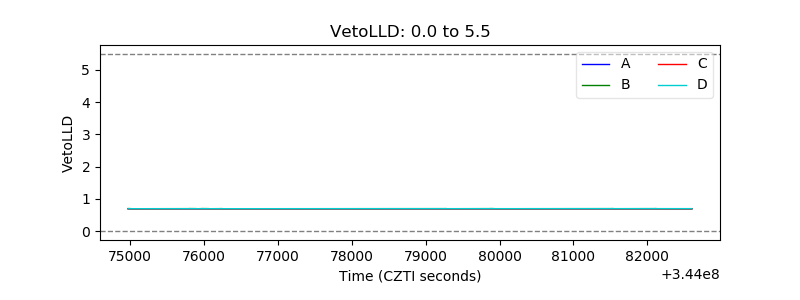 |
| Alpha Counter | 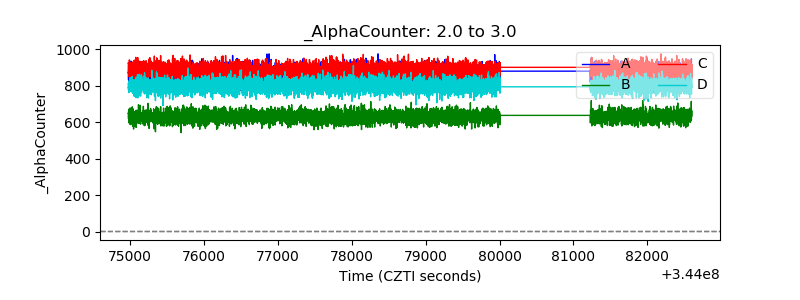 |
| _CPM_Rate |  |
| CZT Counter |  |
| +2.5 Volts monitor |  |
| +5 Volts monitor | 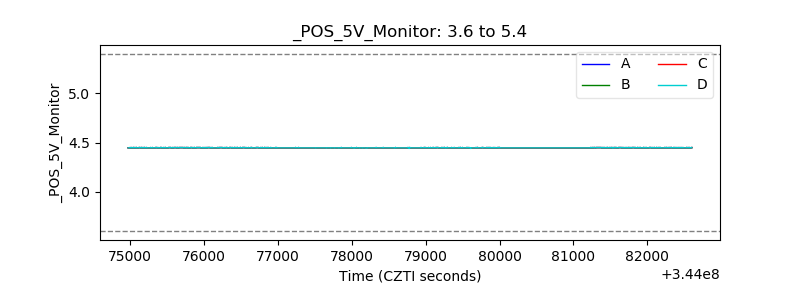 |
| _ROLL_ROT |  |
| _Roll_DEC | 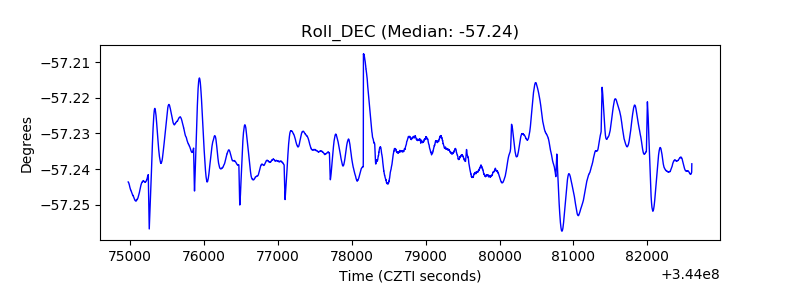 |
| _Roll_RA |  |
| Veto Counter | 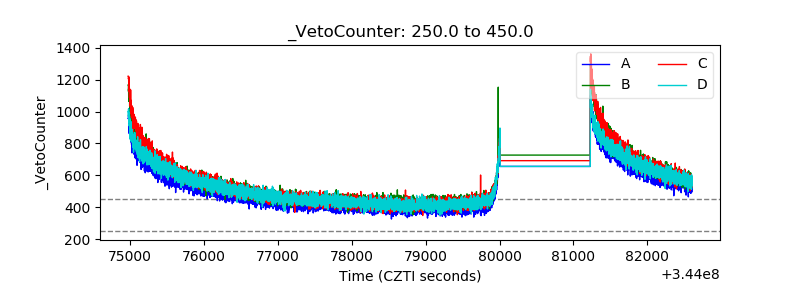 |