| Param | Original file | Final file |
|---|---|---|
| Filename | modeM0/AS1A10_049T01_9000004032_27922cztM0_level2.evt | modeM0/AS1A10_049T01_9000004032_27922cztM0_level2_quad_clean.evt |
| Size (bytes) | 598,253,760 | 102,813,120 |
| Size | 570.5 MB | 98.1 MB |
| Events in quadrant A | 3,661,429 | 692,988 |
| Events in quadrant B | 4,589,115 | 686,860 |
| Events in quadrant C | 3,657,854 | 648,719 |
| Events in quadrant D | 5,769,932 | 631,134 |
| Mode M9 | |||
|---|---|---|---|
| Quadrant | BADHDUFLAG | Total packets | Discarded packets |
| A | 0 | 16 | 0 |
| B | 0 | 17 | 0 |
| C | 0 | 17 | 0 |
| D | 0 | 17 | 0 |
| Mode M0 | |||
|---|---|---|---|
| Quadrant | BADHDUFLAG | Total packets | Discarded packets |
| A | 0 | 15130 | 0 |
| B | 0 | 18065 | 0 |
| C | 0 | 15060 | 0 |
| D | 0 | 21867 | 0 |
| Quadrant | Total seconds | Saturated seconds | Saturation percentage |
|---|---|---|---|
| A | 6501 | 111 | 1.707430% |
| B | 6501 | 192 | 2.953392% |
| C | 6501 | 154 | 2.368866% |
| D | 6501 | 226 | 3.476388% |
Noise dominated data is calculated using 1-second bins in cleaned event files. If a bin has >2000 counts, and if more than 50% of those come from <1% of pixels, then it is considered to be noise-dominated and hence unusable.
| Quadrant | # 1 sec bins | Bins with >0 counts | Bins with >2000 counts | High rate bins dominated by noise | Noise dominated (total time) | Noise dominated (detector-on time) | Marked lightcurve |
|---|---|---|---|---|---|---|---|
| A | 7836 | 6501 | 0 | 0 | 0.00% | 0.00% |  |
| B | 7836 | 6501 | 23 | 23 | 0.29% | 0.35% |  |
| C | 7836 | 6501 | 0 | 0 | 0.00% | 0.00% |  |
| D | 7836 | 6501 | 152 | 152 | 1.94% | 2.34% |  |
Top three noisy pixels from each quadrant. If the there are fewer than three noisy pixels in the level2.evt file, extra rows are filled as -1
| Pixel properties | Quadrant properties | ||||||
|---|---|---|---|---|---|---|---|
| Quadrant | DetID | PixID | Counts | Sigma | Mean | Median | Sigma |
| A | 15 | 174 | 17704 | 91.73 | 943 | 929 | 182.9 |
| A | 13 | 254 | 10513 | 52.41 | 943 | 929 | 182.9 |
| A | 8 | 192 | 9404 | 46.34 | 943 | 929 | 182.9 |
| B | 10 | 245 | 887182 | 5287.56 | 926 | 910 | 167.6 |
| B | 0 | 230 | 40285 | 234.91 | 926 | 910 | 167.6 |
| B | 12 | 111 | 19523 | 111.05 | 926 | 910 | 167.6 |
| C | 14 | 238 | 147130 | 731.52 | 881 | 886 | 199.9 |
| C | 3 | 233 | 76669 | 379.07 | 881 | 886 | 199.9 |
| C | 13 | 61 | 6079 | 25.98 | 881 | 886 | 199.9 |
| D | 8 | 195 | 1217841 | 5880.58 | 893 | 871 | 206.9 |
| D | 1 | 52 | 538797 | 2599.34 | 893 | 871 | 206.9 |
| D | 6 | 112 | 405030 | 1952.96 | 893 | 871 | 206.9 |
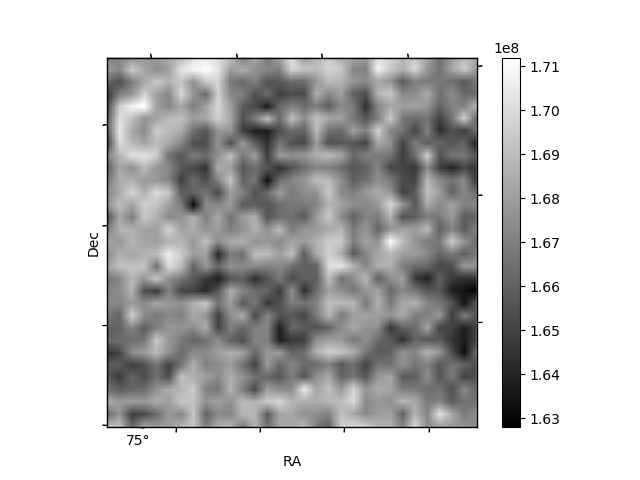
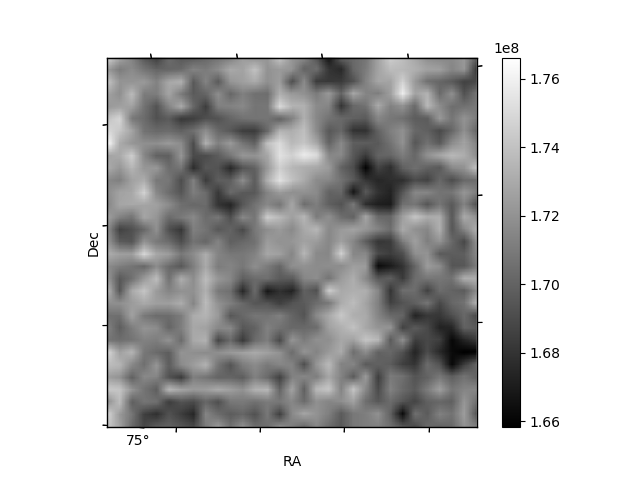
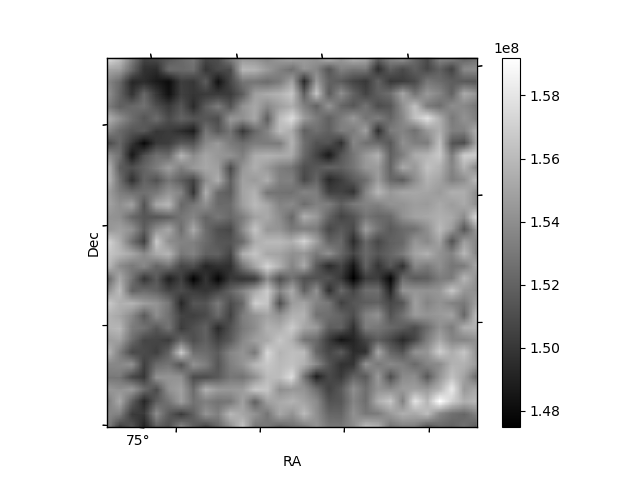
Histogram calculated using DETX and DETY for each event in the final _common_clean file
| Quadrant A | 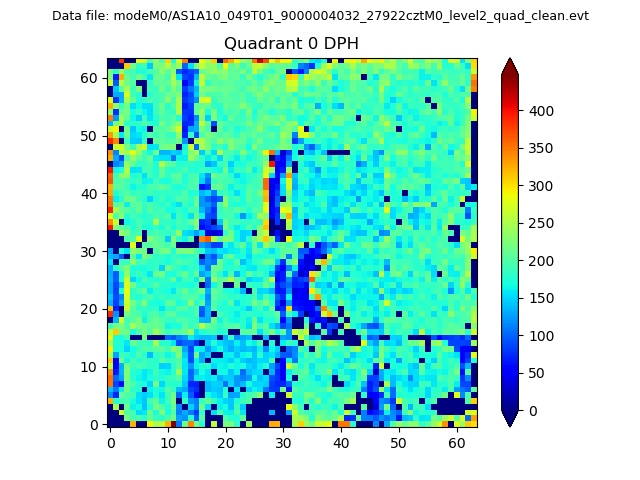 |
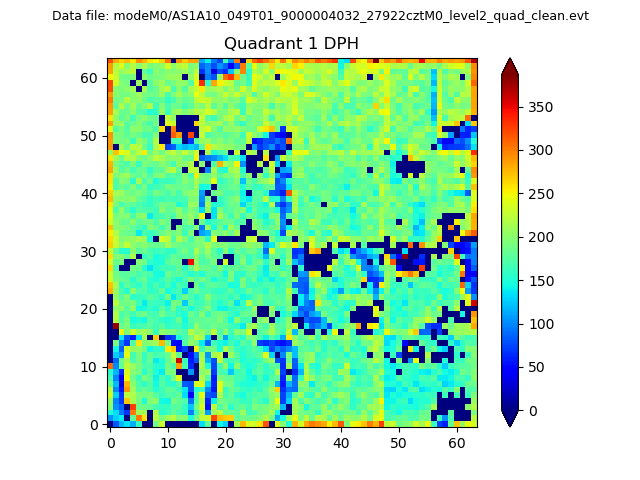 |
Quadrant B |
|---|---|---|---|
| Quadrant D | 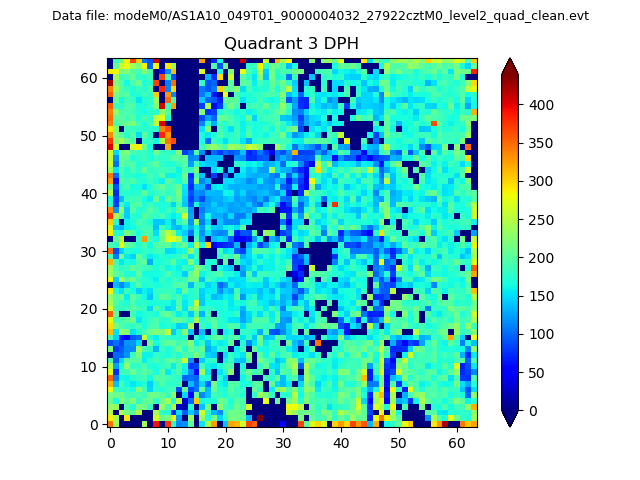 |
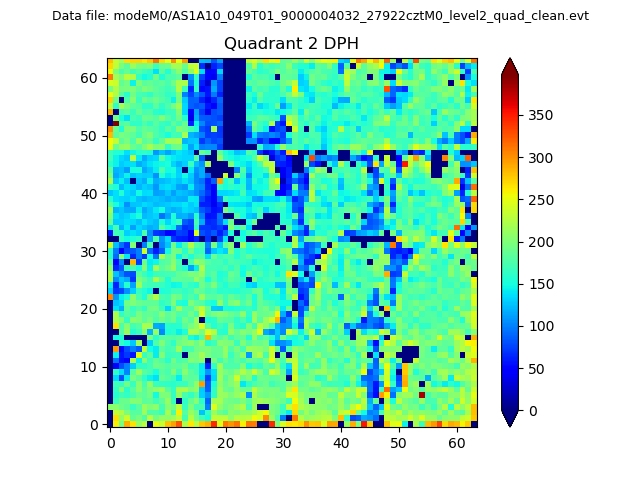 |
Quadrant C |
| Plot type | Count rate plots | Images |
|---|---|---|
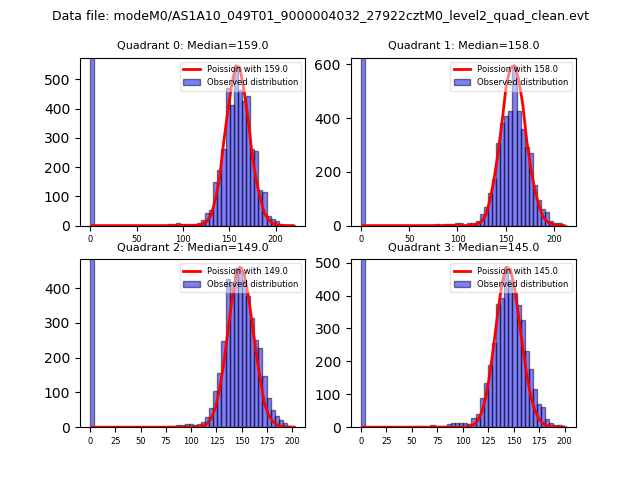
| Comparison with Poisson distribution Blue bars denote a histogram of data divided into 1 sec bins. Red curve is a Poisson curve with rate = median count rate of data. |
 |
 |
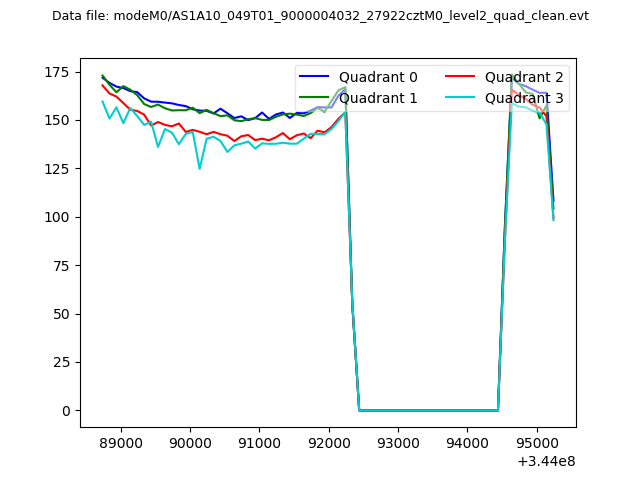
| Quadrant-wise count rates Data is divided into 100 sec bins |
 |
|
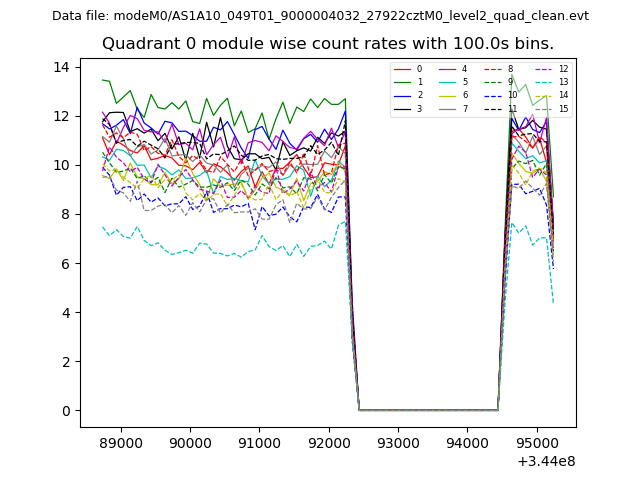
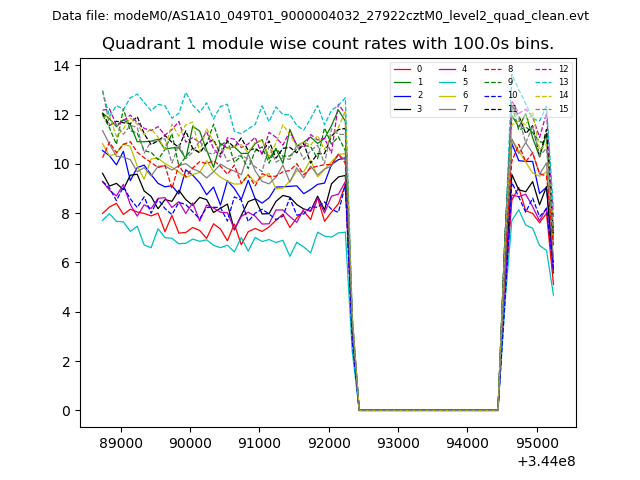
| Module-wise count rates for Quadrant A Data is divided into 100 sec bins |
 |
 |
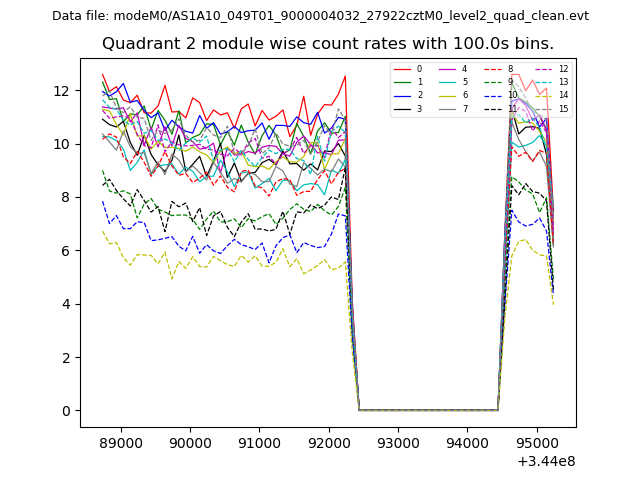
| Module-wise count rates for Quadrant B Data is divided into 100 sec bins |
 |
 |
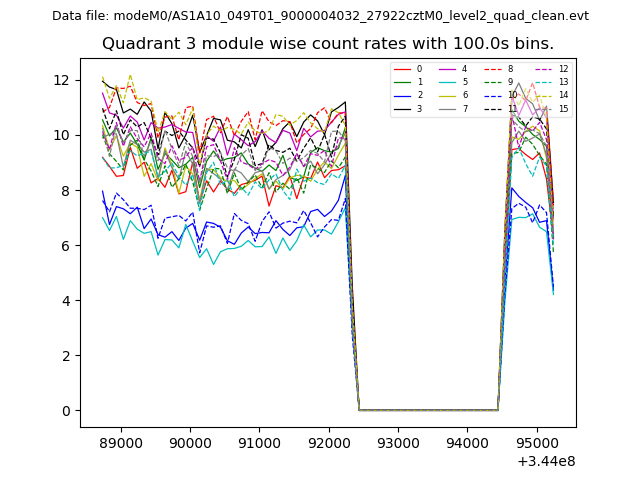
| Module-wise count rates for Quadrant C Data is divided into 100 sec bins |
 |
 |
| Module-wise count rates for Quadrant D Data is divided into 100 sec bins |
 |
 |
| Parameter | Plot |
|---|---|
| CZT HV Monitor | 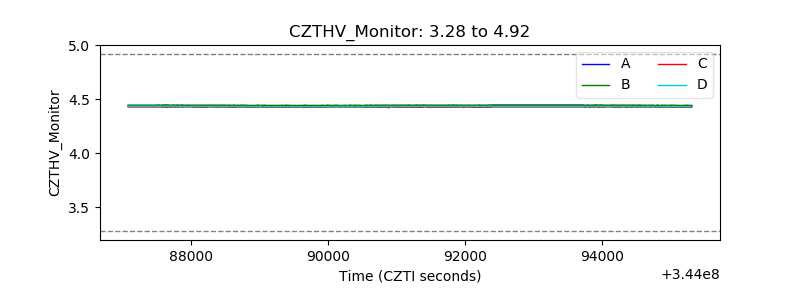 |
| D_VDD | 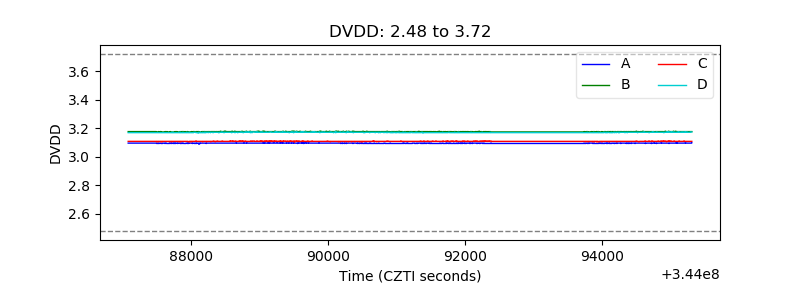 |
| Temperature 1 | 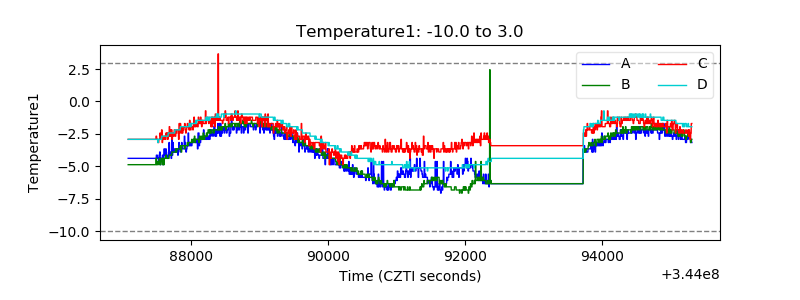 |
| Veto HV Monitor | 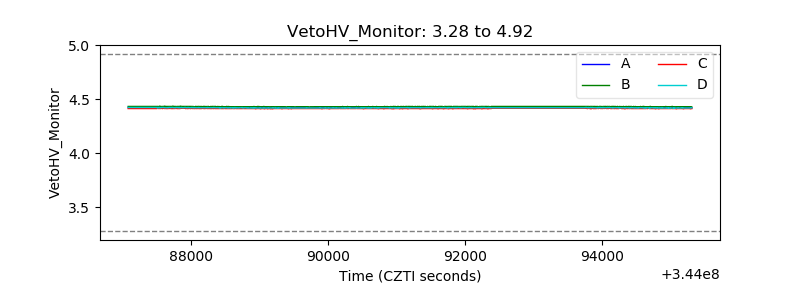 |
| Veto LLD | 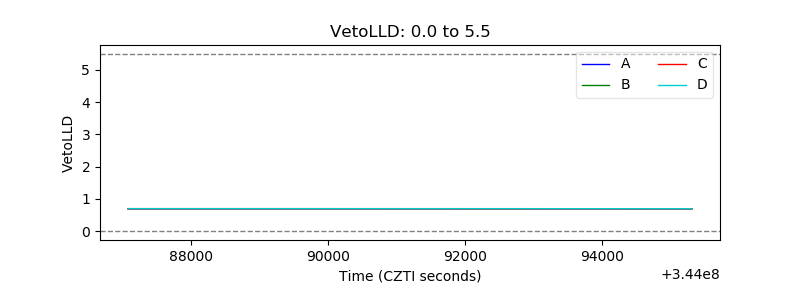 |
| Alpha Counter | 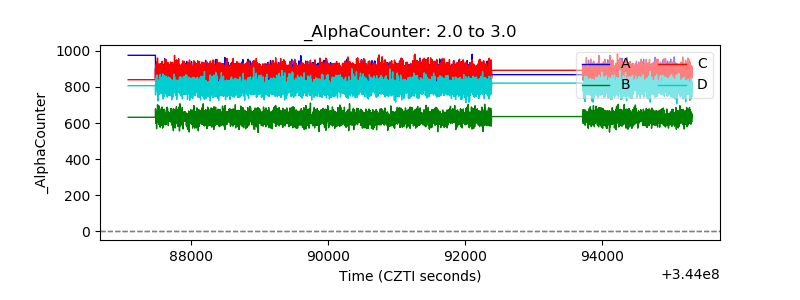 |
| _CPM_Rate | 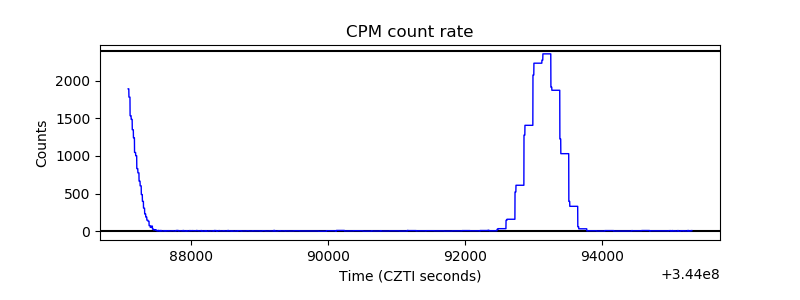 |
| CZT Counter | 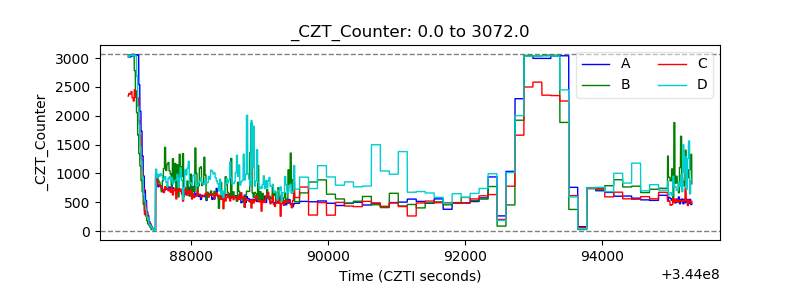 |
| +2.5 Volts monitor |  |
| +5 Volts monitor |  |
| _ROLL_ROT | 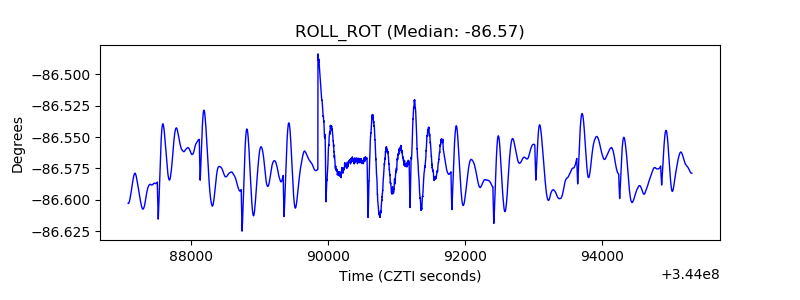 |
| _Roll_DEC | 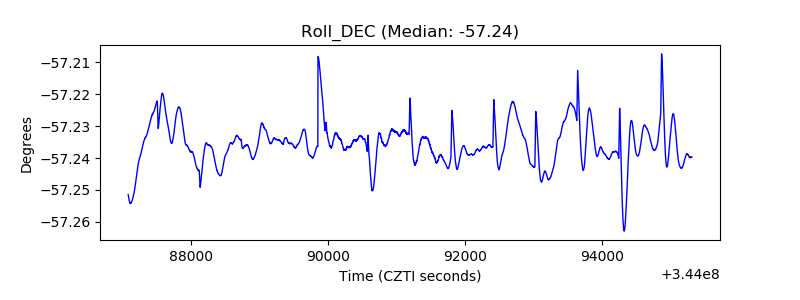 |
| _Roll_RA |  |
| Veto Counter | 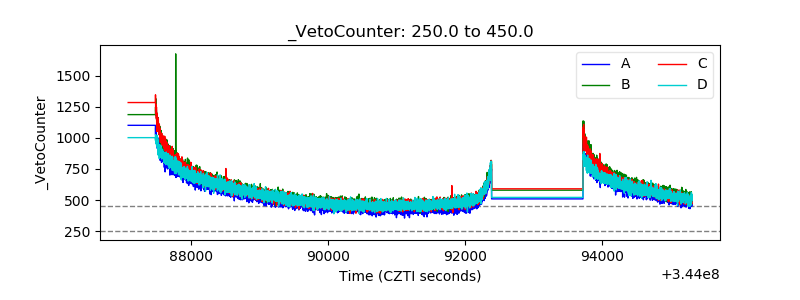 |