| Param | Original file | Final file |
|---|---|---|
| Filename | modeM0/AS1A10_049T01_9000004032_27923cztM0_level2.evt | modeM0/AS1A10_049T01_9000004032_27923cztM0_level2_quad_clean.evt |
| Size (bytes) | 517,772,160 | 115,784,640 |
| Size | 493.8 MB | 110.4 MB |
| Events in quadrant A | 3,063,940 | 807,409 |
| Events in quadrant B | 4,146,390 | 801,053 |
| Events in quadrant C | 3,060,328 | 754,039 |
| Events in quadrant D | 5,012,949 | 734,489 |
| Mode M9 | |||
|---|---|---|---|
| Quadrant | BADHDUFLAG | Total packets | Discarded packets |
| A | 0 | 13 | 0 |
| B | 0 | 13 | 0 |
| C | 0 | 13 | 0 |
| D | 0 | 13 | 0 |
| Mode M0 | |||
|---|---|---|---|
| Quadrant | BADHDUFLAG | Total packets | Discarded packets |
| A | 0 | 12576 | 0 |
| B | 0 | 16127 | 0 |
| C | 0 | 12616 | 0 |
| D | 0 | 18918 | 0 |
| Quadrant | Total seconds | Saturated seconds | Saturation percentage |
|---|---|---|---|
| A | 5867 | 114 | 1.943071% |
| B | 5868 | 225 | 3.834356% |
| C | 5867 | 133 | 2.266917% |
| D | 5867 | 283 | 4.823590% |
Noise dominated data is calculated using 1-second bins in cleaned event files. If a bin has >2000 counts, and if more than 50% of those come from <1% of pixels, then it is considered to be noise-dominated and hence unusable.
| Quadrant | # 1 sec bins | Bins with >0 counts | Bins with >2000 counts | High rate bins dominated by noise | Noise dominated (total time) | Noise dominated (detector-on time) | Marked lightcurve |
|---|---|---|---|---|---|---|---|
| A | 7152 | 5867 | 0 | 0 | 0.00% | 0.00% | 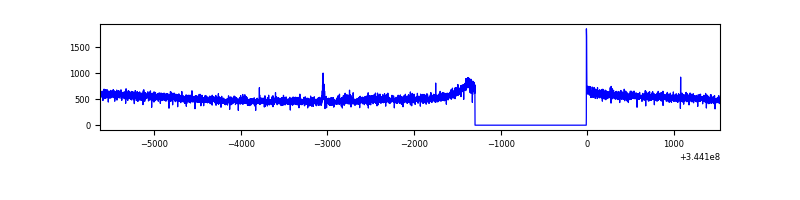 |
| B | 7153 | 5868 | 50 | 50 | 0.70% | 0.85% | 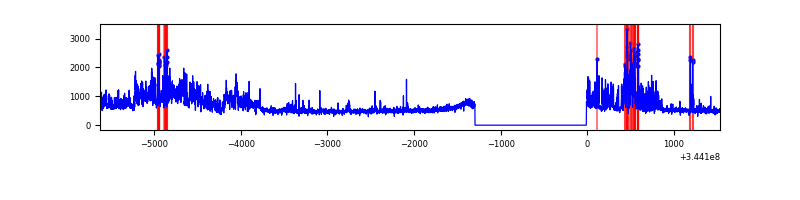 |
| C | 7152 | 5867 | 0 | 0 | 0.00% | 0.00% | 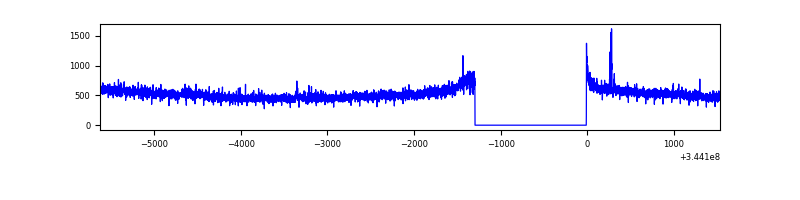 |
| D | 7152 | 5867 | 219 | 219 | 3.06% | 3.73% | 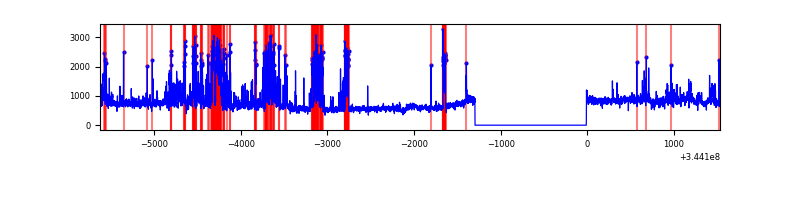 |
Top three noisy pixels from each quadrant. If the there are fewer than three noisy pixels in the level2.evt file, extra rows are filled as -1
| Pixel properties | Quadrant properties | ||||||
|---|---|---|---|---|---|---|---|
| Quadrant | DetID | PixID | Counts | Sigma | Mean | Median | Sigma |
| A | 4 | 2 | 21446 | 131.97 | 788 | 774 | 156.6 |
| A | 13 | 254 | 9833 | 57.83 | 788 | 774 | 156.6 |
| A | 3 | 137 | 6965 | 39.52 | 788 | 774 | 156.6 |
| B | 10 | 245 | 753488 | 5269.12 | 773 | 756 | 142.9 |
| B | 0 | 230 | 239243 | 1669.41 | 773 | 756 | 142.9 |
| B | 15 | 32 | 107632 | 748.13 | 773 | 756 | 142.9 |
| C | 14 | 238 | 121217 | 716.49 | 734 | 738 | 168.2 |
| C | 3 | 233 | 66884 | 393.37 | 734 | 738 | 168.2 |
| C | 2 | 16 | 11510 | 64.06 | 734 | 738 | 168.2 |
| D | 8 | 195 | 953600 | 5536.91 | 739 | 719 | 172.1 |
| D | 1 | 52 | 482133 | 2797.35 | 739 | 719 | 172.1 |
| D | 7 | 238 | 262145 | 1519.07 | 739 | 719 | 172.1 |
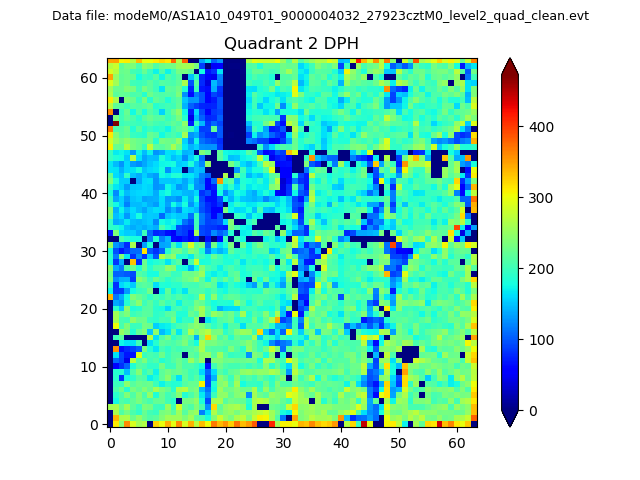
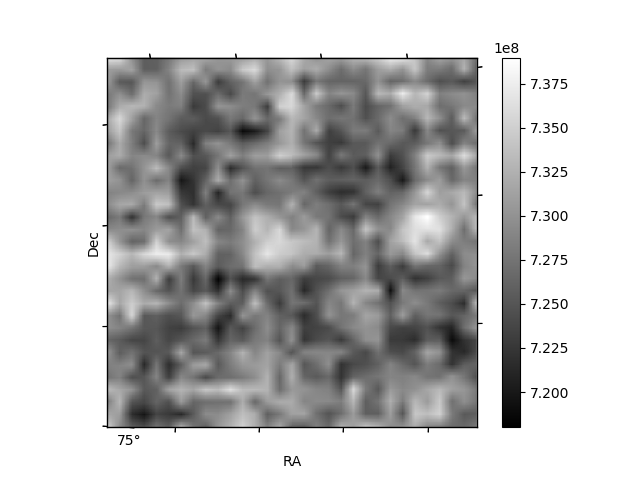
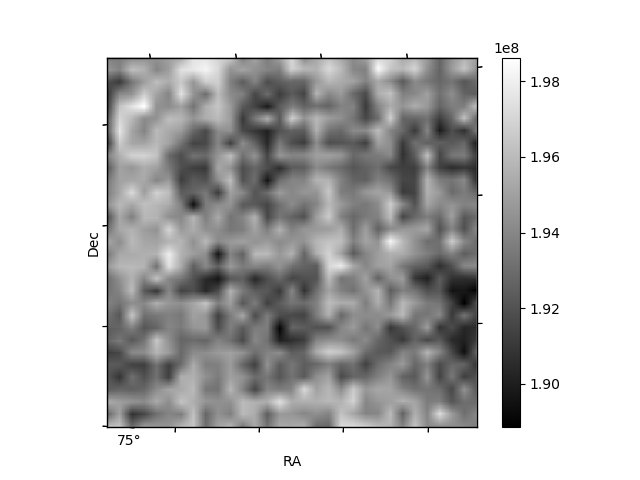
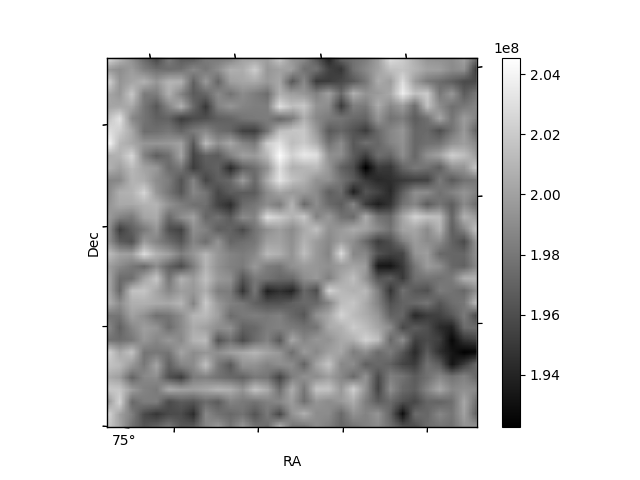
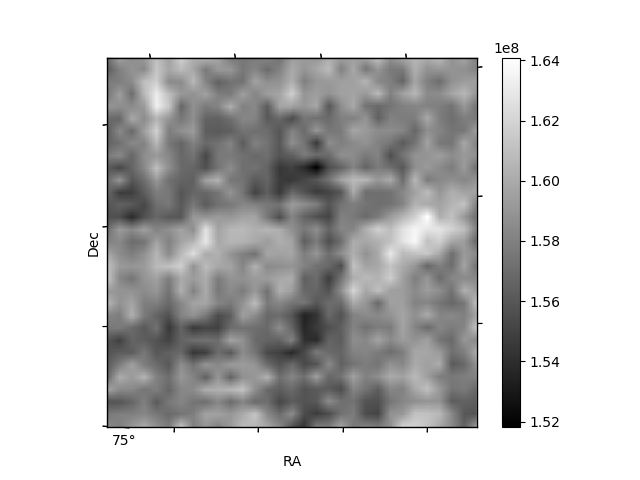
Histogram calculated using DETX and DETY for each event in the final _common_clean file
| Quadrant A | 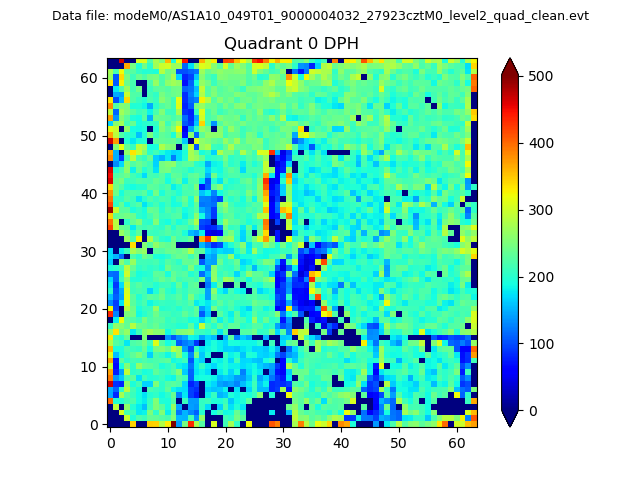 |
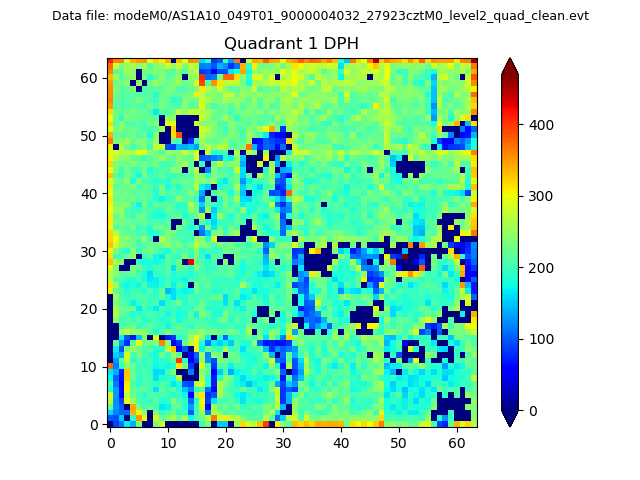 |
Quadrant B |
|---|---|---|---|
| Quadrant D | 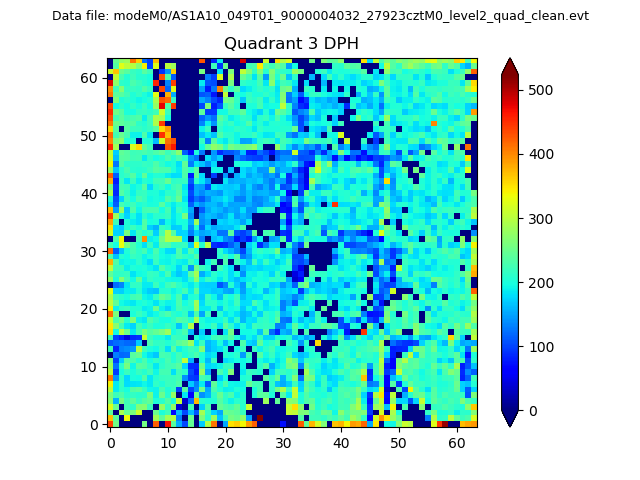 |
 |
Quadrant C |
| Plot type | Count rate plots | Images |
|---|---|---|
| Comparison with Poisson distribution Blue bars denote a histogram of data divided into 1 sec bins. Red curve is a Poisson curve with rate = median count rate of data. |
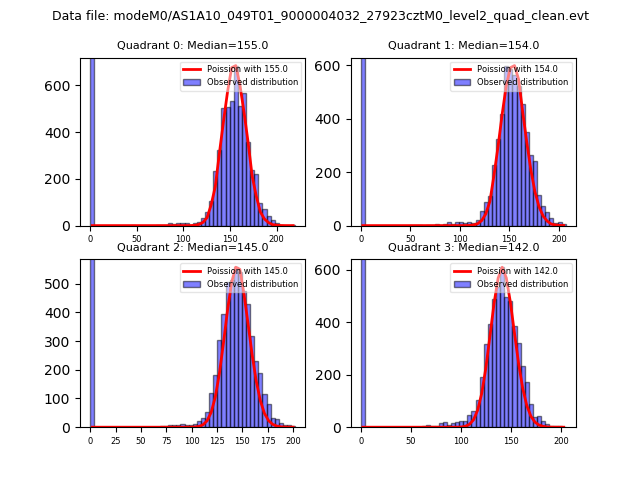 |
 |
| Quadrant-wise count rates Data is divided into 100 sec bins |
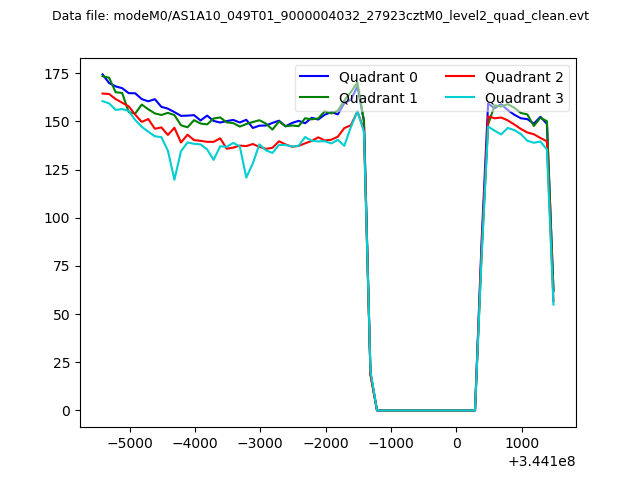 |
|
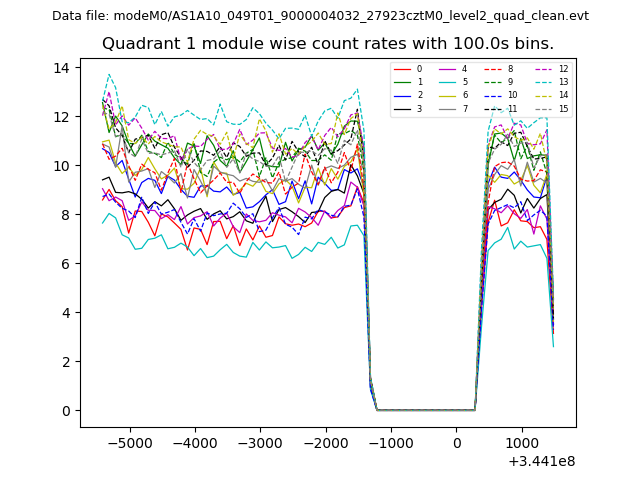
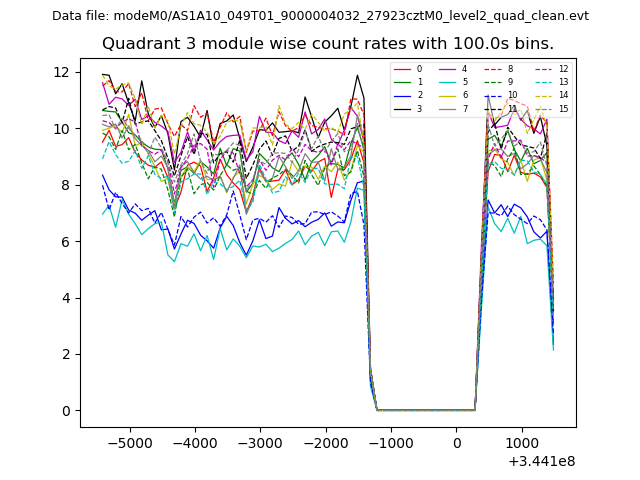
| Module-wise count rates for Quadrant A Data is divided into 100 sec bins |
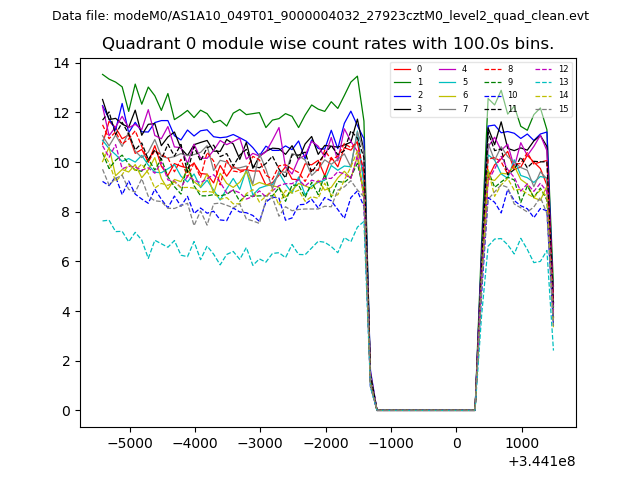 |
 |
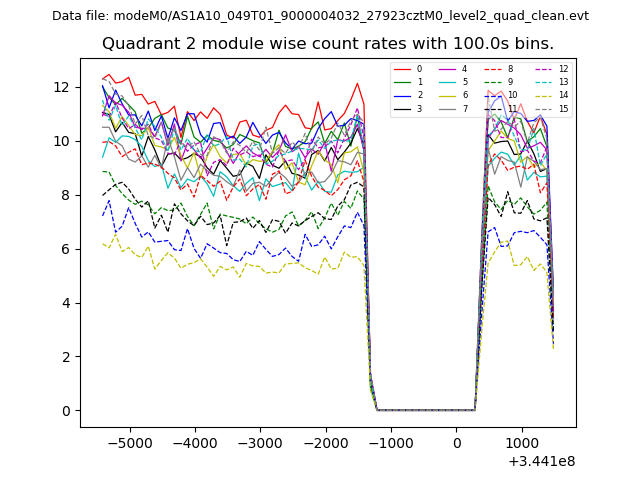
| Module-wise count rates for Quadrant B Data is divided into 100 sec bins |
 |
 |
| Module-wise count rates for Quadrant C Data is divided into 100 sec bins |
 |
 |
| Module-wise count rates for Quadrant D Data is divided into 100 sec bins |
 |
 |
| Parameter | Plot |
|---|---|
| CZT HV Monitor | 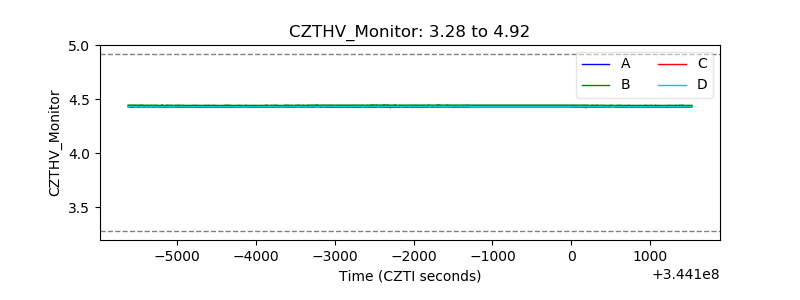 |
| D_VDD | 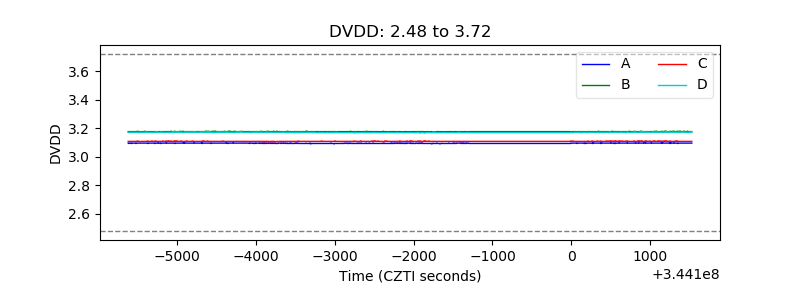 |
| Temperature 1 | 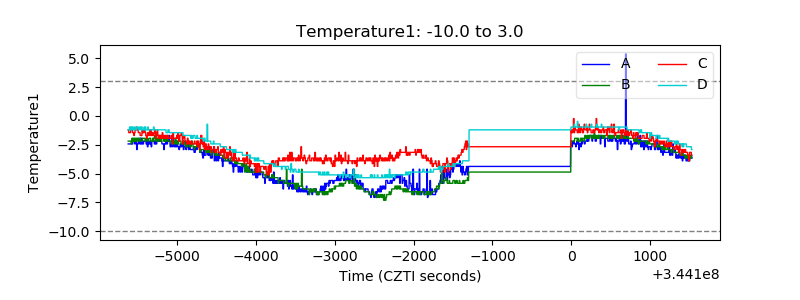 |
| Veto HV Monitor | 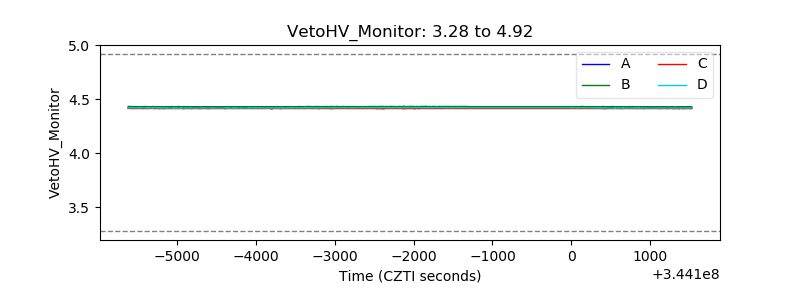 |
| Veto LLD | 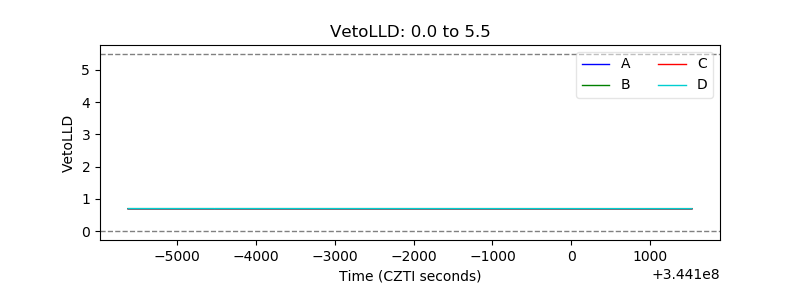 |
| Alpha Counter | 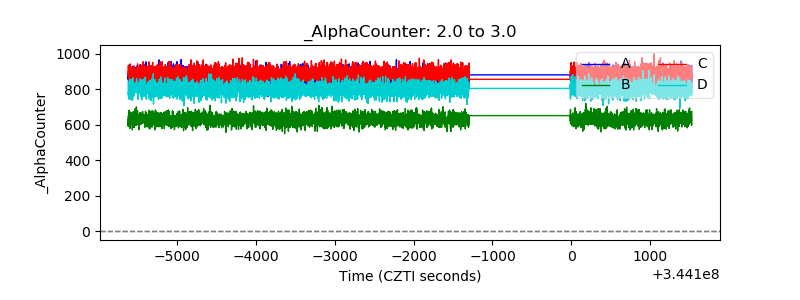 |
| _CPM_Rate | 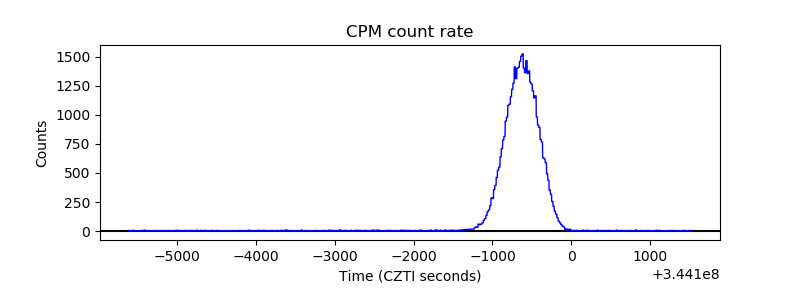 |
| CZT Counter | 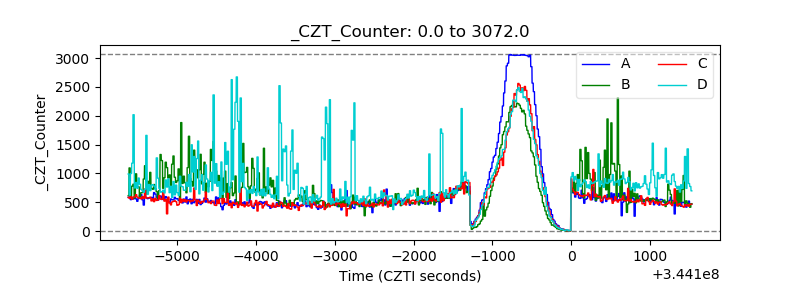 |
| +2.5 Volts monitor | 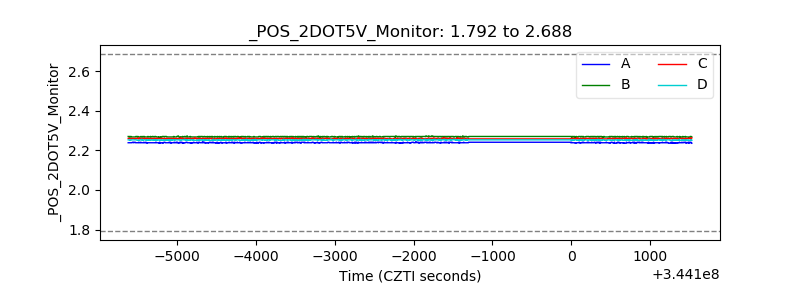 |
| +5 Volts monitor |  |
| _ROLL_ROT | 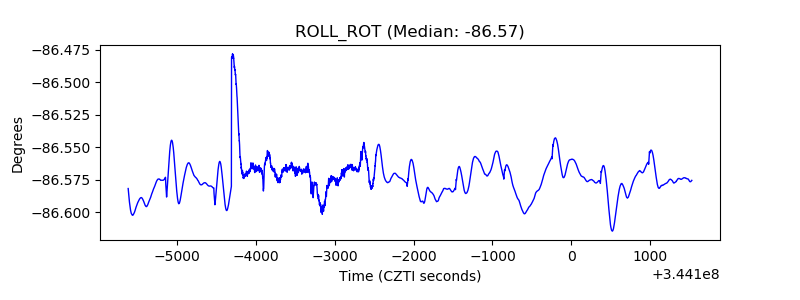 |
| _Roll_DEC | 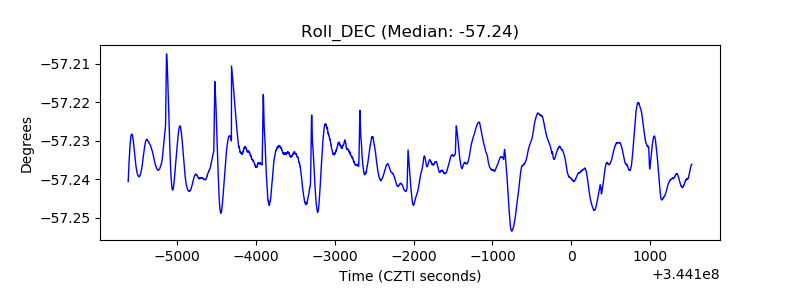 |
| _Roll_RA | 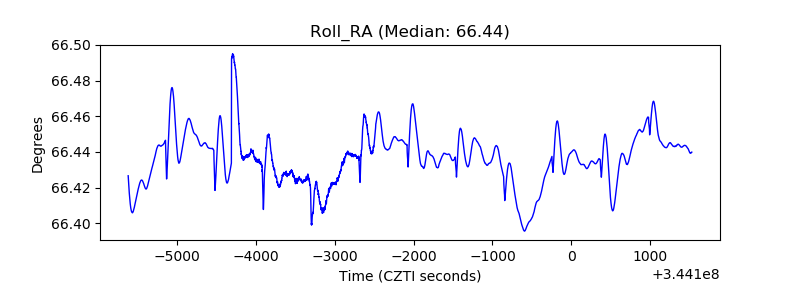 |
| Veto Counter | 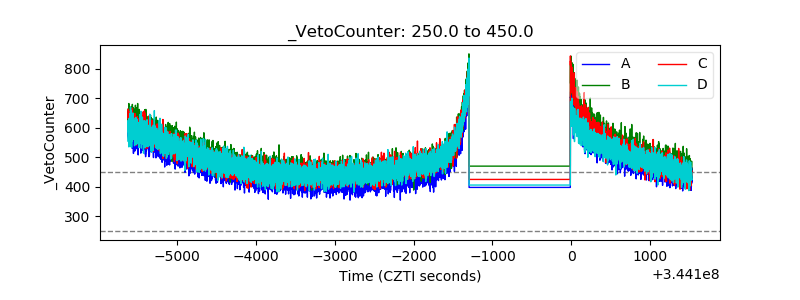 |