| Param | Original file | Final file |
|---|---|---|
| Filename | modeM0/AS1A10_049T01_9000004032_27924cztM0_level2.evt | modeM0/AS1A10_049T01_9000004032_27924cztM0_level2_quad_clean.evt |
| Size (bytes) | 501,410,880 | 119,545,920 |
| Size | 478.2 MB | 114.0 MB |
| Events in quadrant A | 3,131,347 | 824,197 |
| Events in quadrant B | 3,662,288 | 825,175 |
| Events in quadrant C | 3,119,834 | 775,245 |
| Events in quadrant D | 4,842,246 | 754,305 |
| Mode M9 | |||
|---|---|---|---|
| Quadrant | BADHDUFLAG | Total packets | Discarded packets |
| A | 0 | 10 | 0 |
| B | 0 | 10 | 0 |
| C | 0 | 10 | 0 |
| D | 0 | 10 | 0 |
| Mode M0 | |||
|---|---|---|---|
| Quadrant | BADHDUFLAG | Total packets | Discarded packets |
| A | 0 | 13181 | 0 |
| B | 0 | 14970 | 0 |
| C | 0 | 13217 | 0 |
| D | 0 | 19212 | 0 |
| Quadrant | Total seconds | Saturated seconds | Saturation percentage |
|---|---|---|---|
| A | 6333 | 95 | 1.500079% |
| B | 6333 | 173 | 2.731723% |
| C | 6334 | 110 | 1.736659% |
| D | 6333 | 144 | 2.273804% |
Noise dominated data is calculated using 1-second bins in cleaned event files. If a bin has >2000 counts, and if more than 50% of those come from <1% of pixels, then it is considered to be noise-dominated and hence unusable.
| Quadrant | # 1 sec bins | Bins with >0 counts | Bins with >2000 counts | High rate bins dominated by noise | Noise dominated (total time) | Noise dominated (detector-on time) | Marked lightcurve |
|---|---|---|---|---|---|---|---|
| A | 7353 | 6333 | 1 | 1 | 0.01% | 0.02% |  |
| B | 7353 | 6333 | 30 | 30 | 0.41% | 0.47% |  |
| C | 7354 | 6334 | 0 | 0 | 0.00% | 0.00% | 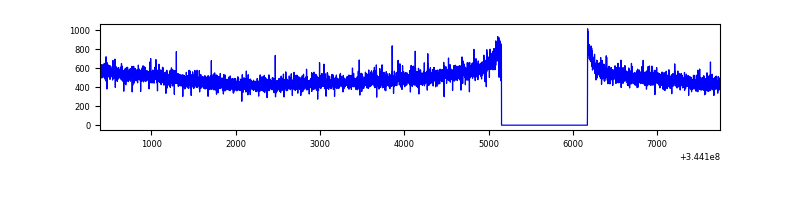 |
| D | 7353 | 6333 | 72 | 72 | 0.98% | 1.14% | 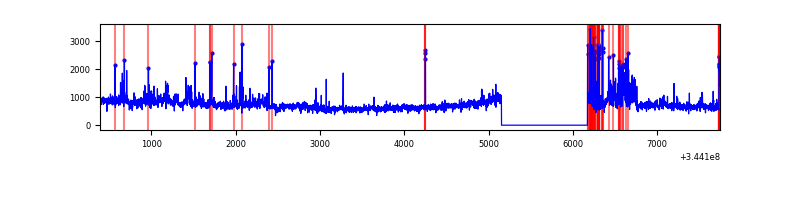 |
Top three noisy pixels from each quadrant. If the there are fewer than three noisy pixels in the level2.evt file, extra rows are filled as -1
| Pixel properties | Quadrant properties | ||||||
|---|---|---|---|---|---|---|---|
| Quadrant | DetID | PixID | Counts | Sigma | Mean | Median | Sigma |
| A | 13 | 254 | 11408 | 65.59 | 808 | 792 | 161.9 |
| A | 15 | 174 | 7890 | 43.85 | 808 | 792 | 161.9 |
| A | 3 | 137 | 7472 | 41.27 | 808 | 792 | 161.9 |
| B | 10 | 245 | 282278 | 1885.62 | 799 | 779 | 149.3 |
| B | 0 | 230 | 144630 | 963.59 | 799 | 779 | 149.3 |
| B | 15 | 32 | 106772 | 710.0 | 799 | 779 | 149.3 |
| C | 14 | 238 | 125361 | 712.13 | 758 | 764 | 175.0 |
| C | 3 | 233 | 35952 | 201.11 | 758 | 764 | 175.0 |
| C | 13 | 61 | 5376 | 26.36 | 758 | 764 | 175.0 |
| D | 8 | 195 | 1292713 | 7163.77 | 759 | 737 | 180.3 |
| D | 1 | 52 | 287177 | 1588.26 | 759 | 737 | 180.3 |
| D | 2 | 250 | 132860 | 732.6 | 759 | 737 | 180.3 |
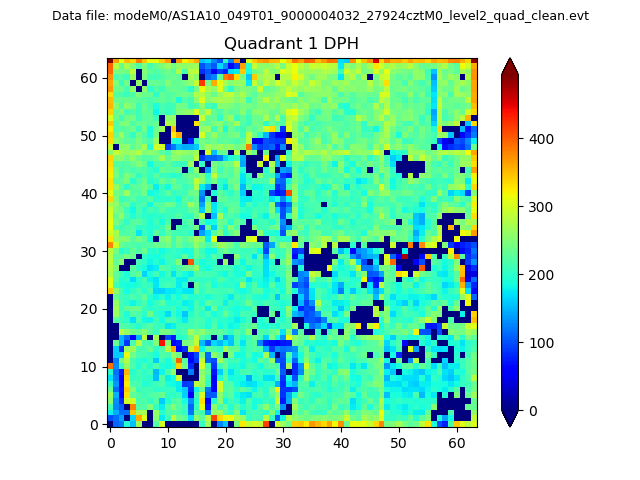
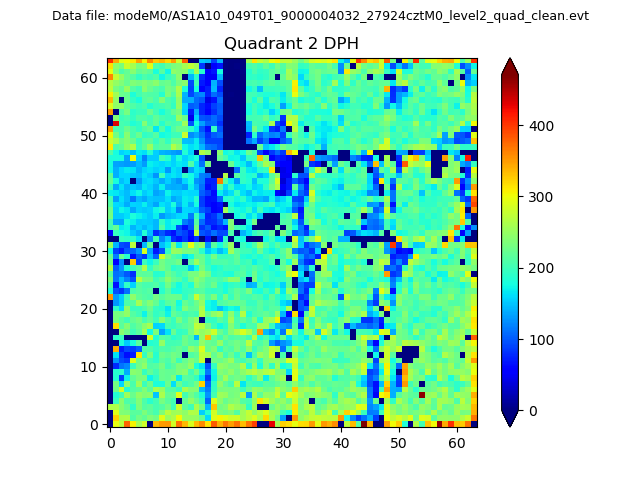
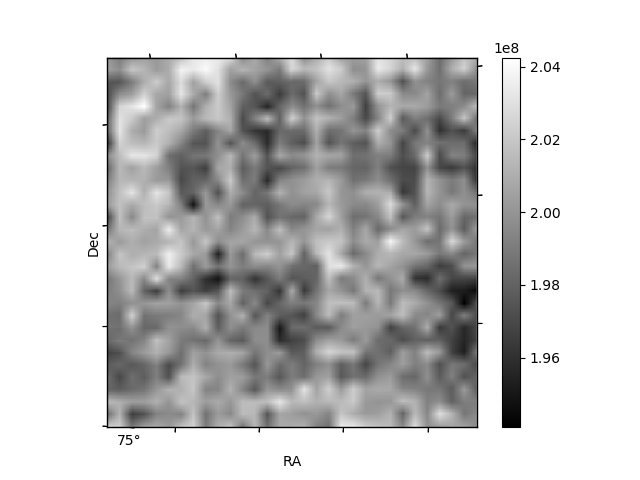
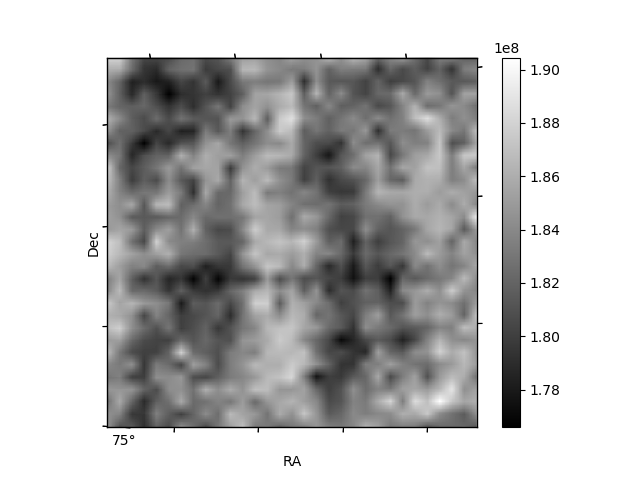
Histogram calculated using DETX and DETY for each event in the final _common_clean file
| Quadrant A | 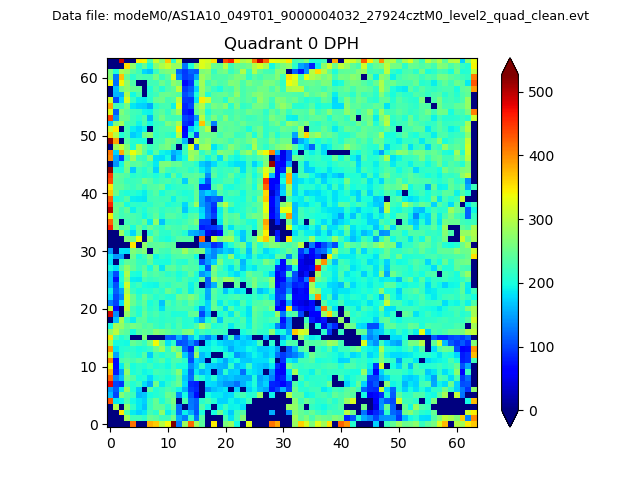 |
 |
Quadrant B |
|---|---|---|---|
| Quadrant D | 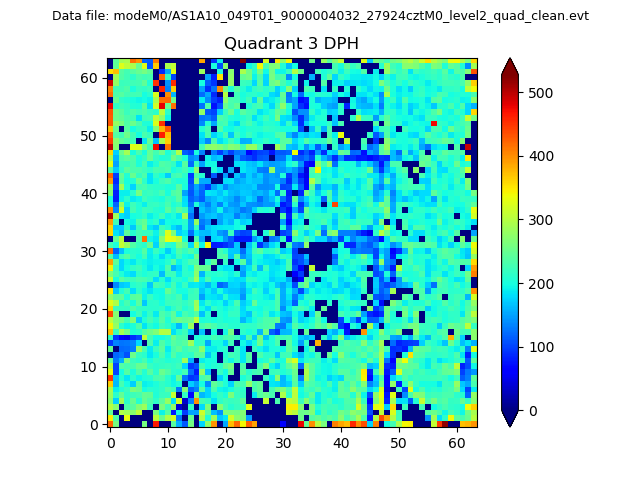 |
 |
Quadrant C |
| Plot type | Count rate plots | Images |
|---|---|---|
| Comparison with Poisson distribution Blue bars denote a histogram of data divided into 1 sec bins. Red curve is a Poisson curve with rate = median count rate of data. |
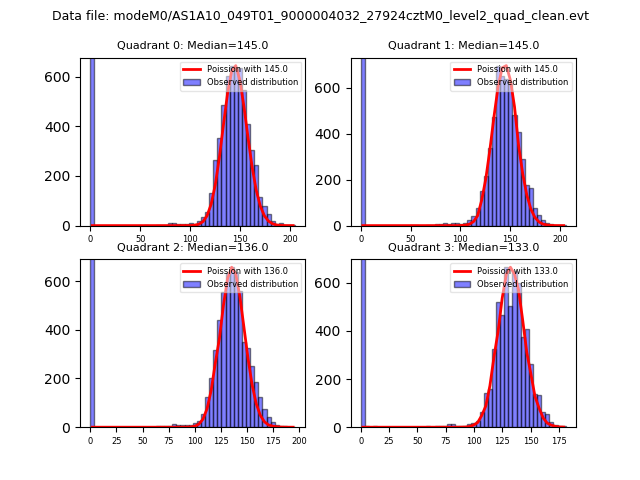 |
 |
| Quadrant-wise count rates Data is divided into 100 sec bins |
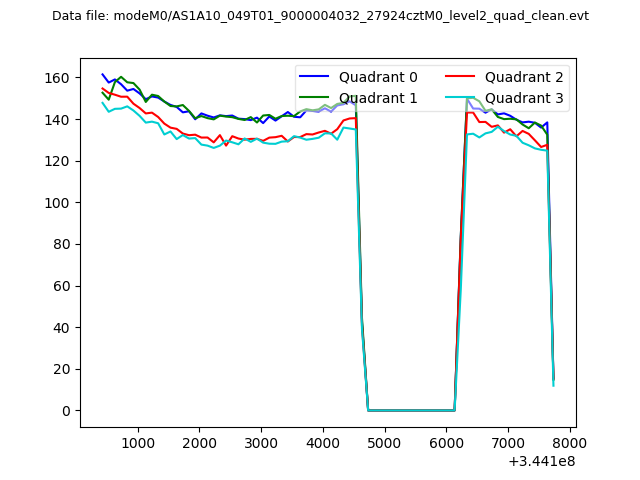 |
|
| Module-wise count rates for Quadrant A Data is divided into 100 sec bins |
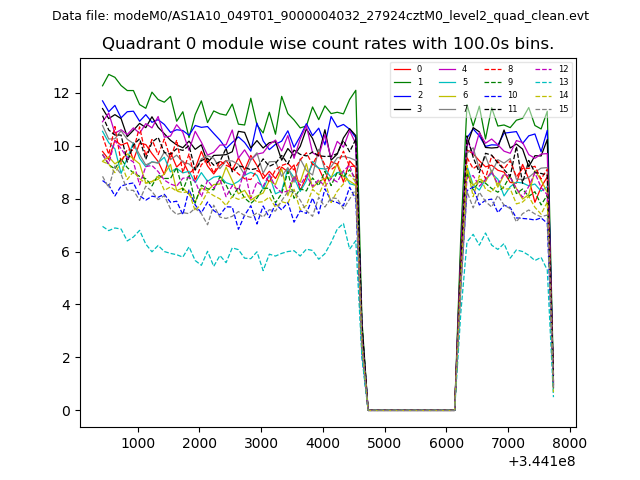 |
 |
| Module-wise count rates for Quadrant B Data is divided into 100 sec bins |
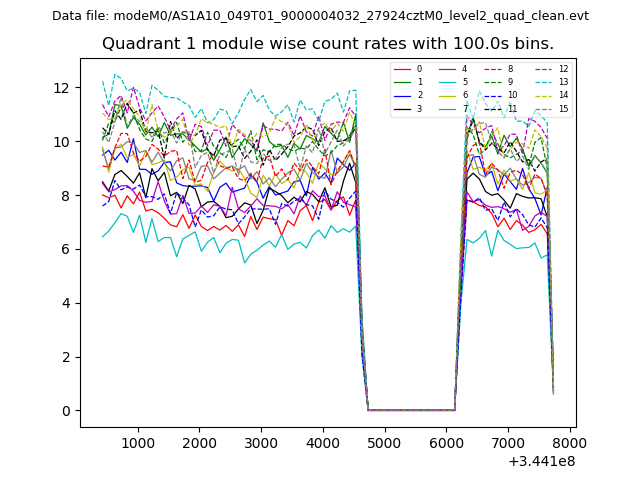 |
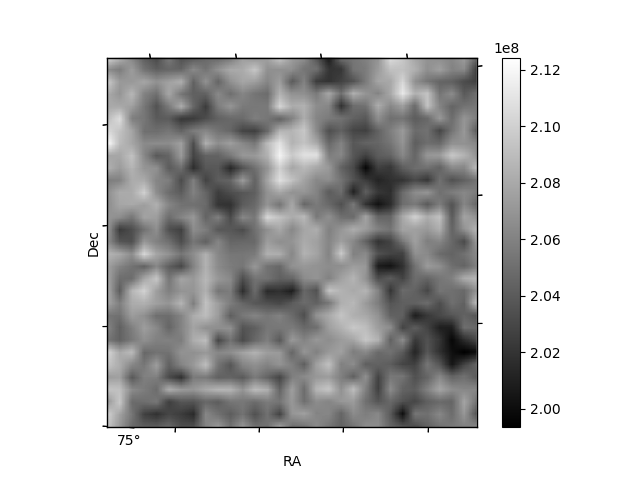 |
| Module-wise count rates for Quadrant C Data is divided into 100 sec bins |
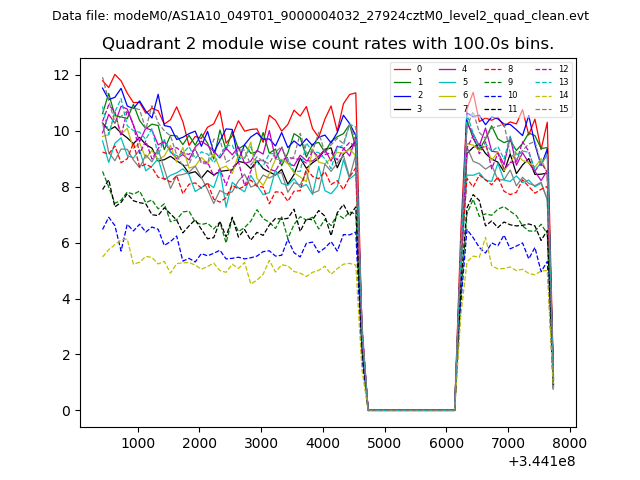 |
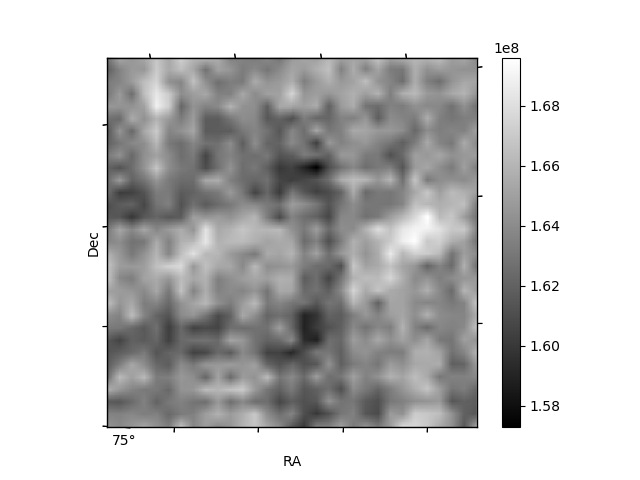 |
| Module-wise count rates for Quadrant D Data is divided into 100 sec bins |
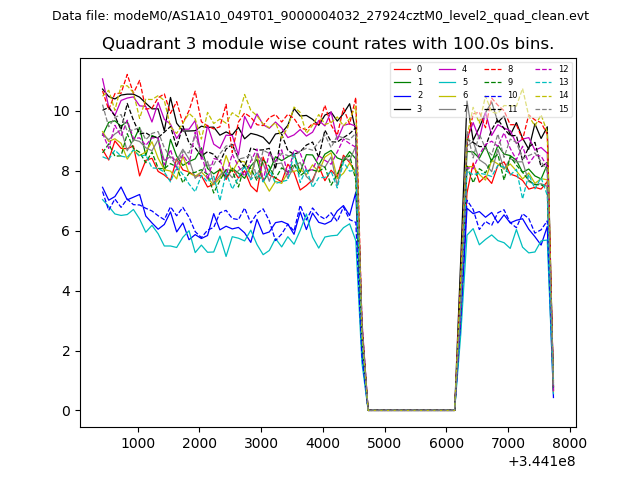 |
 |
| Parameter | Plot |
|---|---|
| CZT HV Monitor | 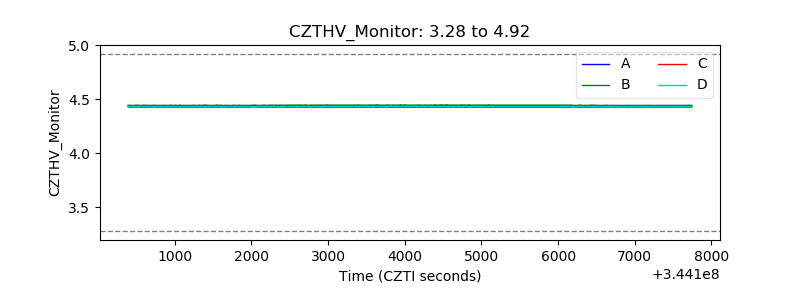 |
| D_VDD | 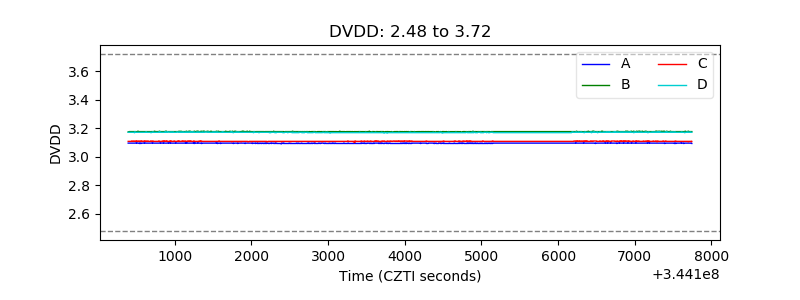 |
| Temperature 1 | 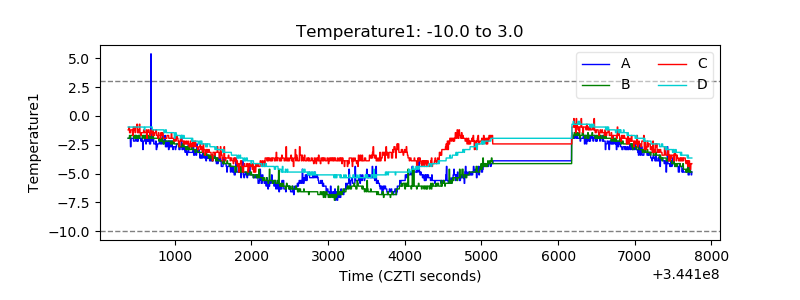 |
| Veto HV Monitor | 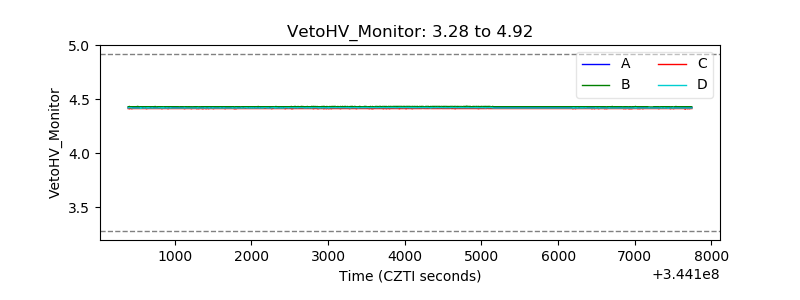 |
| Veto LLD | 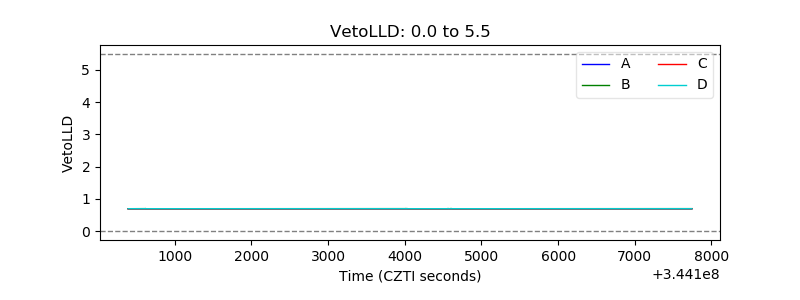 |
| Alpha Counter | 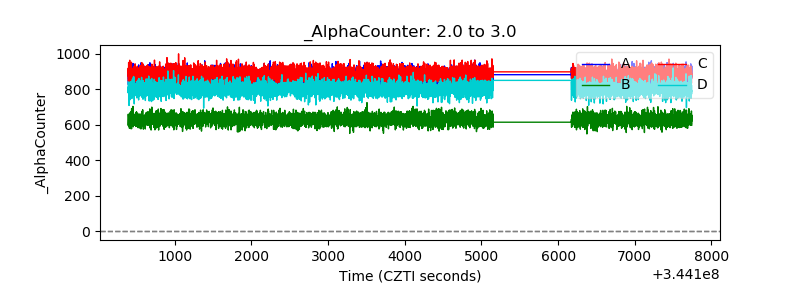 |
| _CPM_Rate | 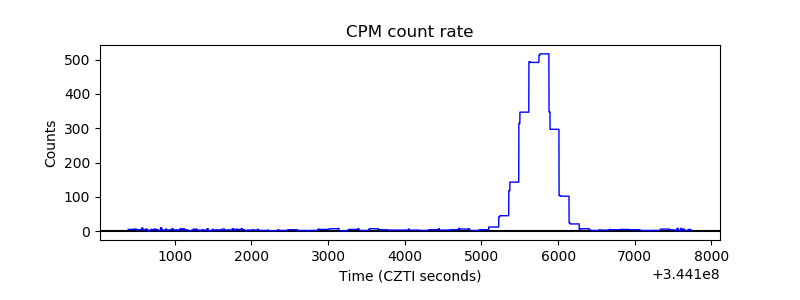 |
| CZT Counter | 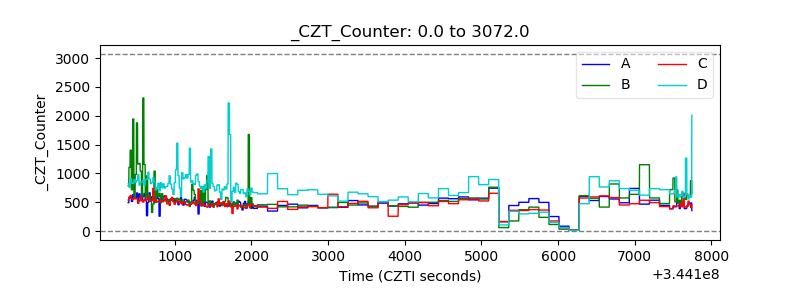 |
| +2.5 Volts monitor | 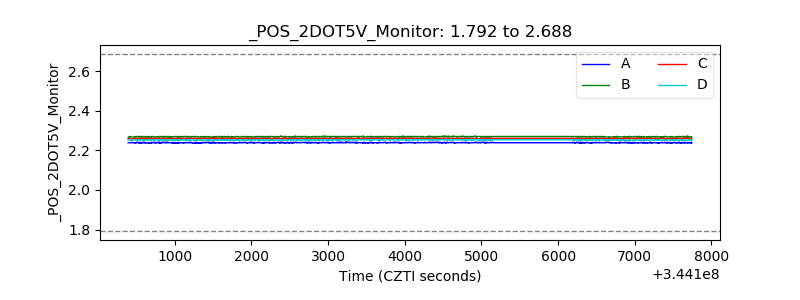 |
| +5 Volts monitor |  |
| _ROLL_ROT | 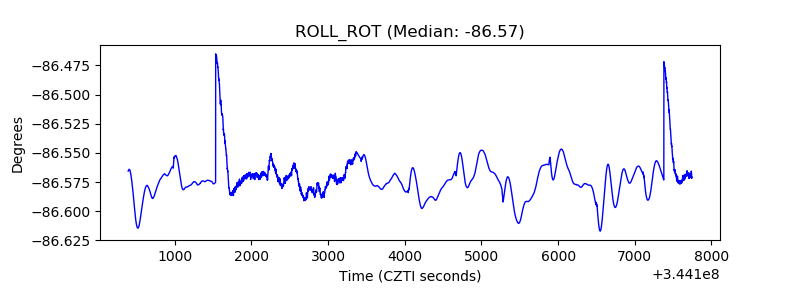 |
| _Roll_DEC | 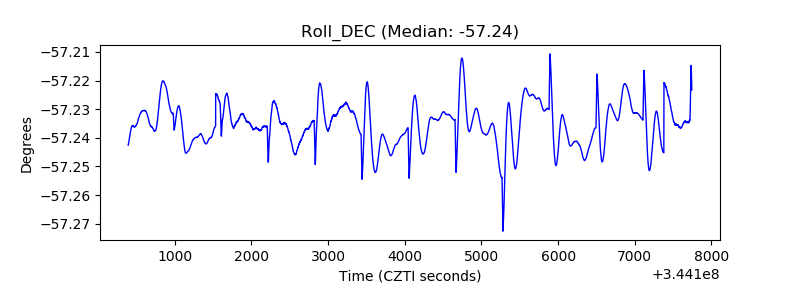 |
| _Roll_RA | 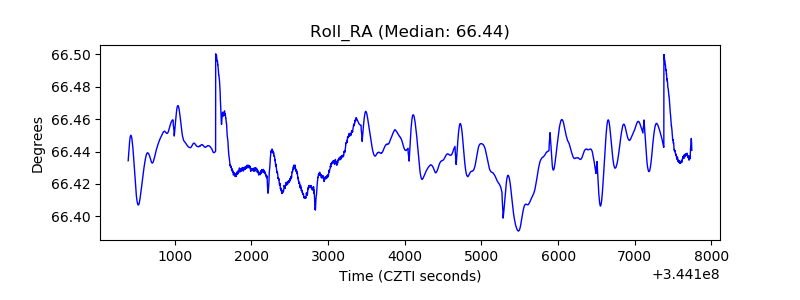 |
| Veto Counter | 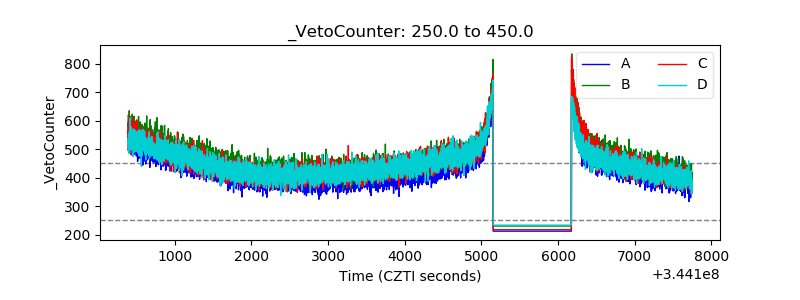 |