| Param | Original file | Final file |
|---|---|---|
| Filename | modeM0/AS1A10_049T01_9000004032_27925cztM0_level2.evt | modeM0/AS1A10_049T01_9000004032_27925cztM0_level2_quad_clean.evt |
| Size (bytes) | 531,328,320 | 112,561,920 |
| Size | 506.7 MB | 107.3 MB |
| Events in quadrant A | 3,375,818 | 759,616 |
| Events in quadrant B | 3,662,581 | 761,451 |
| Events in quadrant C | 3,253,968 | 716,159 |
| Events in quadrant D | 5,337,444 | 697,702 |
| Mode M9 | |||
|---|---|---|---|
| Quadrant | BADHDUFLAG | Total packets | Discarded packets |
| A | 0 | 7 | 0 |
| B | 0 | 7 | 0 |
| C | 0 | 7 | 0 |
| D | 0 | 7 | 0 |
| Mode M0 | |||
|---|---|---|---|
| Quadrant | BADHDUFLAG | Total packets | Discarded packets |
| A | 0 | 14327 | 0 |
| B | 0 | 15252 | 0 |
| C | 0 | 14026 | 0 |
| D | 0 | 20883 | 0 |
| Quadrant | Total seconds | Saturated seconds | Saturation percentage |
|---|---|---|---|
| A | 6807 | 72 | 1.057735% |
| B | 6808 | 79 | 1.160400% |
| C | 6808 | 83 | 1.219154% |
| D | 6808 | 128 | 1.880141% |
Noise dominated data is calculated using 1-second bins in cleaned event files. If a bin has >2000 counts, and if more than 50% of those come from <1% of pixels, then it is considered to be noise-dominated and hence unusable.
| Quadrant | # 1 sec bins | Bins with >0 counts | Bins with >2000 counts | High rate bins dominated by noise | Noise dominated (total time) | Noise dominated (detector-on time) | Marked lightcurve |
|---|---|---|---|---|---|---|---|
| A | 7472 | 6807 | 5 | 5 | 0.07% | 0.07% | 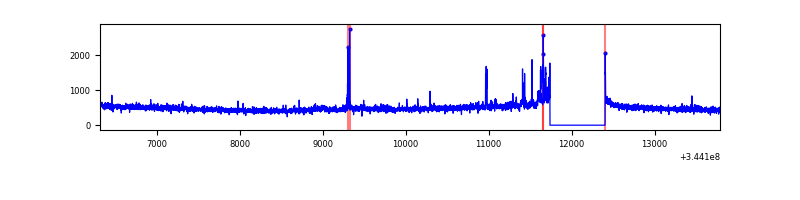 |
| B | 7473 | 6809 | 3 | 3 | 0.04% | 0.04% | 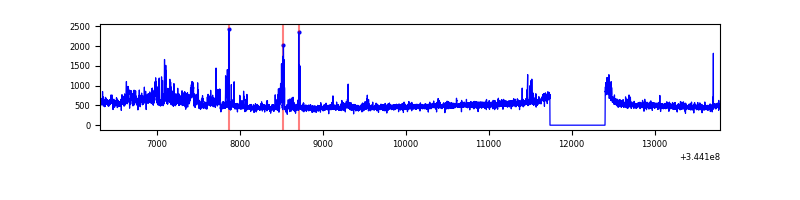 |
| C | 7473 | 6808 | 1 | 1 | 0.01% | 0.01% | 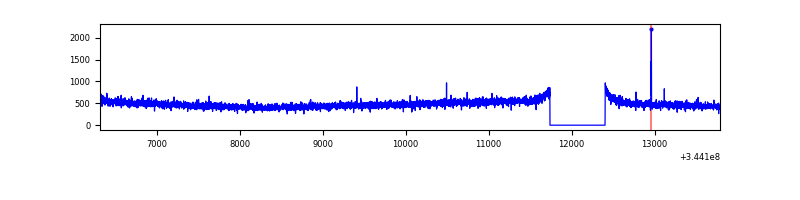 |
| D | 7473 | 6808 | 79 | 79 | 1.06% | 1.16% | 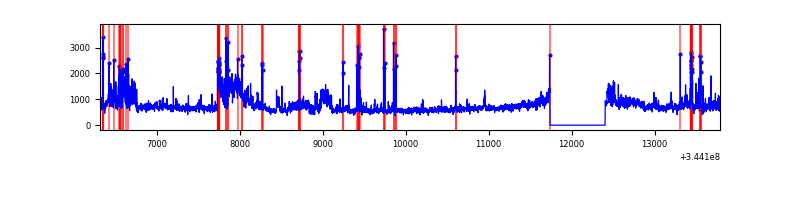 |
Top three noisy pixels from each quadrant. If the there are fewer than three noisy pixels in the level2.evt file, extra rows are filled as -1
| Pixel properties | Quadrant properties | ||||||
|---|---|---|---|---|---|---|---|
| Quadrant | DetID | PixID | Counts | Sigma | Mean | Median | Sigma |
| A | 15 | 174 | 121077 | 716.33 | 837 | 820 | 167.9 |
| A | 4 | 2 | 19497 | 111.25 | 837 | 820 | 167.9 |
| A | 13 | 254 | 12164 | 67.57 | 837 | 820 | 167.9 |
| B | 10 | 245 | 373403 | 2363.3 | 834 | 812 | 157.7 |
| B | 0 | 229 | 19593 | 119.13 | 834 | 812 | 157.7 |
| B | 12 | 111 | 19212 | 116.71 | 834 | 812 | 157.7 |
| C | 14 | 238 | 129487 | 697.45 | 794 | 798 | 184.5 |
| C | 3 | 233 | 20109 | 104.66 | 794 | 798 | 184.5 |
| C | 2 | 16 | 9251 | 45.81 | 794 | 798 | 184.5 |
| D | 8 | 195 | 1034102 | 5497.97 | 797 | 777 | 187.9 |
| D | 12 | 33 | 661383 | 3514.86 | 797 | 777 | 187.9 |
| D | 1 | 52 | 278091 | 1475.49 | 797 | 777 | 187.9 |
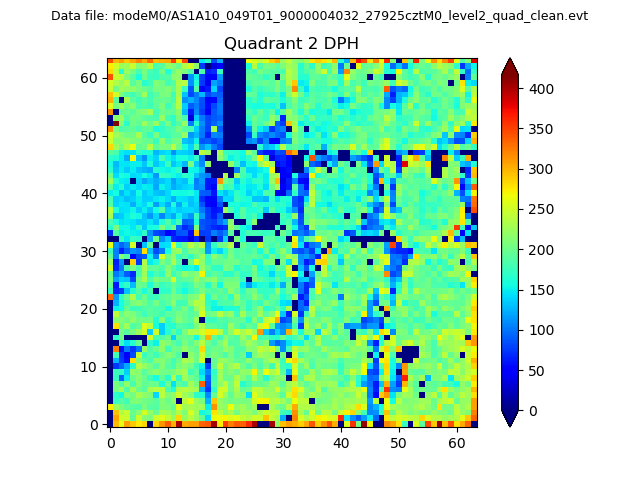
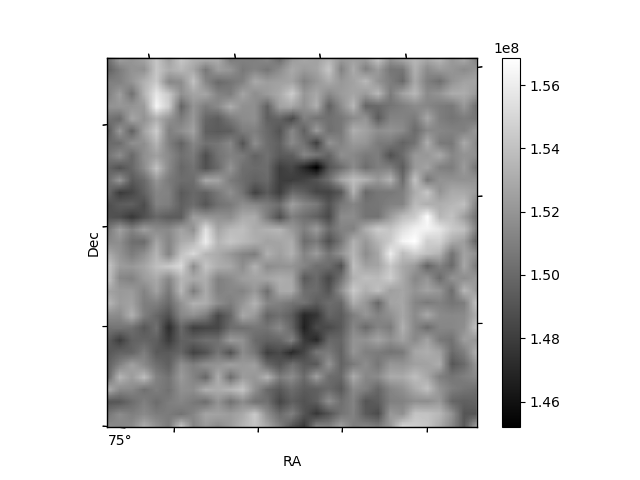
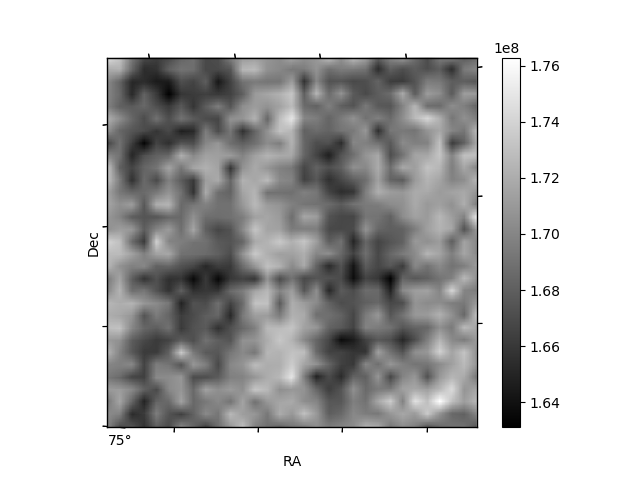
Histogram calculated using DETX and DETY for each event in the final _common_clean file
| Quadrant A | 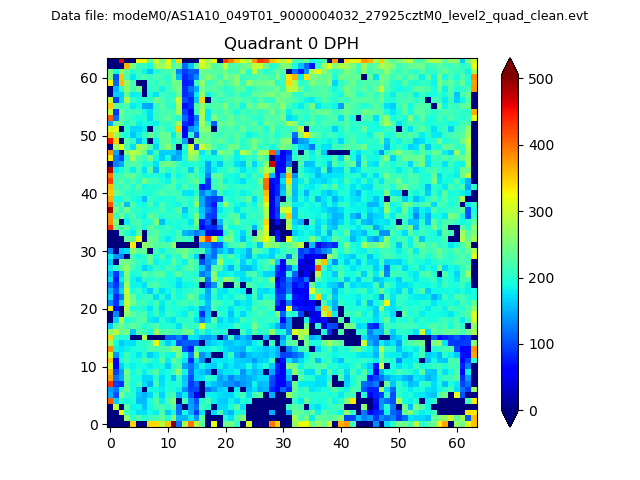 |
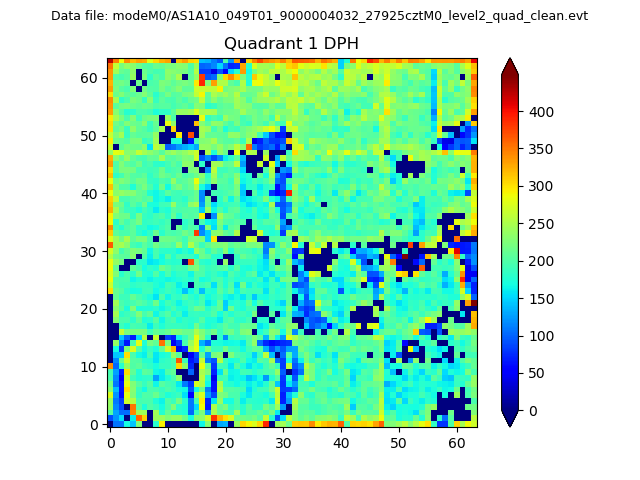 |
Quadrant B |
|---|---|---|---|
| Quadrant D | 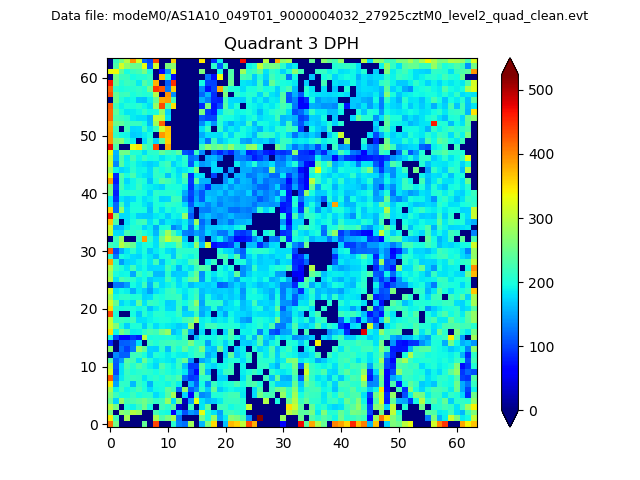 |
 |
Quadrant C |
| Plot type | Count rate plots | Images |
|---|---|---|
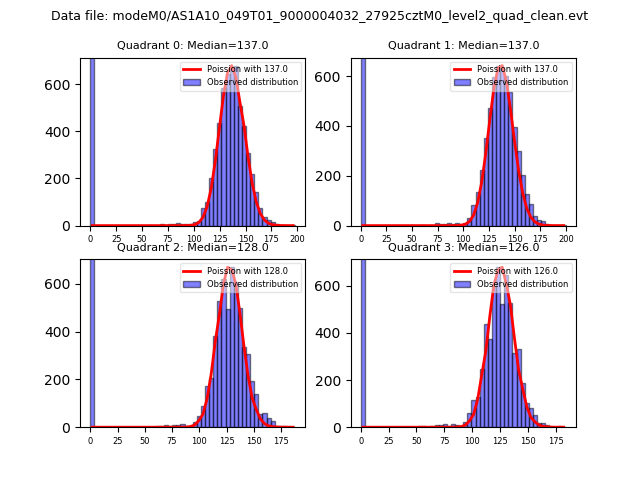
| Comparison with Poisson distribution Blue bars denote a histogram of data divided into 1 sec bins. Red curve is a Poisson curve with rate = median count rate of data. |
 |
 |
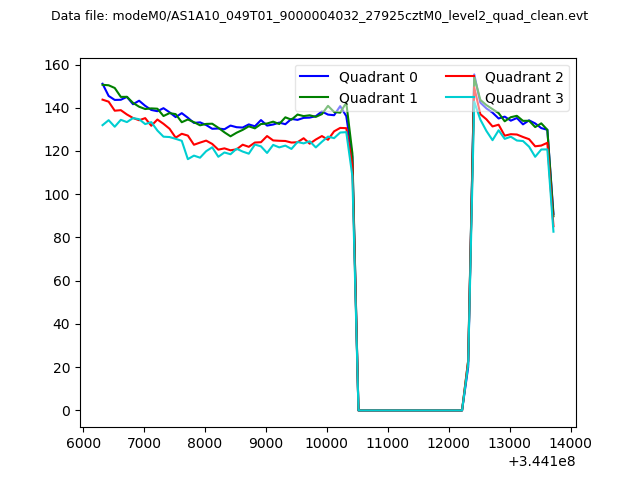
| Quadrant-wise count rates Data is divided into 100 sec bins |
 |
|
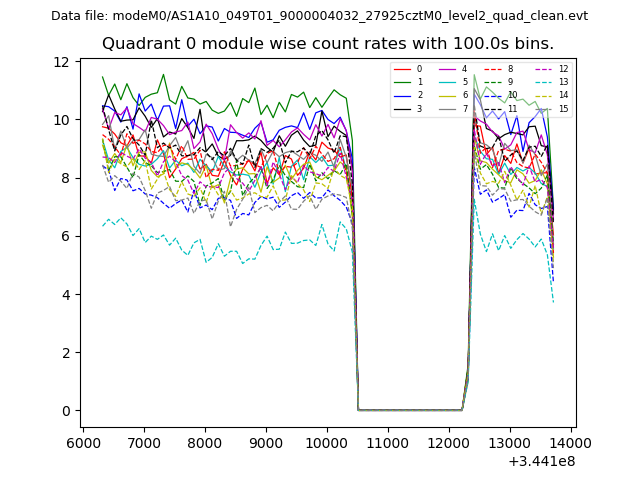
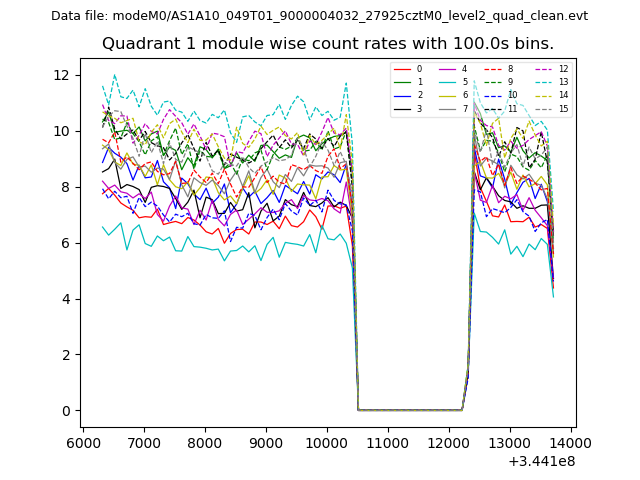
| Module-wise count rates for Quadrant A Data is divided into 100 sec bins |
 |
 |
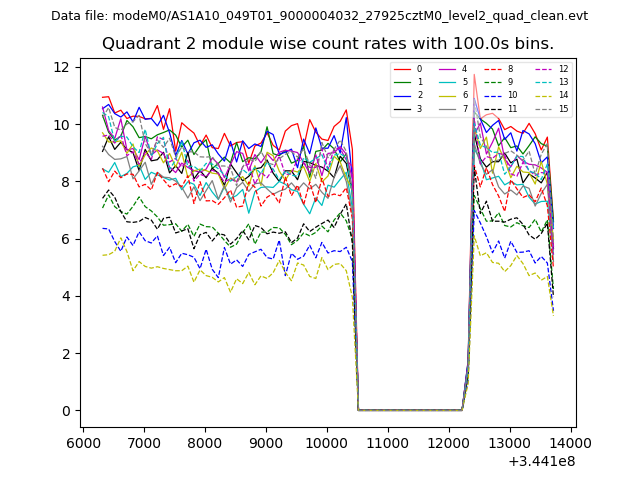
| Module-wise count rates for Quadrant B Data is divided into 100 sec bins |
 |
 |
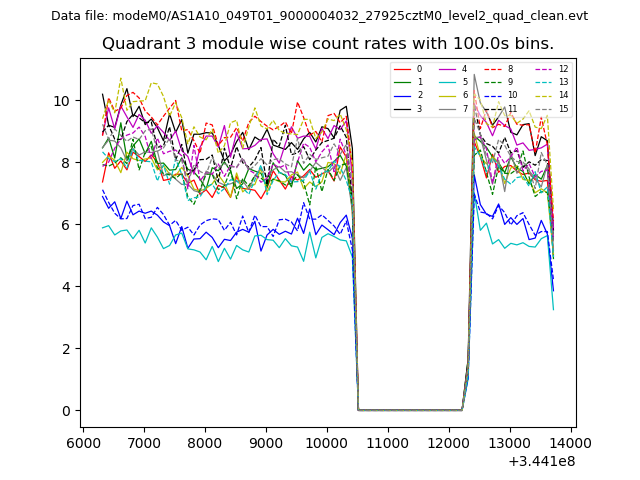
| Module-wise count rates for Quadrant C Data is divided into 100 sec bins |
 |
 |
| Module-wise count rates for Quadrant D Data is divided into 100 sec bins |
 |
 |
| Parameter | Plot |
|---|---|
| CZT HV Monitor | 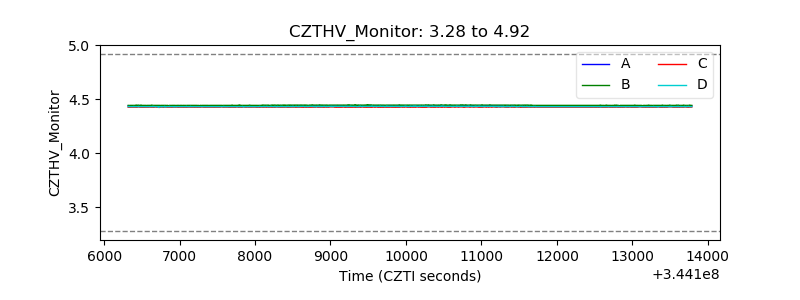 |
| D_VDD | 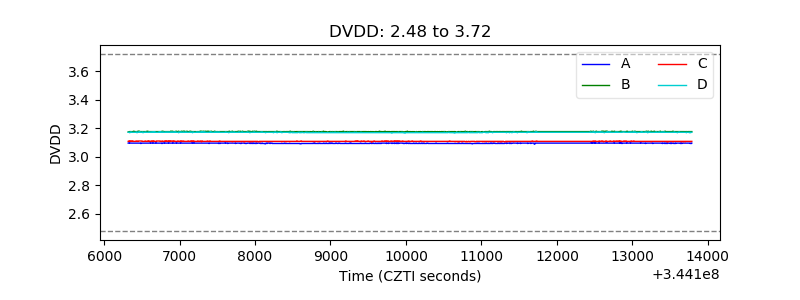 |
| Temperature 1 | 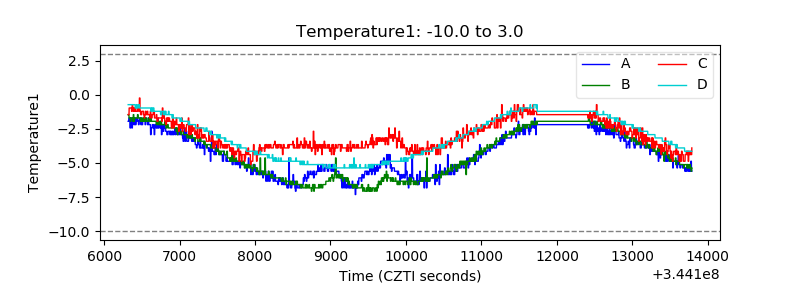 |
| Veto HV Monitor | 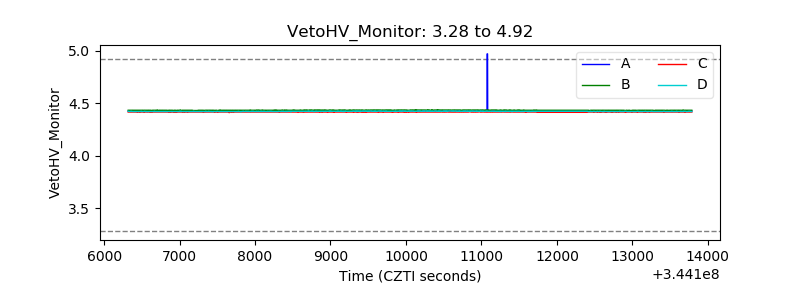 |
| Veto LLD | 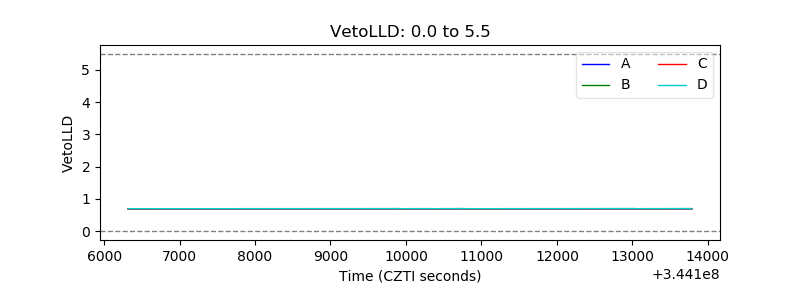 |
| Alpha Counter | 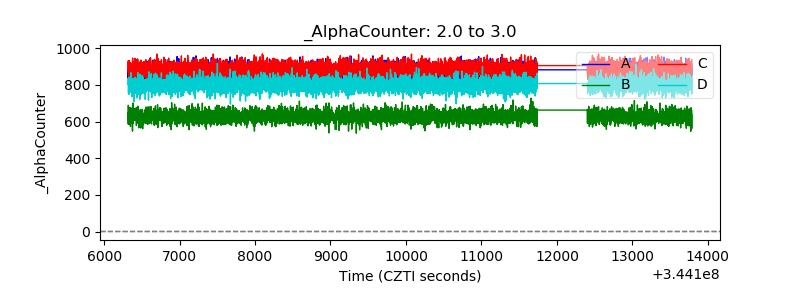 |
| _CPM_Rate | 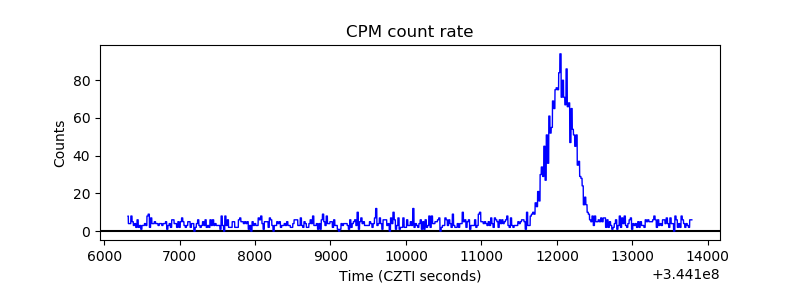 |
| CZT Counter | 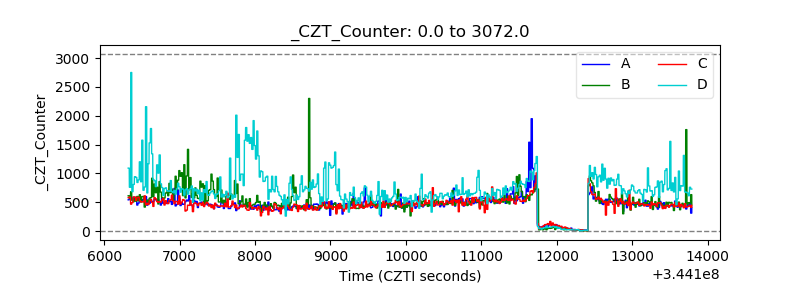 |
| +2.5 Volts monitor |  |
| +5 Volts monitor |  |
| _ROLL_ROT | 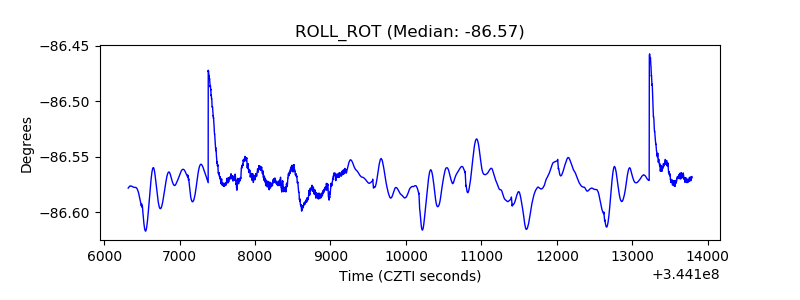 |
| _Roll_DEC | 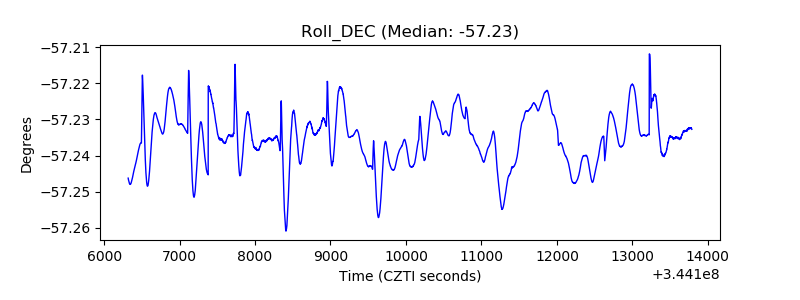 |
| _Roll_RA | 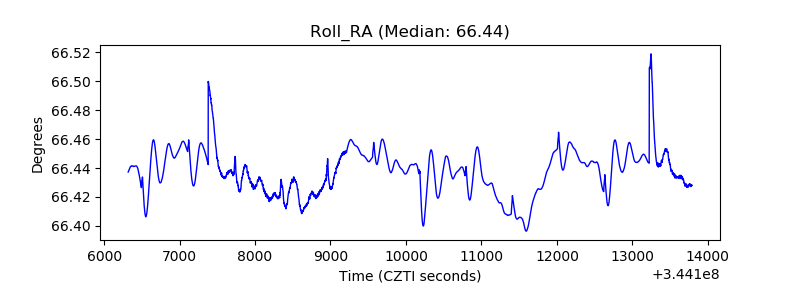 |
| Veto Counter | 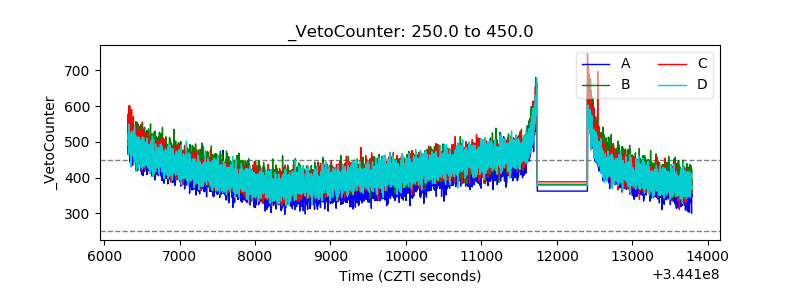 |