| Param | Original file | Final file |
|---|---|---|
| Filename | modeM0/AS1A10_049T01_9000004032_27926cztM0_level2.evt | modeM0/AS1A10_049T01_9000004032_27926cztM0_level2_quad_clean.evt |
| Size (bytes) | 658,563,840 | 120,841,920 |
| Size | 628.1 MB | 115.2 MB |
| Events in quadrant A | 4,244,054 | 809,463 |
| Events in quadrant B | 4,374,804 | 809,875 |
| Events in quadrant C | 3,714,514 | 767,601 |
| Events in quadrant D | 7,085,931 | 732,850 |
| Mode M9 | |||
|---|---|---|---|
| Quadrant | BADHDUFLAG | Total packets | Discarded packets |
| A | 0 | 5 | 0 |
| B | 0 | 6 | 0 |
| C | 0 | 6 | 0 |
| D | 0 | 6 | 0 |
| Mode M0 | |||
|---|---|---|---|
| Quadrant | BADHDUFLAG | Total packets | Discarded packets |
| A | 0 | 17735 | 0 |
| B | 0 | 18005 | 0 |
| C | 0 | 16134 | 0 |
| D | 0 | 26712 | 0 |
| Quadrant | Total seconds | Saturated seconds | Saturation percentage |
|---|---|---|---|
| A | 7769 | 115 | 1.480242% |
| B | 7769 | 172 | 2.213927% |
| C | 7769 | 109 | 1.403012% |
| D | 7768 | 523 | 6.732750% |
Noise dominated data is calculated using 1-second bins in cleaned event files. If a bin has >2000 counts, and if more than 50% of those come from <1% of pixels, then it is considered to be noise-dominated and hence unusable.
| Quadrant | # 1 sec bins | Bins with >0 counts | Bins with >2000 counts | High rate bins dominated by noise | Noise dominated (total time) | Noise dominated (detector-on time) | Marked lightcurve |
|---|---|---|---|---|---|---|---|
| A | 7969 | 7770 | 45 | 45 | 0.56% | 0.58% | 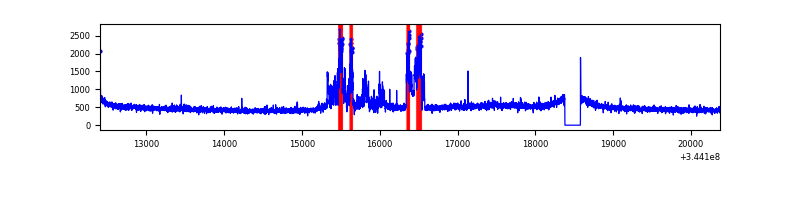 |
| B | 7969 | 7770 | 25 | 25 | 0.31% | 0.32% | 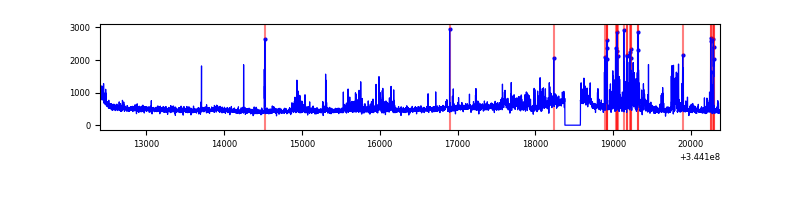 |
| C | 7969 | 7770 | 1 | 1 | 0.01% | 0.01% | 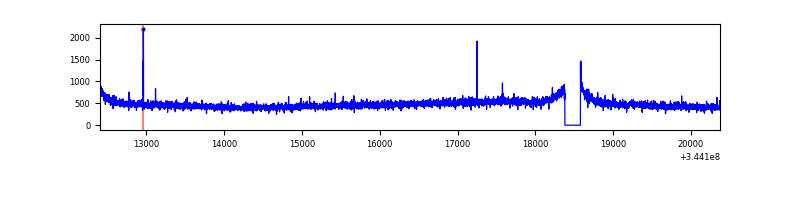 |
| D | 7968 | 7769 | 392 | 392 | 4.92% | 5.05% | 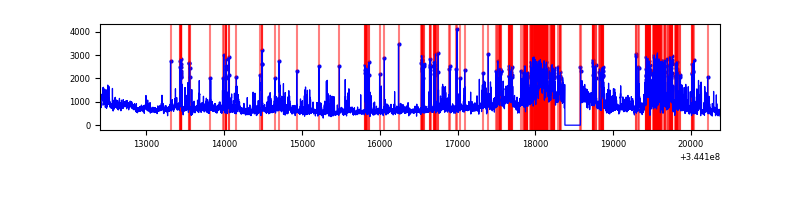 |
Top three noisy pixels from each quadrant. If the there are fewer than three noisy pixels in the level2.evt file, extra rows are filled as -1
| Pixel properties | Quadrant properties | ||||||
|---|---|---|---|---|---|---|---|
| Quadrant | DetID | PixID | Counts | Sigma | Mean | Median | Sigma |
| A | 15 | 174 | 583275 | 3075.2 | 945 | 925 | 189.4 |
| A | 13 | 254 | 13886 | 68.44 | 945 | 925 | 189.4 |
| A | 8 | 192 | 12025 | 58.62 | 945 | 925 | 189.4 |
| B | 10 | 245 | 468165 | 2620.27 | 940 | 917 | 178.3 |
| B | 0 | 230 | 123291 | 686.26 | 940 | 917 | 178.3 |
| B | 12 | 0 | 51825 | 285.49 | 940 | 917 | 178.3 |
| C | 14 | 238 | 144015 | 683.02 | 899 | 902 | 209.5 |
| C | 3 | 233 | 58384 | 274.34 | 899 | 902 | 209.5 |
| C | 2 | 16 | 12029 | 53.1 | 899 | 902 | 209.5 |
| D | 8 | 195 | 1515545 | 7107.03 | 888 | 862 | 213.1 |
| D | 1 | 52 | 1197990 | 5617.03 | 888 | 862 | 213.1 |
| D | 7 | 80 | 276358 | 1292.65 | 888 | 862 | 213.1 |
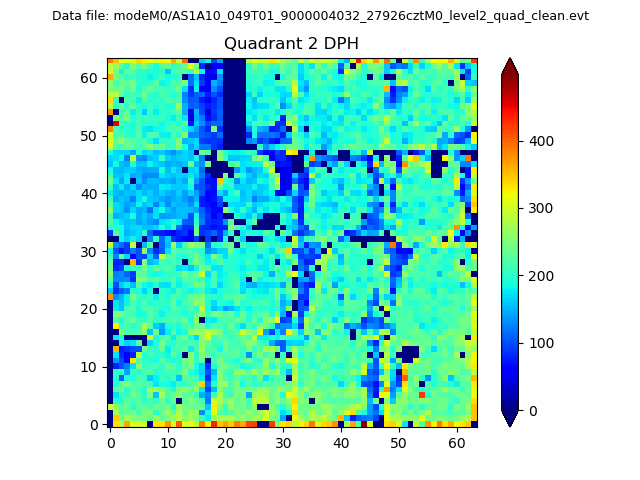
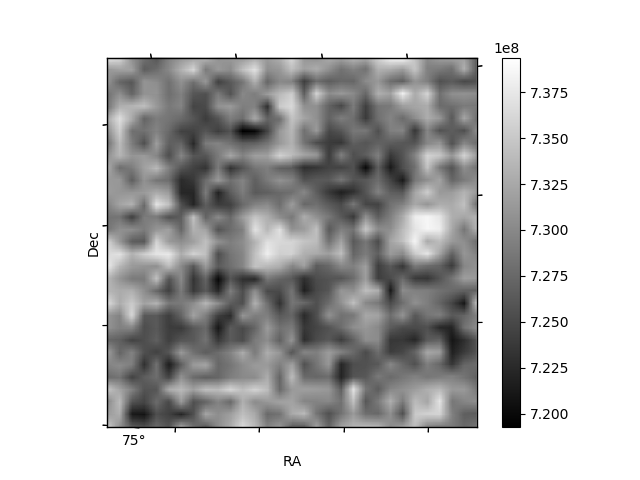
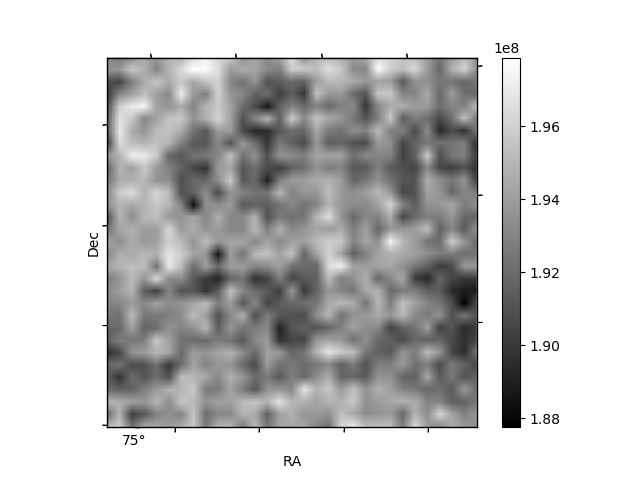
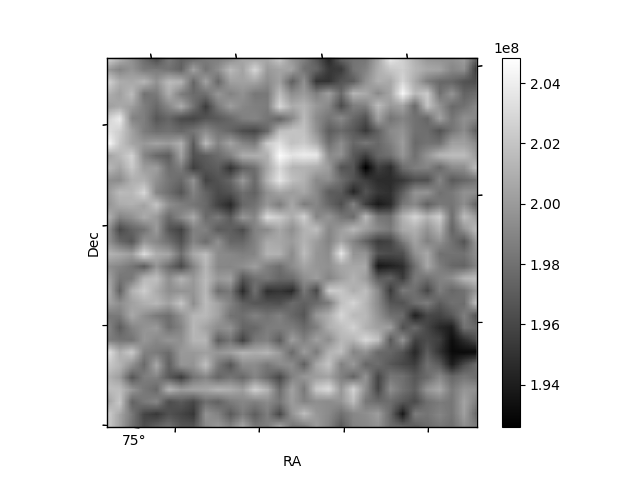
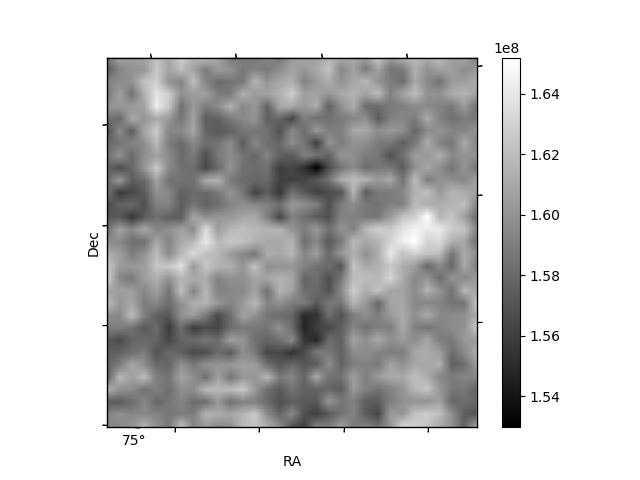
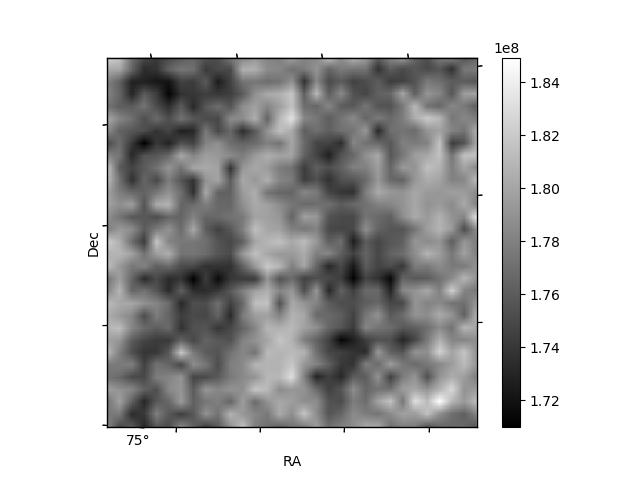
Histogram calculated using DETX and DETY for each event in the final _common_clean file
| Quadrant A | 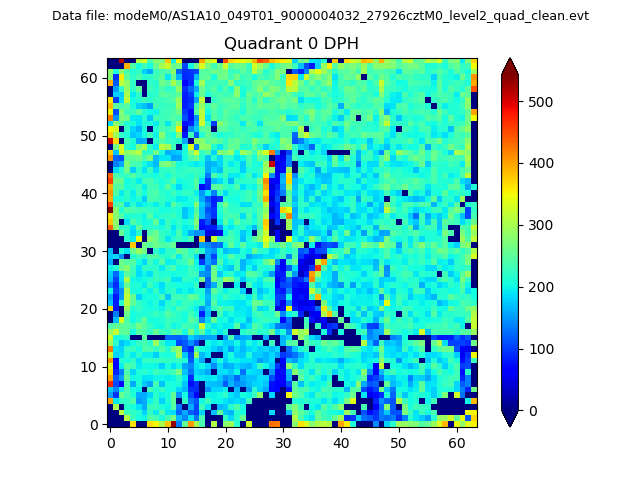 |
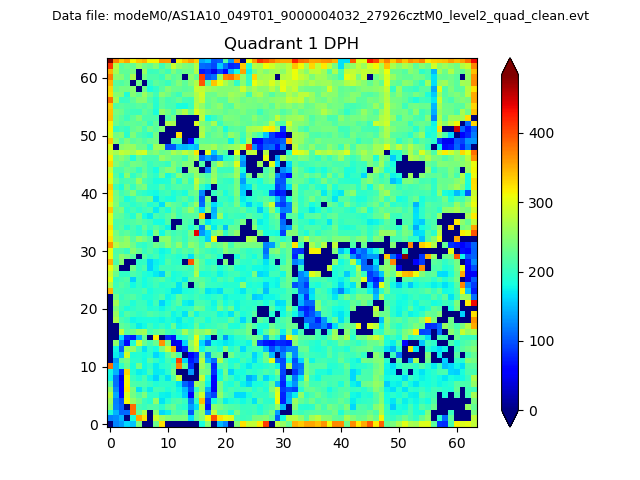 |
Quadrant B |
|---|---|---|---|
| Quadrant D | 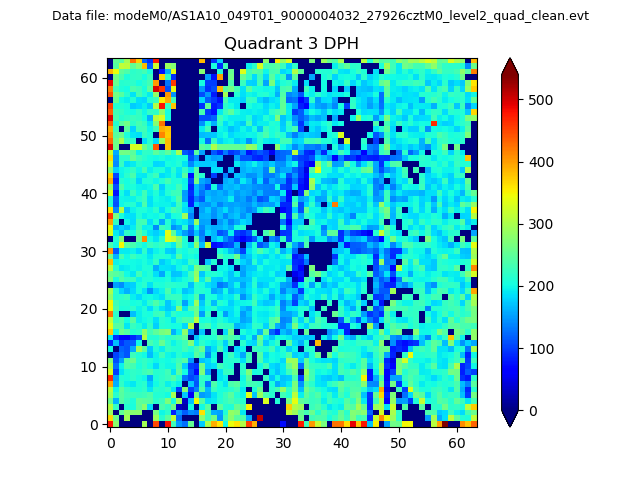 |
 |
Quadrant C |
| Plot type | Count rate plots | Images |
|---|---|---|
| Comparison with Poisson distribution Blue bars denote a histogram of data divided into 1 sec bins. Red curve is a Poisson curve with rate = median count rate of data. |
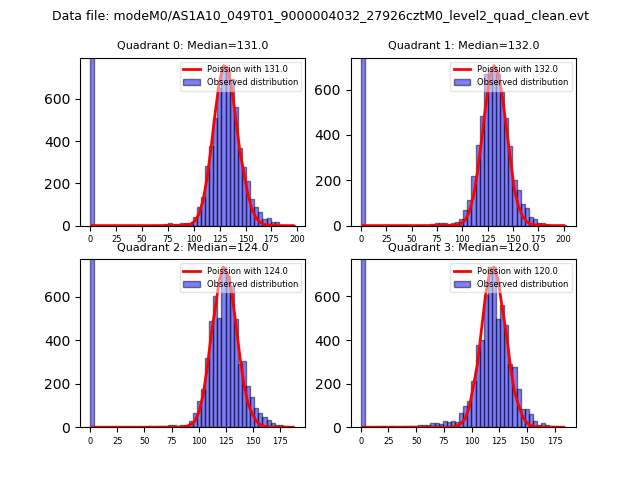 |
 |
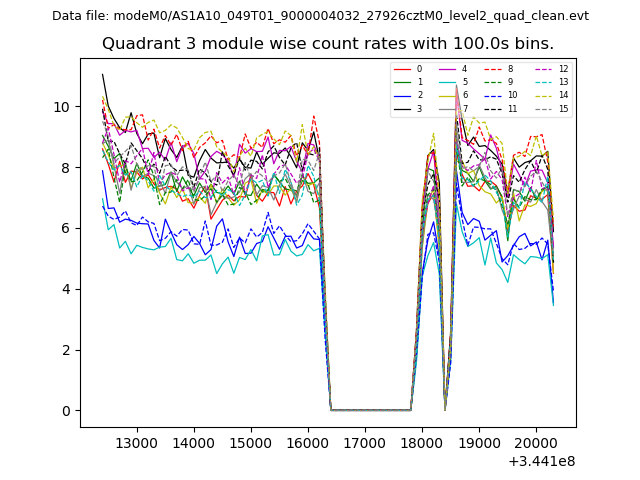
| Quadrant-wise count rates Data is divided into 100 sec bins |
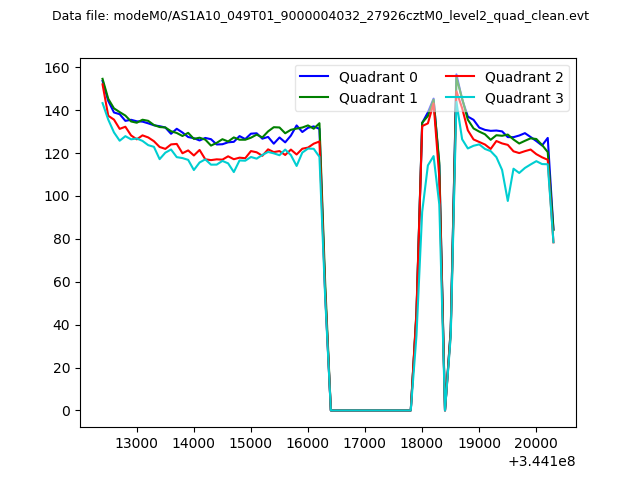 |
|
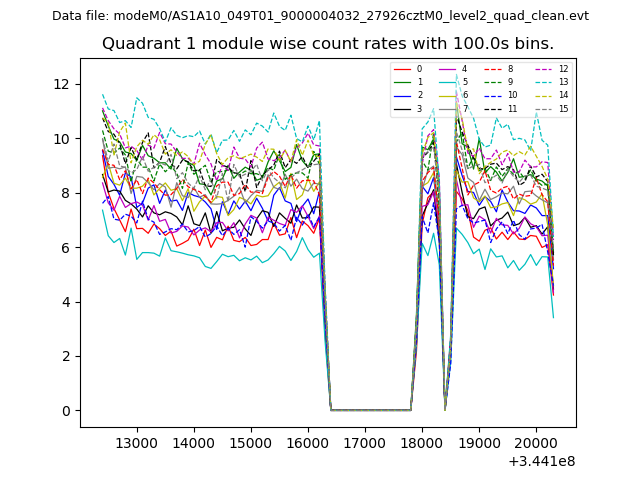
| Module-wise count rates for Quadrant A Data is divided into 100 sec bins |
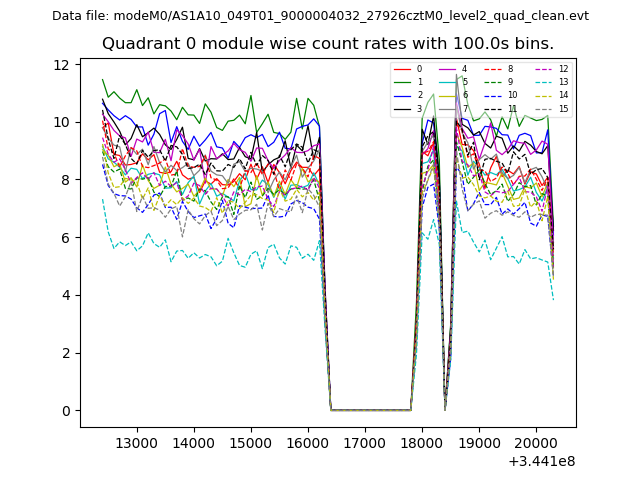 |
 |
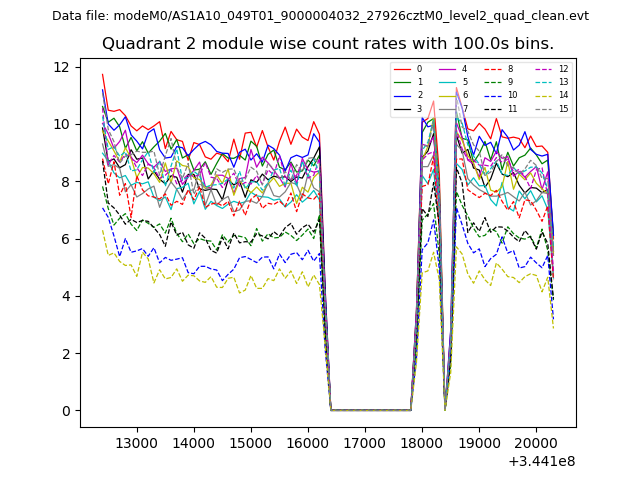
| Module-wise count rates for Quadrant B Data is divided into 100 sec bins |
 |
 |
| Module-wise count rates for Quadrant C Data is divided into 100 sec bins |
 |
 |
| Module-wise count rates for Quadrant D Data is divided into 100 sec bins |
 |
 |
| Parameter | Plot |
|---|---|
| CZT HV Monitor | 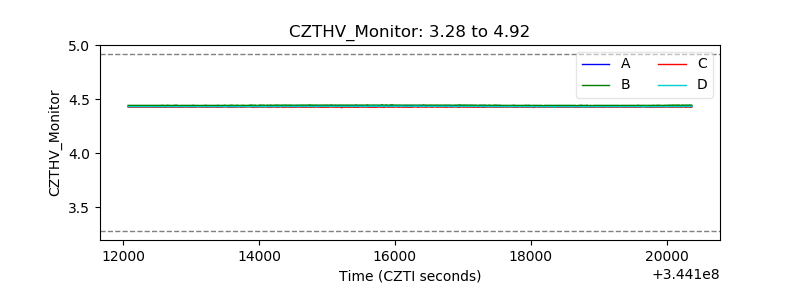 |
| D_VDD | 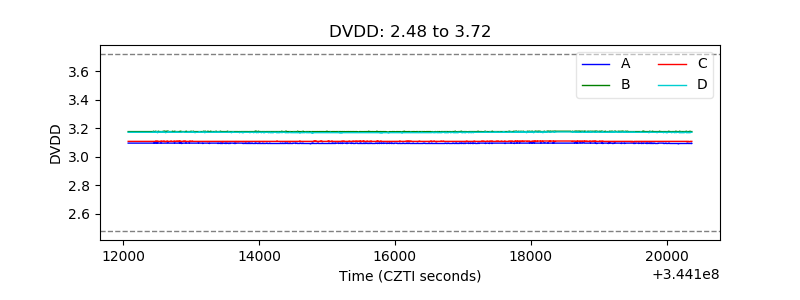 |
| Temperature 1 | 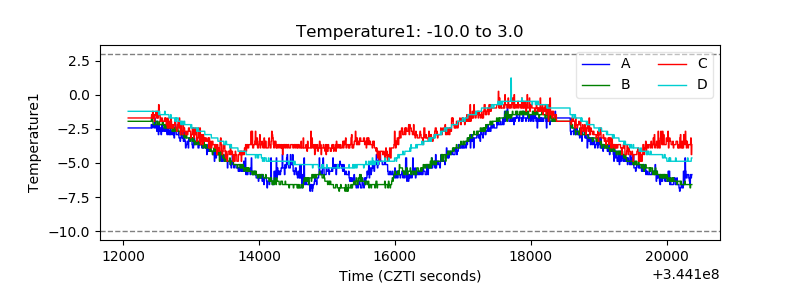 |
| Veto HV Monitor | 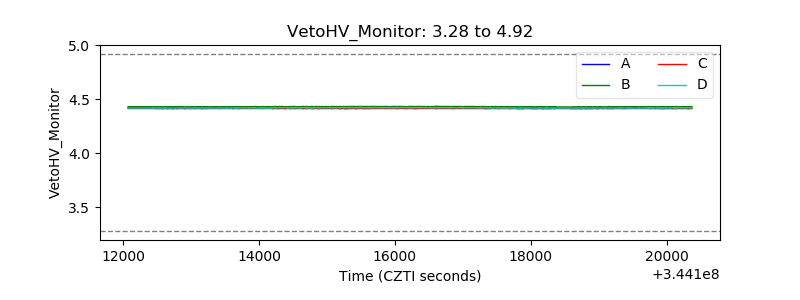 |
| Veto LLD | 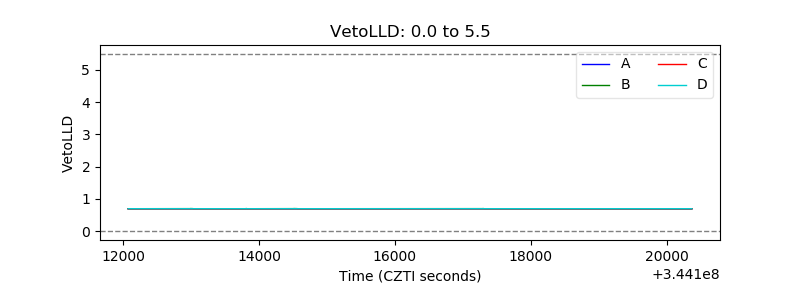 |
| Alpha Counter | 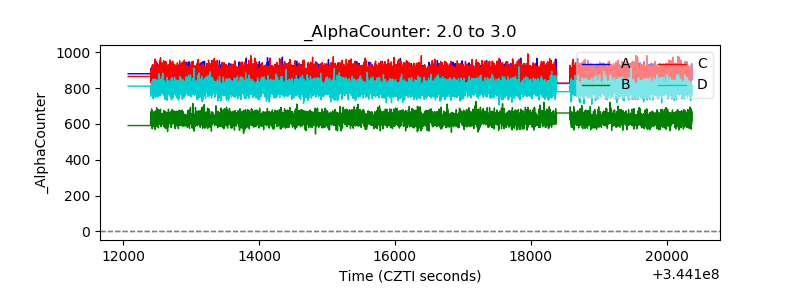 |
| _CPM_Rate | 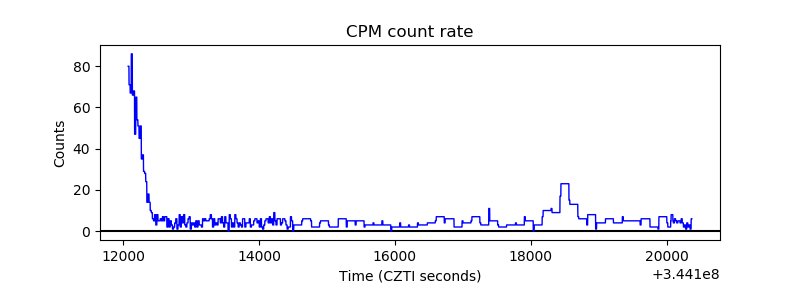 |
| CZT Counter | 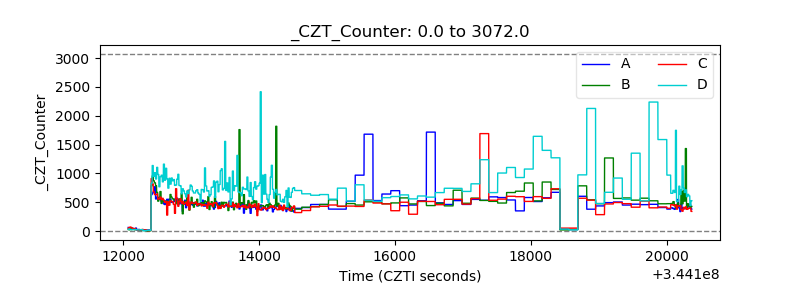 |
| +2.5 Volts monitor |  |
| +5 Volts monitor |  |
| _ROLL_ROT | 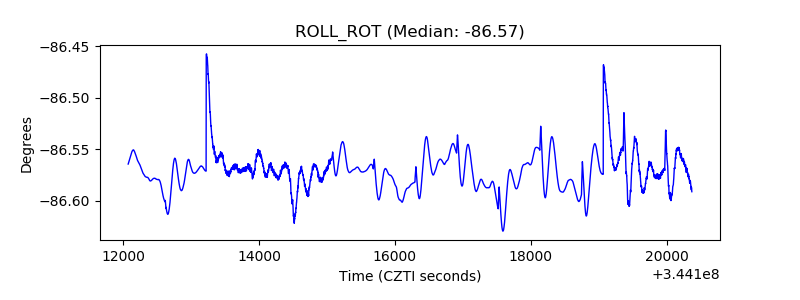 |
| _Roll_DEC | 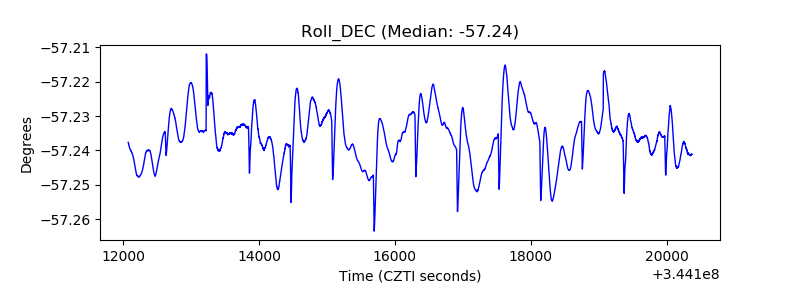 |
| _Roll_RA | 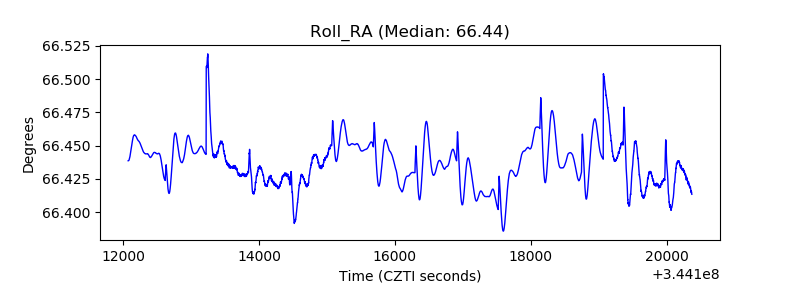 |
| Veto Counter | 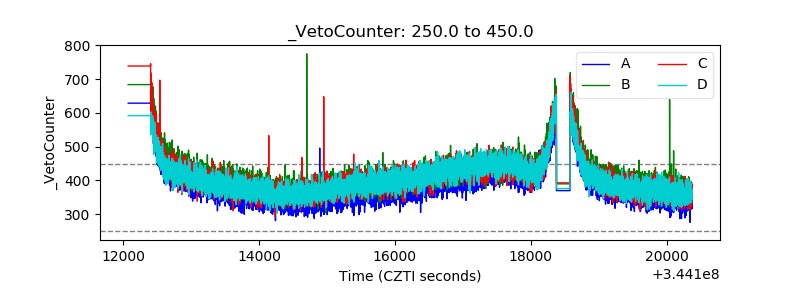 |