| Param | Original file | Final file |
|---|---|---|
| Filename | modeM0/AS1A10_049T01_9000004032_27927cztM0_level2.evt | modeM0/AS1A10_049T01_9000004032_27927cztM0_level2_quad_clean.evt |
| Size (bytes) | 624,110,400 | 119,747,520 |
| Size | 595.2 MB | 114.2 MB |
| Events in quadrant A | 3,648,969 | 804,553 |
| Events in quadrant B | 4,182,122 | 803,974 |
| Events in quadrant C | 3,716,064 | 759,532 |
| Events in quadrant D | 6,826,638 | 717,160 |
| Mode M9 | |||
|---|---|---|---|
| Quadrant | BADHDUFLAG | Total packets | Discarded packets |
| A | 0 | 5 | 0 |
| B | 0 | 5 | 0 |
| C | 0 | 5 | 0 |
| D | 0 | 5 | 0 |
| Mode M0 | |||
|---|---|---|---|
| Quadrant | BADHDUFLAG | Total packets | Discarded packets |
| A | 0 | 16075 | 0 |
| B | 0 | 17454 | 0 |
| C | 0 | 16117 | 0 |
| D | 0 | 25618 | 0 |
| Quadrant | Total seconds | Saturated seconds | Saturation percentage |
|---|---|---|---|
| A | 7789 | 68 | 0.873026% |
| B | 7790 | 173 | 2.220796% |
| C | 7789 | 151 | 1.938631% |
| D | 7789 | 670 | 8.601874% |
Noise dominated data is calculated using 1-second bins in cleaned event files. If a bin has >2000 counts, and if more than 50% of those come from <1% of pixels, then it is considered to be noise-dominated and hence unusable.
| Quadrant | # 1 sec bins | Bins with >0 counts | Bins with >2000 counts | High rate bins dominated by noise | Noise dominated (total time) | Noise dominated (detector-on time) | Marked lightcurve |
|---|---|---|---|---|---|---|---|
| A | 8154 | 7792 | 0 | 0 | 0.00% | 0.00% | 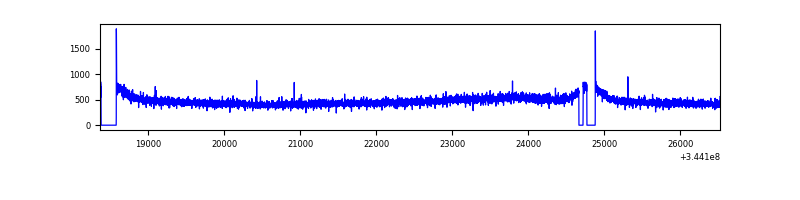 |
| B | 8155 | 7793 | 22 | 22 | 0.27% | 0.28% | 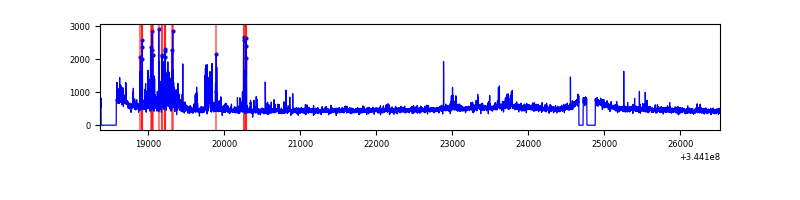 |
| C | 8154 | 7792 | 0 | 0 | 0.00% | 0.00% | 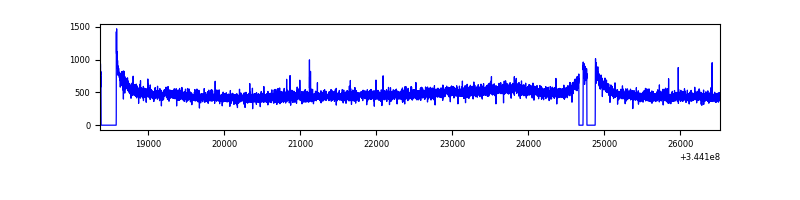 |
| D | 8154 | 7792 | 616 | 616 | 7.55% | 7.91% | 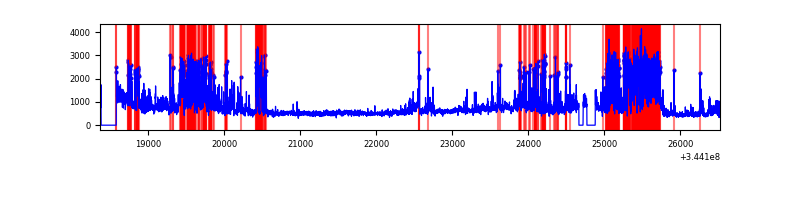 |
Top three noisy pixels from each quadrant. If the there are fewer than three noisy pixels in the level2.evt file, extra rows are filled as -1
| Pixel properties | Quadrant properties | ||||||
|---|---|---|---|---|---|---|---|
| Quadrant | DetID | PixID | Counts | Sigma | Mean | Median | Sigma |
| A | 13 | 254 | 14216 | 69.69 | 942 | 921 | 190.8 |
| A | 8 | 192 | 10312 | 49.22 | 942 | 921 | 190.8 |
| A | 3 | 137 | 9239 | 43.6 | 942 | 921 | 190.8 |
| B | 10 | 245 | 397774 | 2211.26 | 938 | 912 | 179.5 |
| B | 0 | 230 | 45167 | 246.58 | 938 | 912 | 179.5 |
| B | 12 | 111 | 21971 | 117.34 | 938 | 912 | 179.5 |
| C | 14 | 238 | 143480 | 678.89 | 896 | 896 | 210.0 |
| C | 3 | 233 | 76595 | 360.43 | 896 | 896 | 210.0 |
| C | 13 | 61 | 6209 | 25.29 | 896 | 896 | 210.0 |
| D | 7 | 238 | 957190 | 4543.04 | 880 | 854 | 210.5 |
| D | 1 | 52 | 918440 | 4358.96 | 880 | 854 | 210.5 |
| D | 8 | 195 | 795415 | 3774.53 | 880 | 854 | 210.5 |
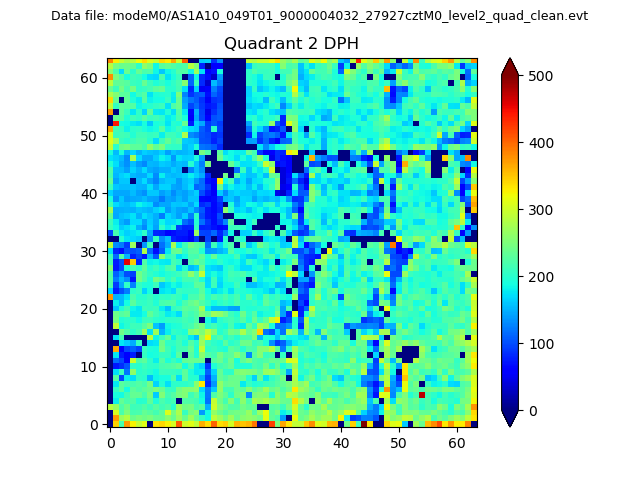
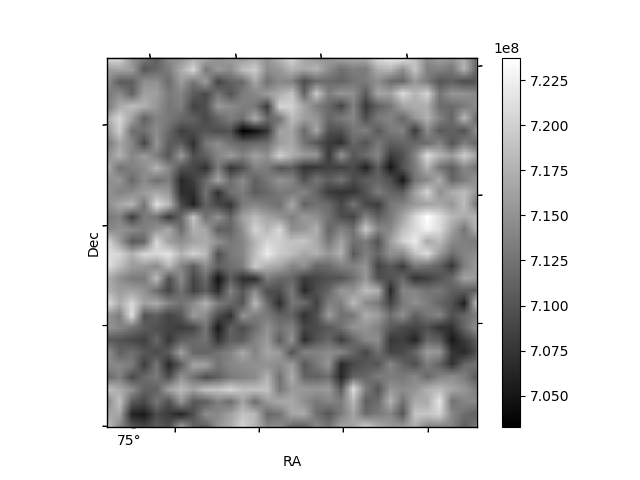
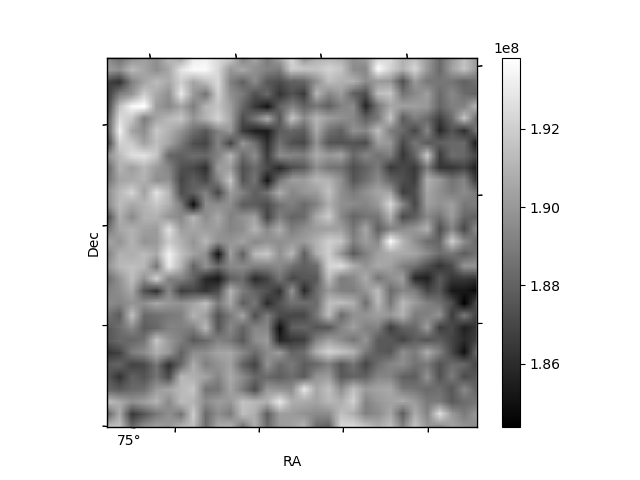
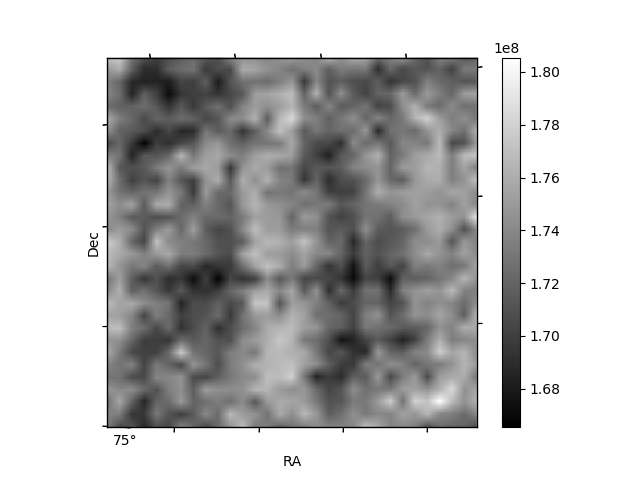
Histogram calculated using DETX and DETY for each event in the final _common_clean file
| Quadrant A | 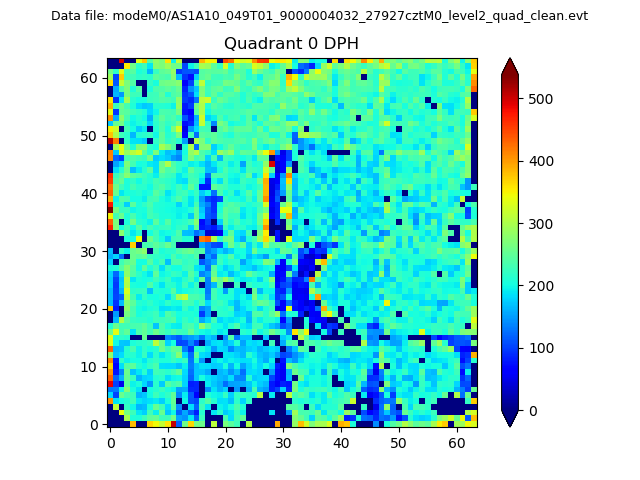 |
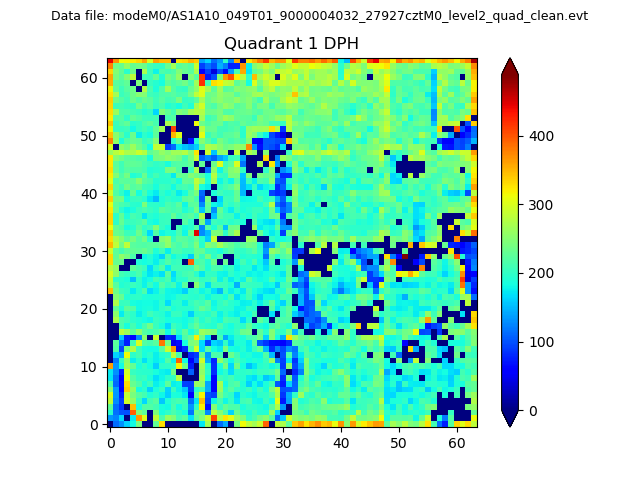 |
Quadrant B |
|---|---|---|---|
| Quadrant D | 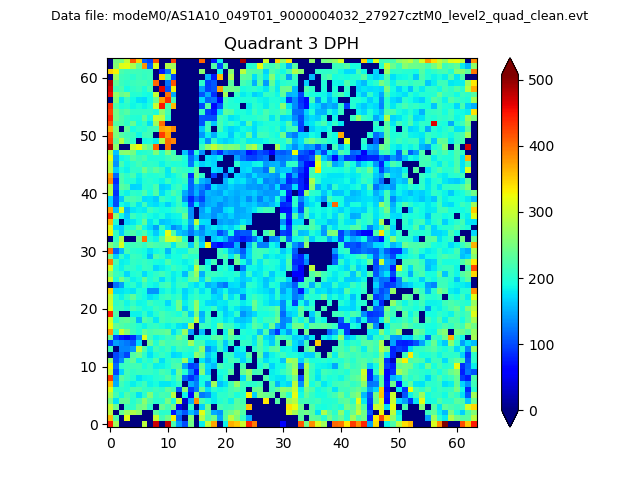 |
 |
Quadrant C |
| Plot type | Count rate plots | Images |
|---|---|---|
| Comparison with Poisson distribution Blue bars denote a histogram of data divided into 1 sec bins. Red curve is a Poisson curve with rate = median count rate of data. |
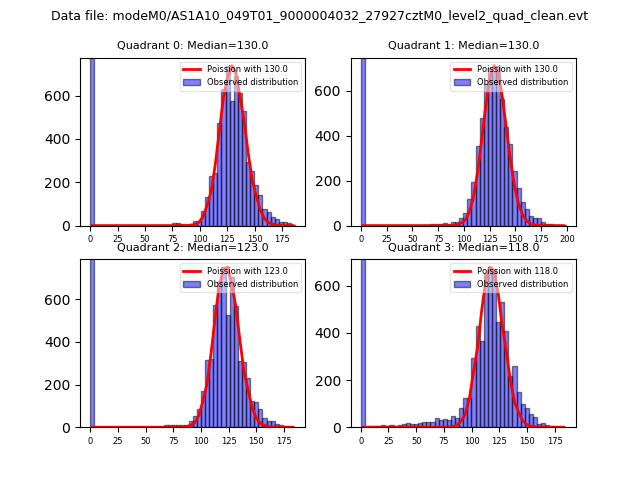 |
 |
| Quadrant-wise count rates Data is divided into 100 sec bins |
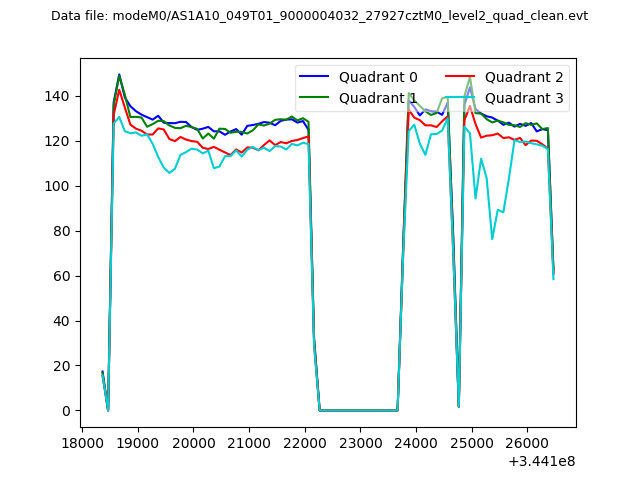 |
|
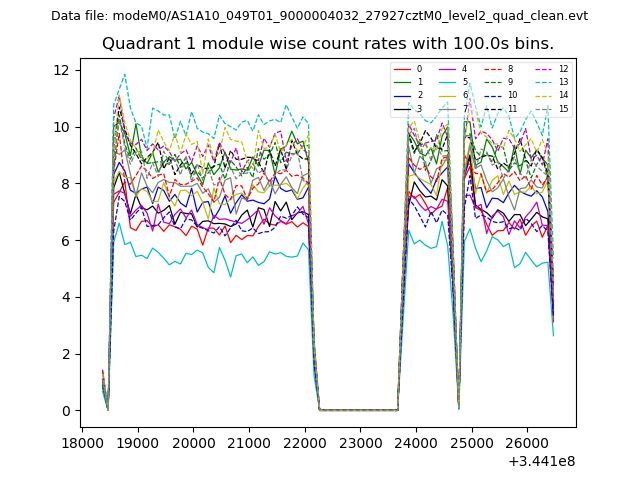
| Module-wise count rates for Quadrant A Data is divided into 100 sec bins |
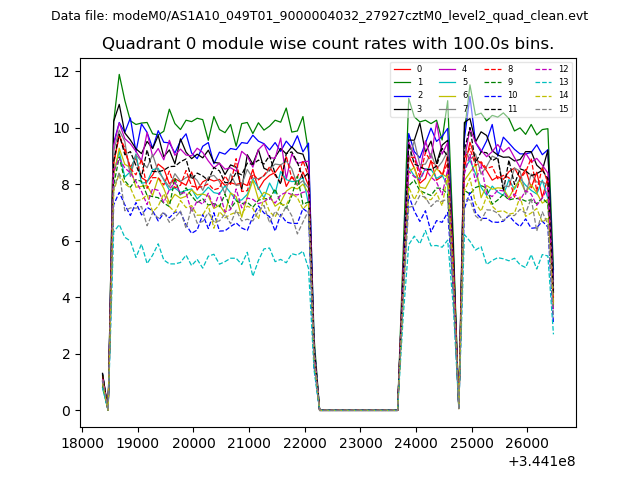 |
 |
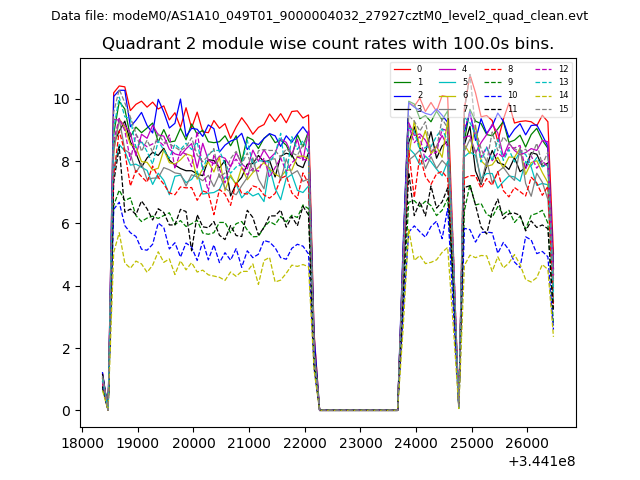
| Module-wise count rates for Quadrant B Data is divided into 100 sec bins |
 |
 |
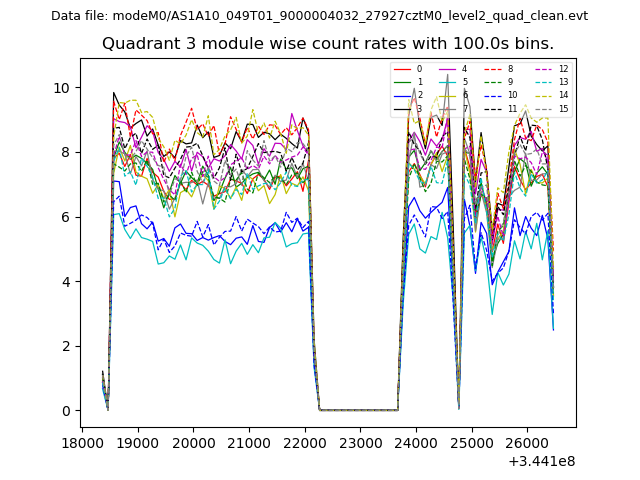
| Module-wise count rates for Quadrant C Data is divided into 100 sec bins |
 |
 |
| Module-wise count rates for Quadrant D Data is divided into 100 sec bins |
 |
 |
| Parameter | Plot |
|---|---|
| CZT HV Monitor | 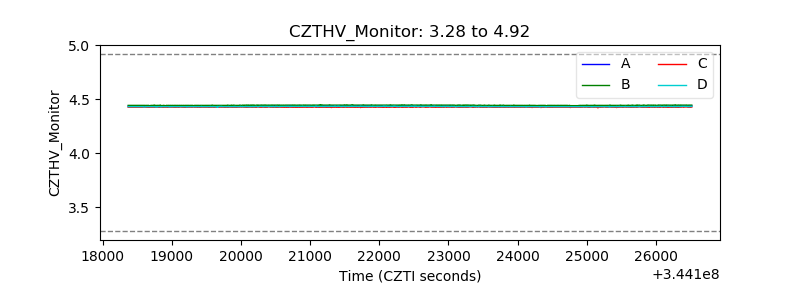 |
| D_VDD | 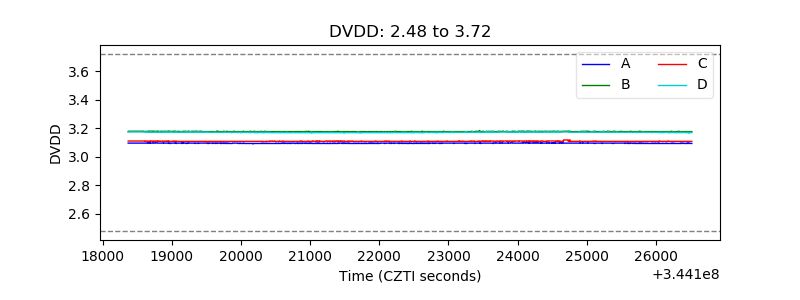 |
| Temperature 1 | 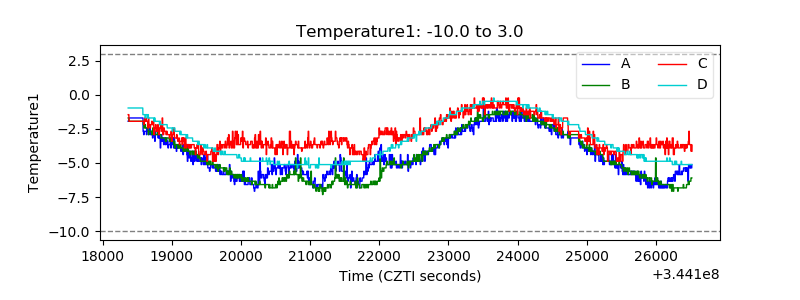 |
| Veto HV Monitor |  |
| Veto LLD | 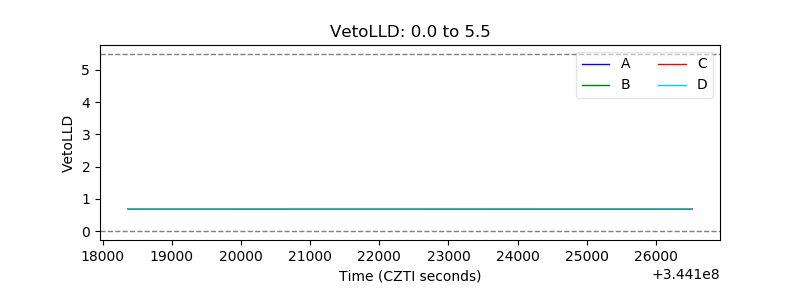 |
| Alpha Counter | 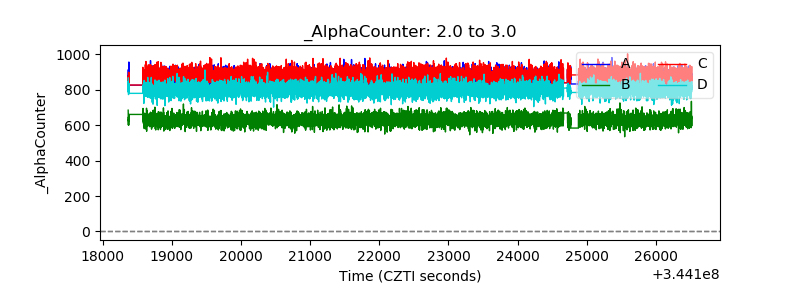 |
| _CPM_Rate | 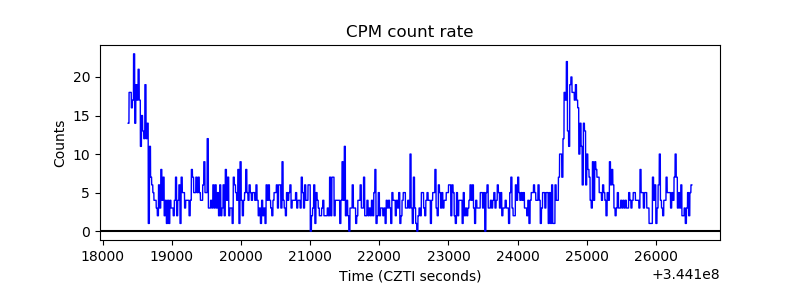 |
| CZT Counter |  |
| +2.5 Volts monitor |  |
| +5 Volts monitor | 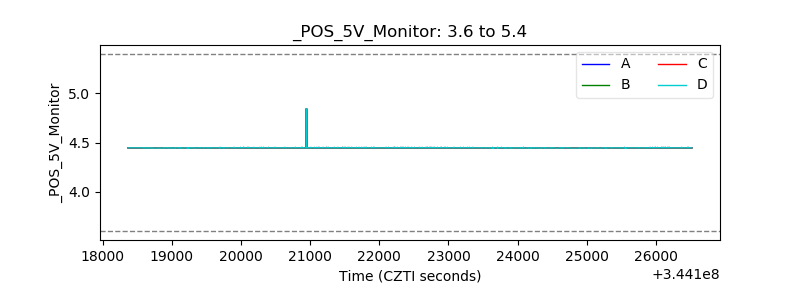 |
| _ROLL_ROT | 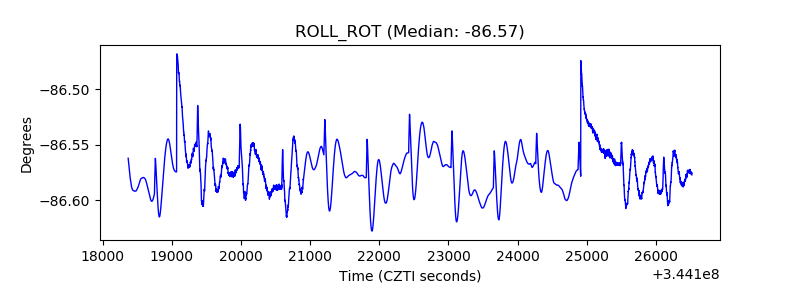 |
| _Roll_DEC | 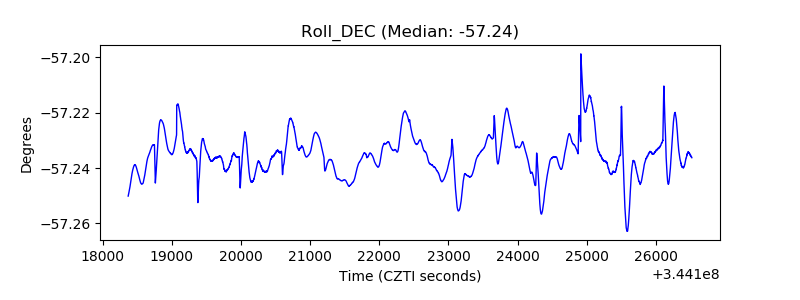 |
| _Roll_RA |  |
| Veto Counter | 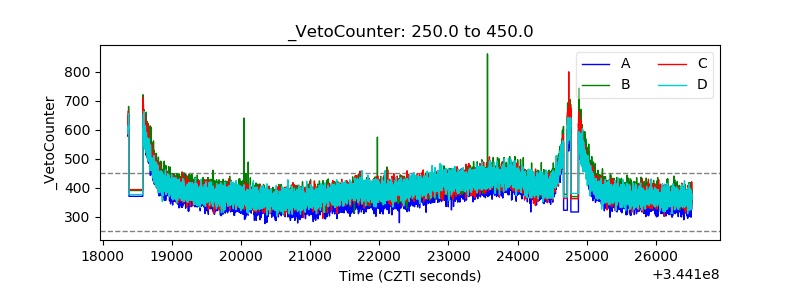 |