| Param | Original file | Final file |
|---|---|---|
| Filename | modeM0/AS1A10_049T01_9000004032_27930cztM0_level2.evt | modeM0/AS1A10_049T01_9000004032_27930cztM0_level2_quad_clean.evt |
| Size (bytes) | 1,030,383,360 | 203,184,000 |
| Size | 982.7 MB | 193.8 MB |
| Events in quadrant A | 6,297,468 | 1,345,299 |
| Events in quadrant B | 7,037,062 | 1,354,437 |
| Events in quadrant C | 6,633,057 | 1,276,433 |
| Events in quadrant D | 10,317,937 | 1,237,848 |
| Mode M9 | |||
|---|---|---|---|
| Quadrant | BADHDUFLAG | Total packets | Discarded packets |
| A | 0 | 19 | 0 |
| B | 0 | 19 | 0 |
| C | 0 | 19 | 0 |
| D | 0 | 19 | 0 |
| Mode M0 | |||
|---|---|---|---|
| Quadrant | BADHDUFLAG | Total packets | Discarded packets |
| A | 0 | 27643 | 0 |
| B | 0 | 29465 | 0 |
| C | 0 | 28187 | 0 |
| D | 0 | 39995 | 0 |
| Quadrant | Total seconds | Saturated seconds | Saturation percentage |
|---|---|---|---|
| A | 13623 | 73 | 0.535858% |
| B | 13624 | 161 | 1.181738% |
| C | 13624 | 215 | 1.578097% |
| D | 13624 | 528 | 3.875514% |
Noise dominated data is calculated using 1-second bins in cleaned event files. If a bin has >2000 counts, and if more than 50% of those come from <1% of pixels, then it is considered to be noise-dominated and hence unusable.
| Quadrant | # 1 sec bins | Bins with >0 counts | Bins with >2000 counts | High rate bins dominated by noise | Noise dominated (total time) | Noise dominated (detector-on time) | Marked lightcurve |
|---|---|---|---|---|---|---|---|
| A | 15348 | 13625 | 0 | 0 | 0.00% | 0.00% | 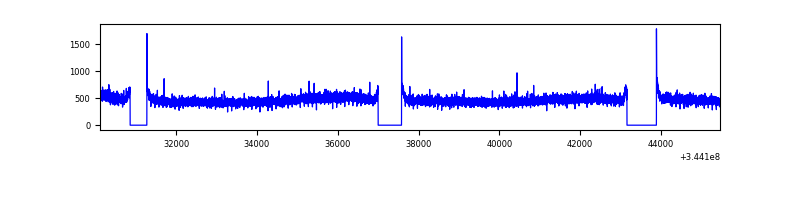 |
| B | 15349 | 13626 | 28 | 28 | 0.18% | 0.21% | 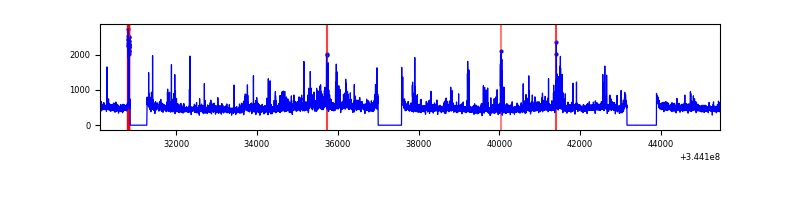 |
| C | 15349 | 13626 | 37 | 37 | 0.24% | 0.27% | 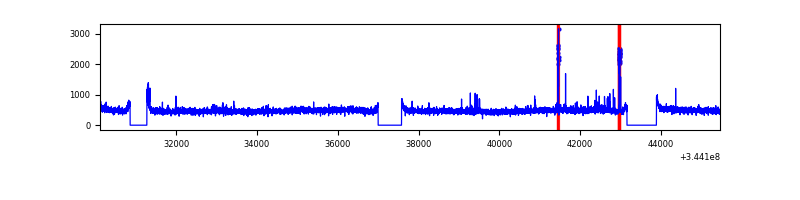 |
| D | 15349 | 13625 | 423 | 423 | 2.76% | 3.10% | 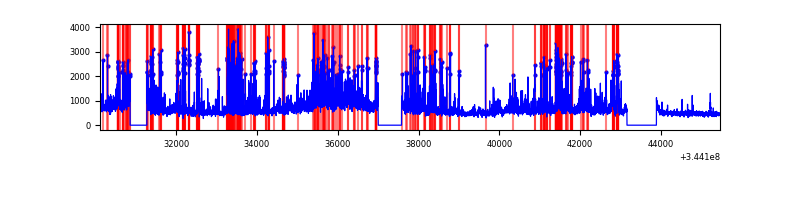 |
Top three noisy pixels from each quadrant. If the there are fewer than three noisy pixels in the level2.evt file, extra rows are filled as -1
| Pixel properties | Quadrant properties | ||||||
|---|---|---|---|---|---|---|---|
| Quadrant | DetID | PixID | Counts | Sigma | Mean | Median | Sigma |
| A | 13 | 254 | 23100 | 65.62 | 1629 | 1591 | 327.8 |
| A | 3 | 137 | 15806 | 43.37 | 1629 | 1591 | 327.8 |
| A | 8 | 192 | 14911 | 40.64 | 1629 | 1591 | 327.8 |
| B | 10 | 245 | 577376 | 1852.18 | 1620 | 1579 | 310.9 |
| B | 12 | 111 | 39290 | 121.31 | 1620 | 1579 | 310.9 |
| B | 0 | 230 | 34917 | 107.24 | 1620 | 1579 | 310.9 |
| C | 14 | 238 | 249084 | 681.36 | 1558 | 1568 | 363.3 |
| C | 3 | 233 | 238345 | 651.79 | 1558 | 1568 | 363.3 |
| C | 6 | 112 | 69891 | 188.08 | 1558 | 1568 | 363.3 |
| D | 1 | 52 | 2577951 | 6965.43 | 1550 | 1505 | 369.9 |
| D | 8 | 195 | 839137 | 2264.54 | 1550 | 1505 | 369.9 |
| D | 2 | 250 | 478418 | 1289.34 | 1550 | 1505 | 369.9 |
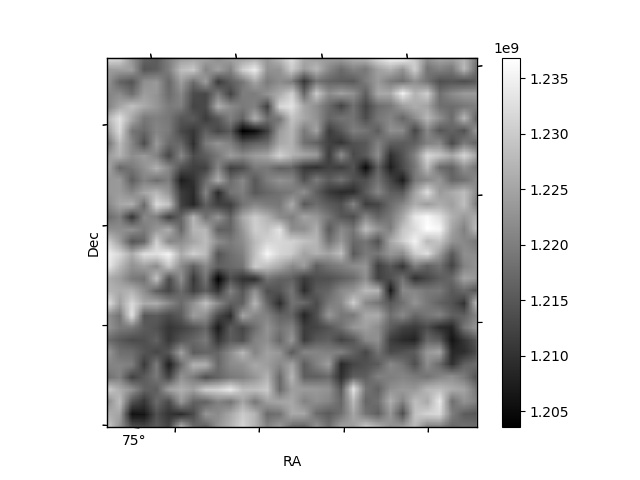
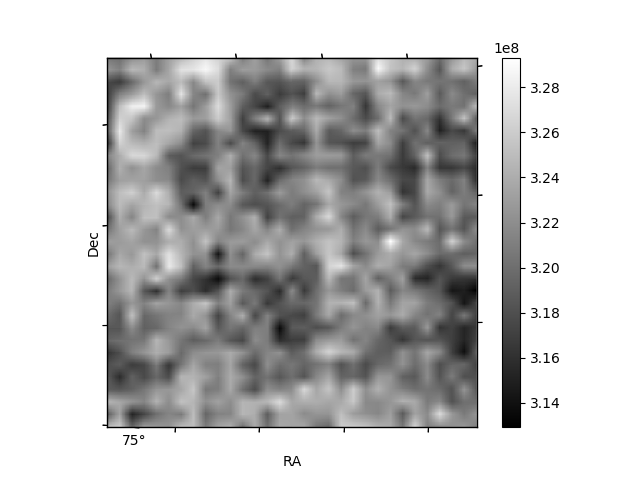
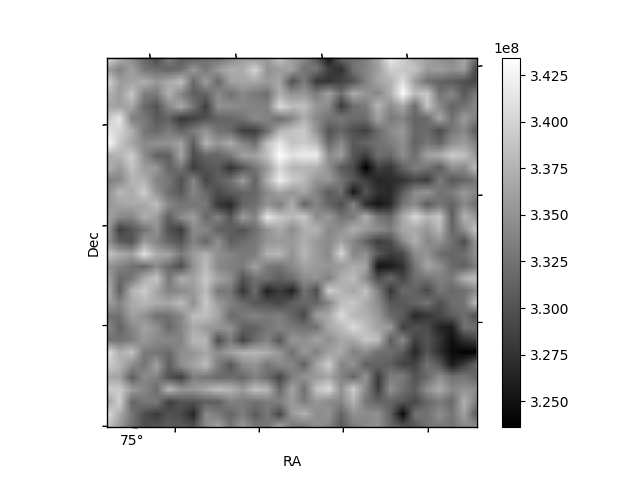
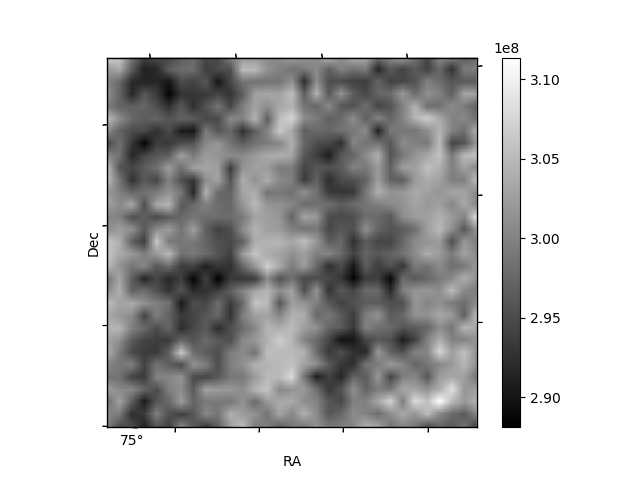
Histogram calculated using DETX and DETY for each event in the final _common_clean file
| Quadrant A | 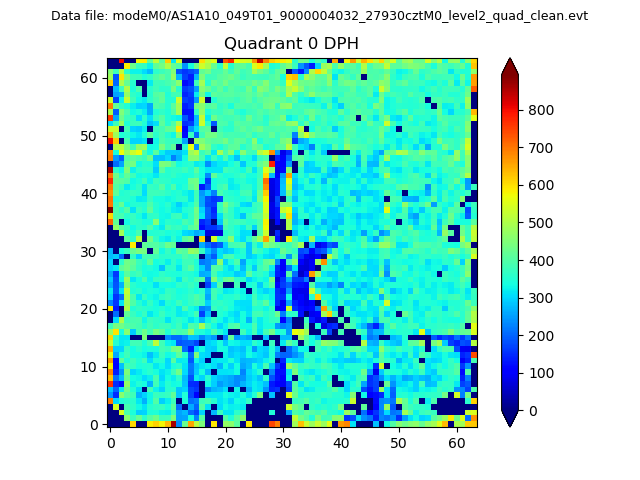 |
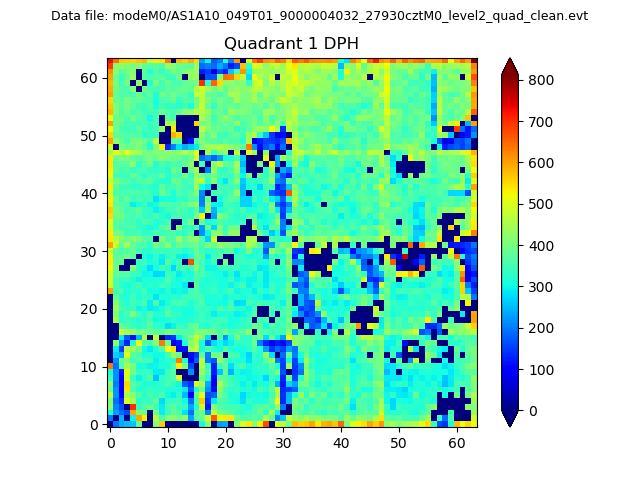 |
Quadrant B |
|---|---|---|---|
| Quadrant D | 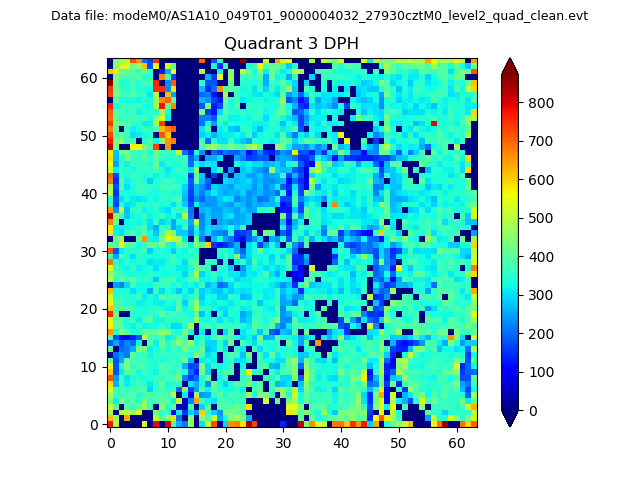 |
 |
Quadrant C |
| Plot type | Count rate plots | Images |
|---|---|---|
| Comparison with Poisson distribution Blue bars denote a histogram of data divided into 1 sec bins. Red curve is a Poisson curve with rate = median count rate of data. |
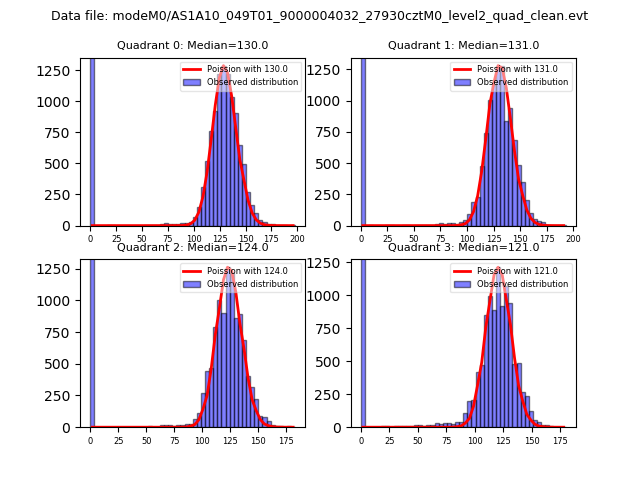 |
 |
| Quadrant-wise count rates Data is divided into 100 sec bins |
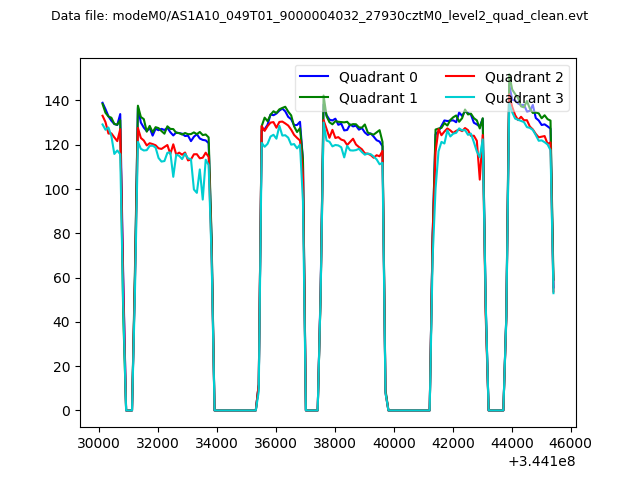 |
|
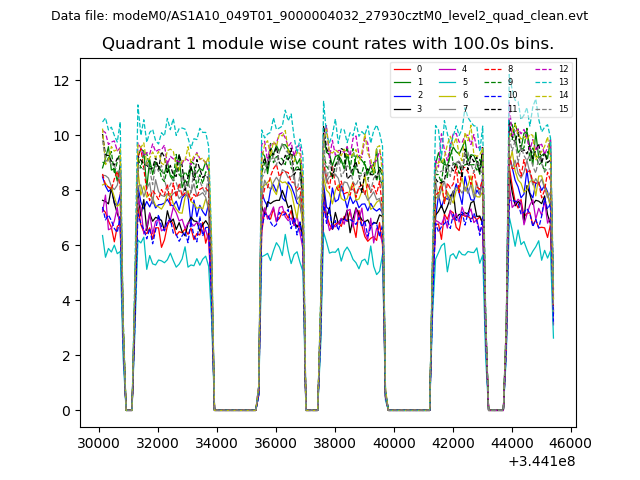
| Module-wise count rates for Quadrant A Data is divided into 100 sec bins |
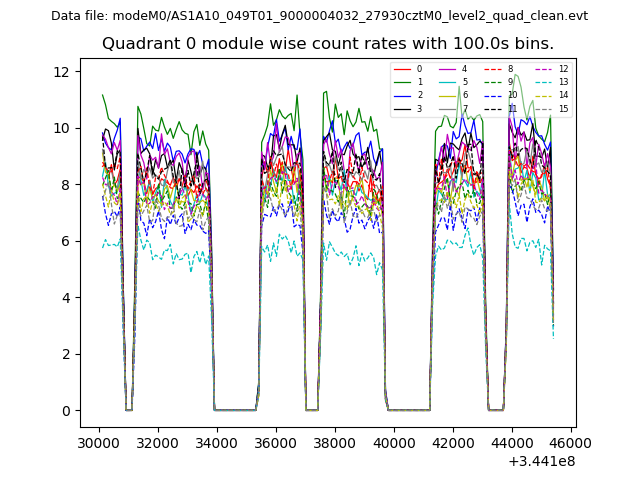 |
 |
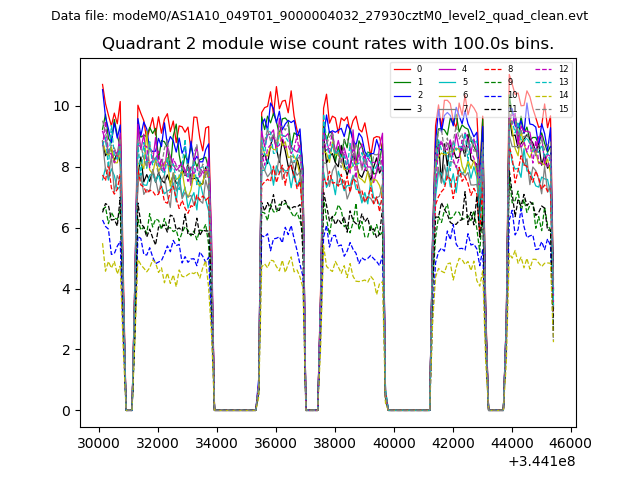
| Module-wise count rates for Quadrant B Data is divided into 100 sec bins |
 |
 |
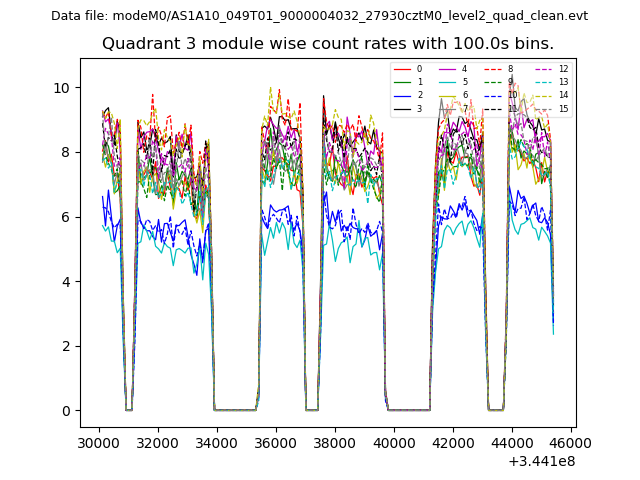
| Module-wise count rates for Quadrant C Data is divided into 100 sec bins |
 |
 |
| Module-wise count rates for Quadrant D Data is divided into 100 sec bins |
 |
 |
| Parameter | Plot |
|---|---|
| CZT HV Monitor | 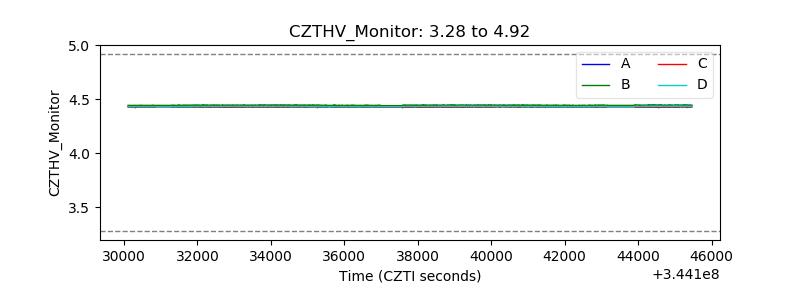 |
| D_VDD | 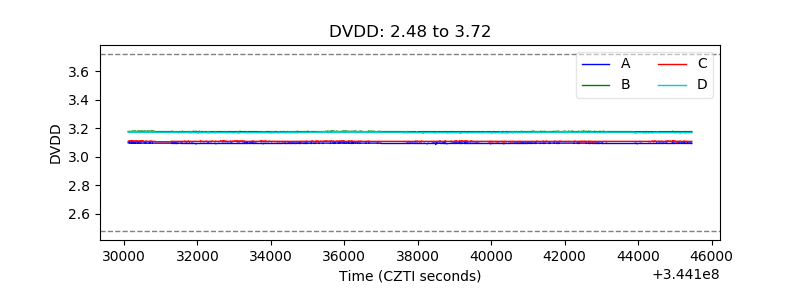 |
| Temperature 1 | 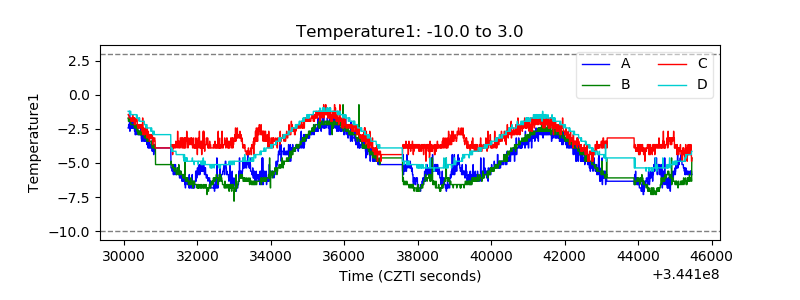 |
| Veto HV Monitor |  |
| Veto LLD | 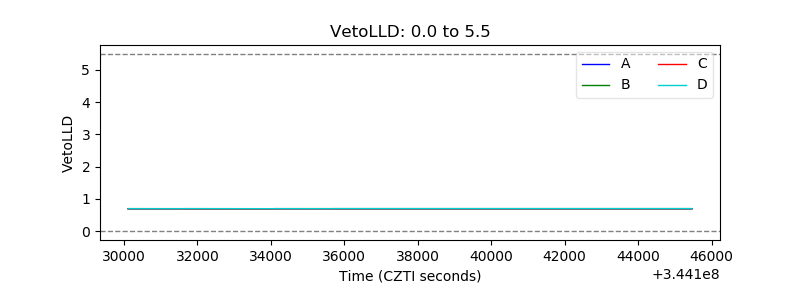 |
| Alpha Counter | 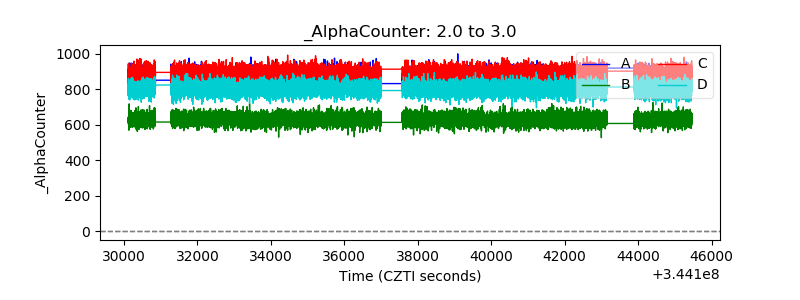 |
| _CPM_Rate | 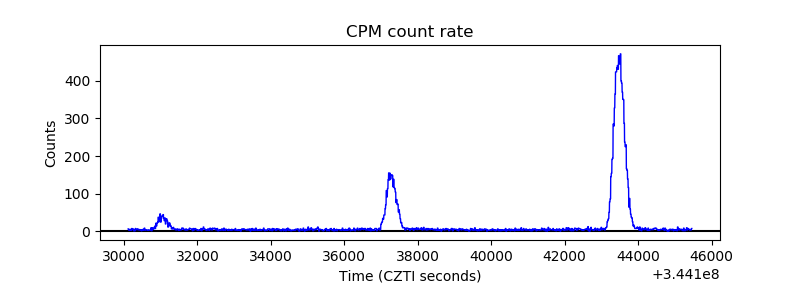 |
| CZT Counter |  |
| +2.5 Volts monitor |  |
| +5 Volts monitor |  |
| _ROLL_ROT | 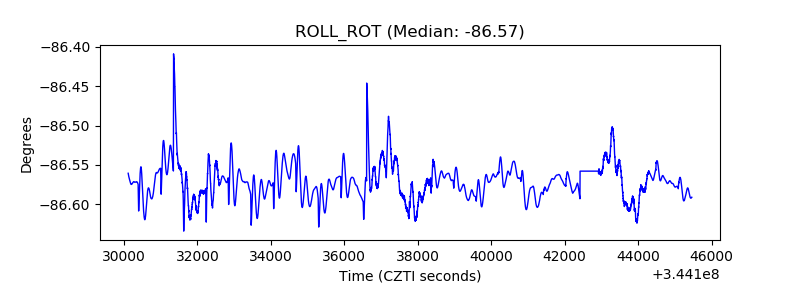 |
| _Roll_DEC | 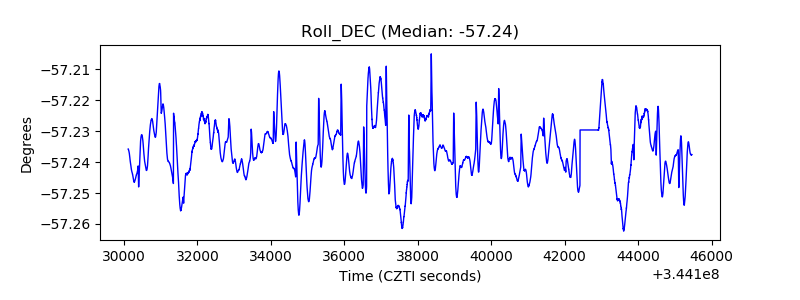 |
| _Roll_RA | 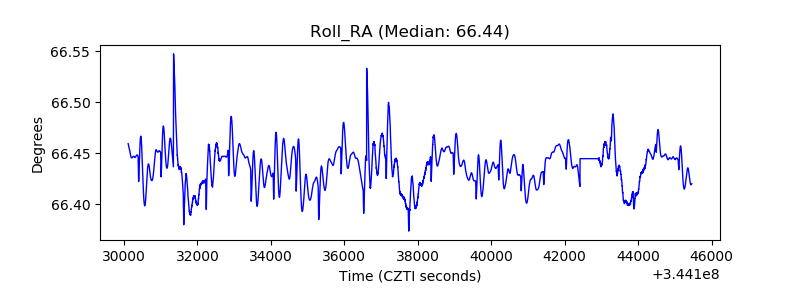 |
| Veto Counter | 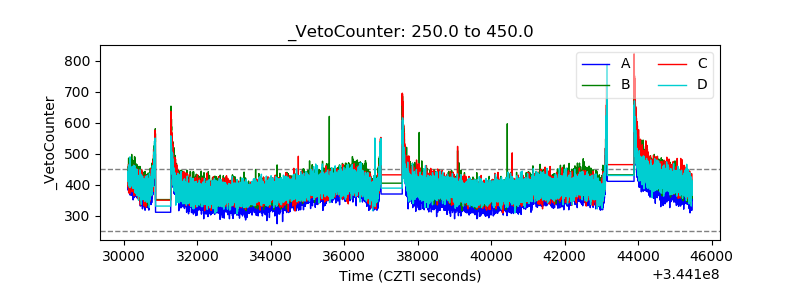 |