| Param | Original file | Final file |
|---|---|---|
| Filename | modeM0/AS1A10_049T01_9000004032_27931cztM0_level2.evt | modeM0/AS1A10_049T01_9000004032_27931cztM0_level2_quad_clean.evt |
| Size (bytes) | 485,205,120 | 99,552,960 |
| Size | 462.7 MB | 94.9 MB |
| Events in quadrant A | 3,103,528 | 657,638 |
| Events in quadrant B | 3,782,851 | 657,245 |
| Events in quadrant C | 3,252,103 | 626,680 |
| Events in quadrant D | 4,107,594 | 612,923 |
| Mode M9 | |||
|---|---|---|---|
| Quadrant | BADHDUFLAG | Total packets | Discarded packets |
| A | 0 | 9 | 0 |
| B | 0 | 9 | 0 |
| C | 0 | 9 | 0 |
| D | 0 | 9 | 0 |
| Mode M0 | |||
|---|---|---|---|
| Quadrant | BADHDUFLAG | Total packets | Discarded packets |
| A | 0 | 13408 | 0 |
| B | 0 | 15314 | 0 |
| C | 0 | 13695 | 0 |
| D | 0 | 16422 | 0 |
| Quadrant | Total seconds | Saturated seconds | Saturation percentage |
|---|---|---|---|
| A | 6601 | 32 | 0.484775% |
| B | 6602 | 212 | 3.211148% |
| C | 6601 | 81 | 1.227087% |
| D | 6601 | 195 | 2.954098% |
Noise dominated data is calculated using 1-second bins in cleaned event files. If a bin has >2000 counts, and if more than 50% of those come from <1% of pixels, then it is considered to be noise-dominated and hence unusable.
| Quadrant | # 1 sec bins | Bins with >0 counts | Bins with >2000 counts | High rate bins dominated by noise | Noise dominated (total time) | Noise dominated (detector-on time) | Marked lightcurve |
|---|---|---|---|---|---|---|---|
| A | 7516 | 6601 | 0 | 0 | 0.00% | 0.00% | 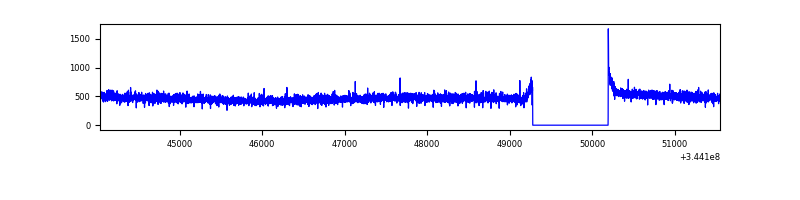 |
| B | 7517 | 6602 | 125 | 125 | 1.66% | 1.89% | 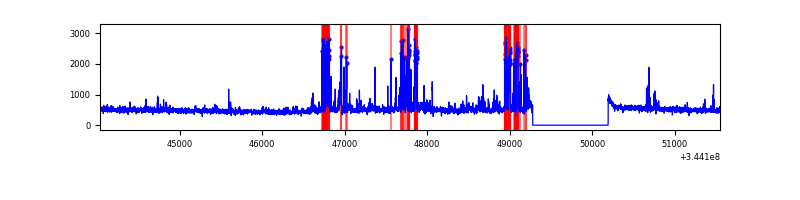 |
| C | 7516 | 6601 | 0 | 0 | 0.00% | 0.00% | 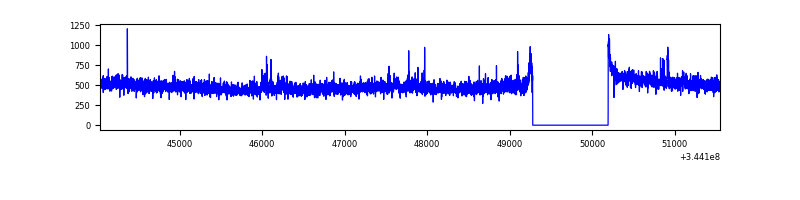 |
| D | 7516 | 6601 | 163 | 163 | 2.17% | 2.47% | 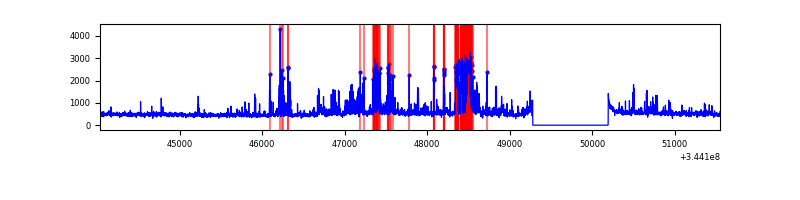 |
Top three noisy pixels from each quadrant. If the there are fewer than three noisy pixels in the level2.evt file, extra rows are filled as -1
| Pixel properties | Quadrant properties | ||||||
|---|---|---|---|---|---|---|---|
| Quadrant | DetID | PixID | Counts | Sigma | Mean | Median | Sigma |
| A | 13 | 254 | 11567 | 66.89 | 803 | 785 | 161.2 |
| A | 3 | 137 | 7840 | 43.77 | 803 | 785 | 161.2 |
| A | 0 | 226 | 6826 | 37.48 | 803 | 785 | 161.2 |
| B | 10 | 245 | 630130 | 4175.71 | 792 | 772 | 150.7 |
| B | 0 | 230 | 19244 | 122.56 | 792 | 772 | 150.7 |
| B | 12 | 111 | 18941 | 120.55 | 792 | 772 | 150.7 |
| C | 14 | 238 | 125163 | 682.36 | 776 | 779 | 182.3 |
| C | 3 | 233 | 71894 | 390.13 | 776 | 779 | 182.3 |
| C | 10 | 22 | 20031 | 105.62 | 776 | 779 | 182.3 |
| D | 1 | 52 | 528048 | 2857.81 | 773 | 749 | 184.5 |
| D | 2 | 250 | 410619 | 2221.38 | 773 | 749 | 184.5 |
| D | 8 | 195 | 149940 | 808.57 | 773 | 749 | 184.5 |
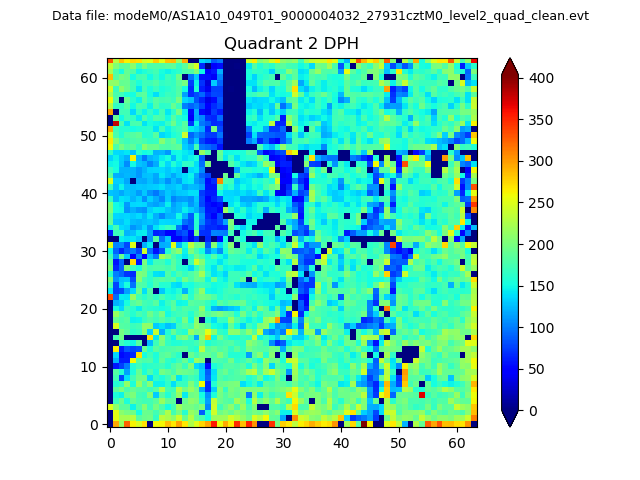
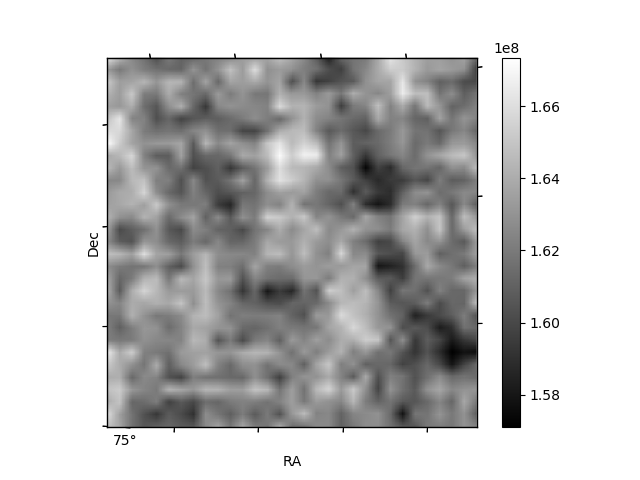
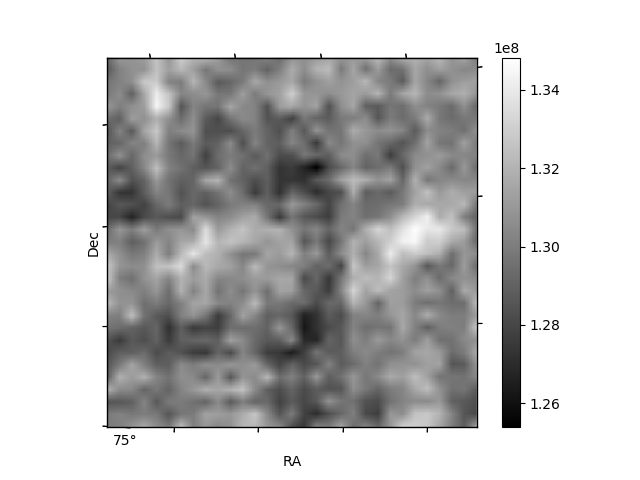
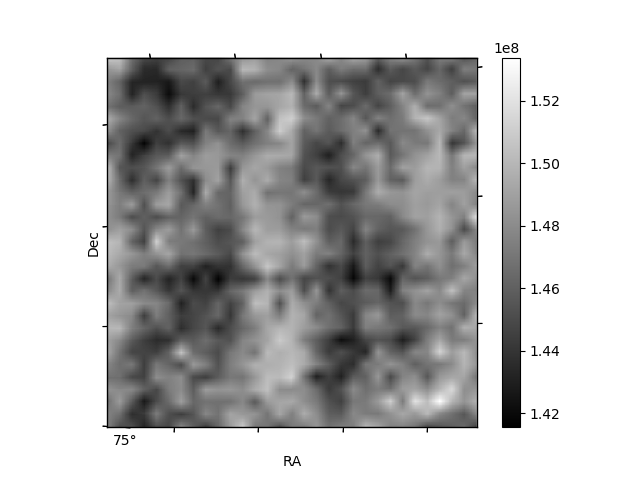
Histogram calculated using DETX and DETY for each event in the final _common_clean file
| Quadrant A | 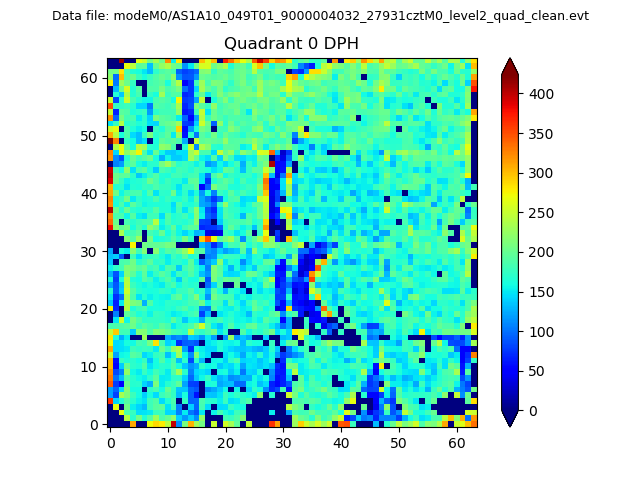 |
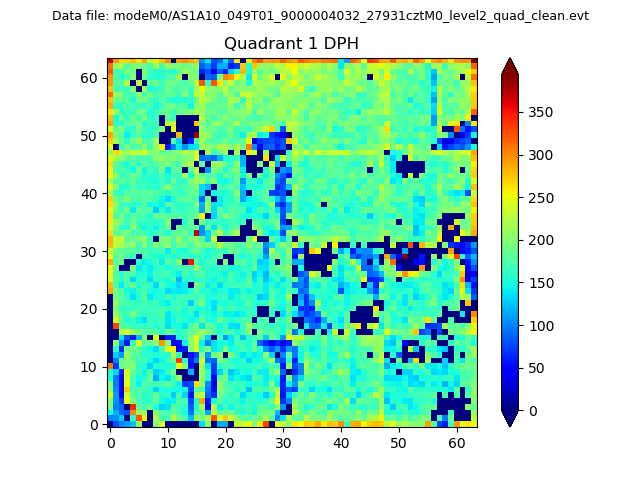 |
Quadrant B |
|---|---|---|---|
| Quadrant D | 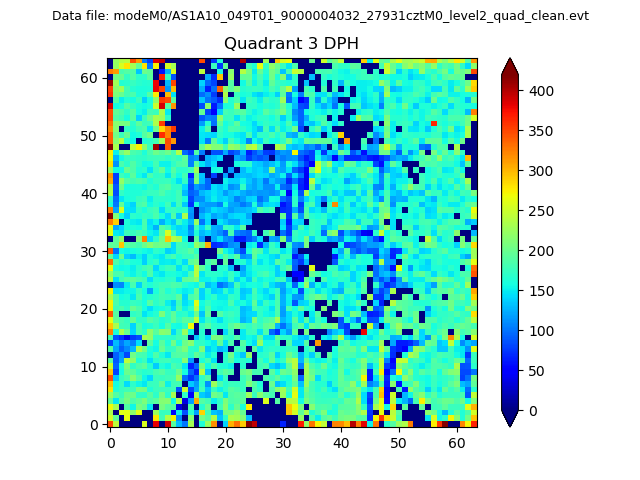 |
 |
Quadrant C |
| Plot type | Count rate plots | Images |
|---|---|---|
| Comparison with Poisson distribution Blue bars denote a histogram of data divided into 1 sec bins. Red curve is a Poisson curve with rate = median count rate of data. |
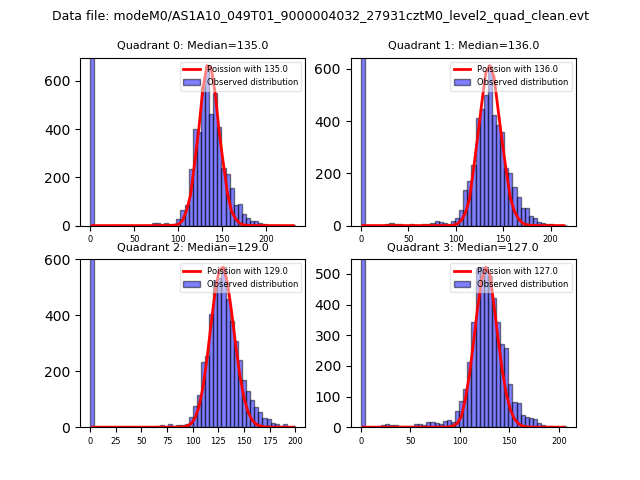 |
 |
| Quadrant-wise count rates Data is divided into 100 sec bins |
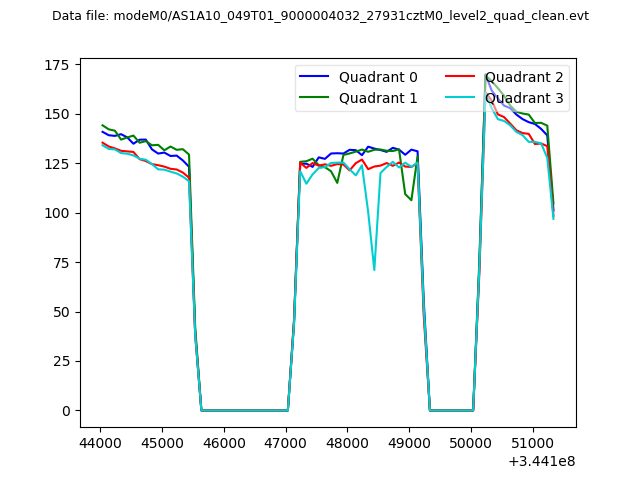 |
|
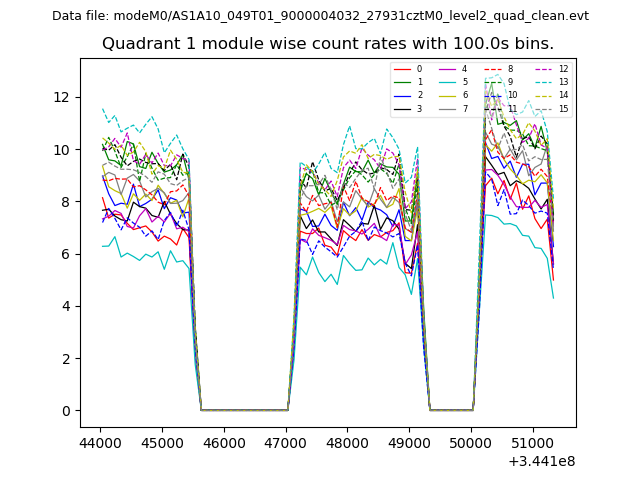
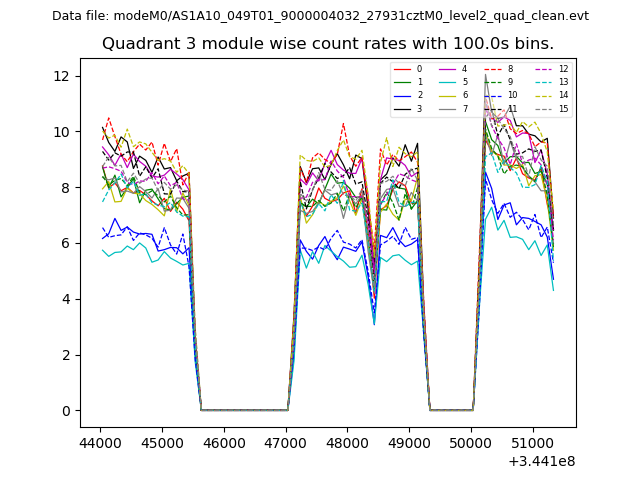
| Module-wise count rates for Quadrant A Data is divided into 100 sec bins |
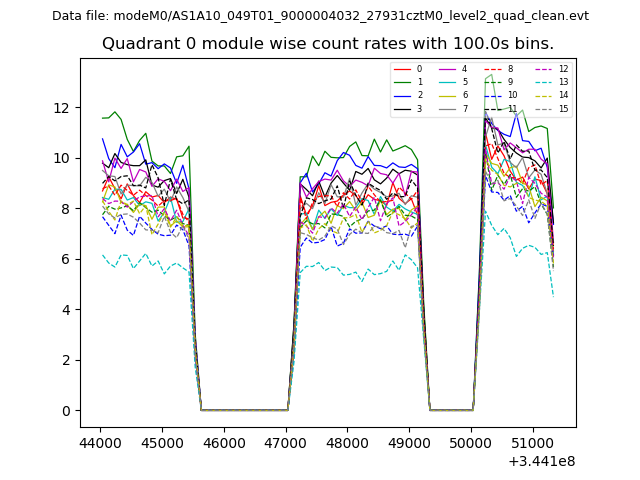 |
 |
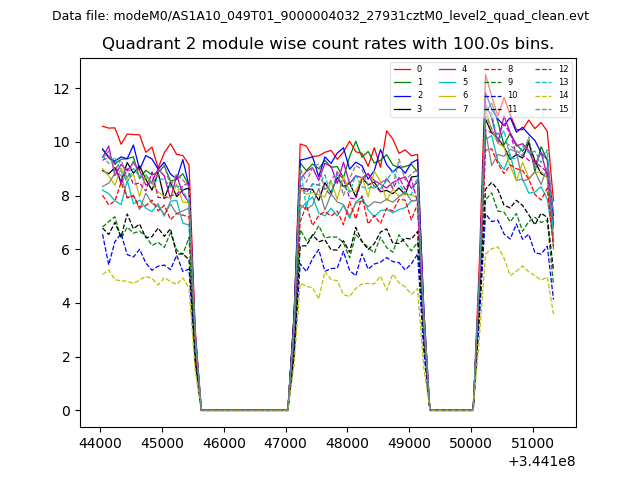
| Module-wise count rates for Quadrant B Data is divided into 100 sec bins |
 |
 |
| Module-wise count rates for Quadrant C Data is divided into 100 sec bins |
 |
 |
| Module-wise count rates for Quadrant D Data is divided into 100 sec bins |
 |
 |
| Parameter | Plot |
|---|---|
| CZT HV Monitor | 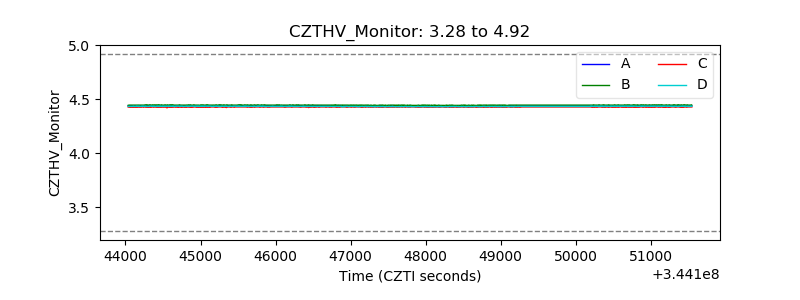 |
| D_VDD | 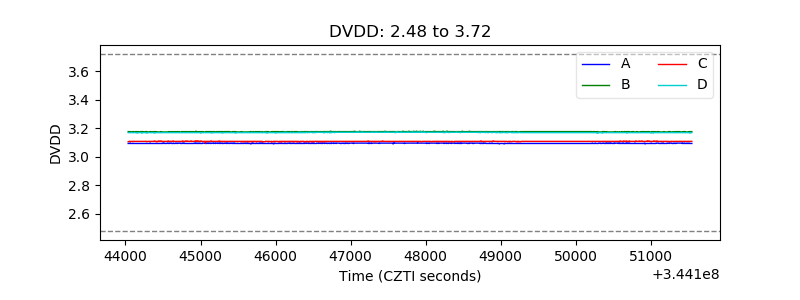 |
| Temperature 1 | 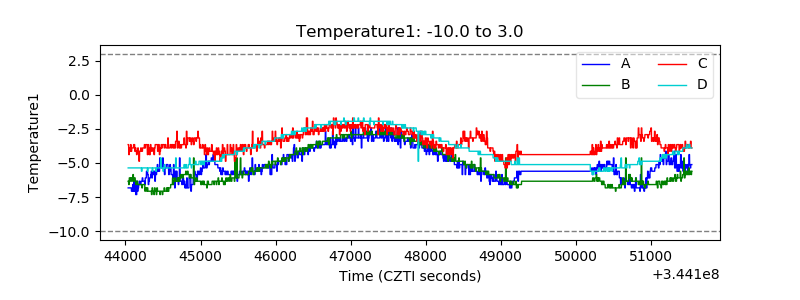 |
| Veto HV Monitor | 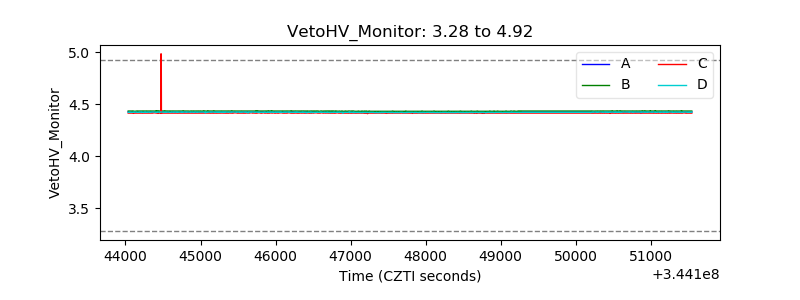 |
| Veto LLD | 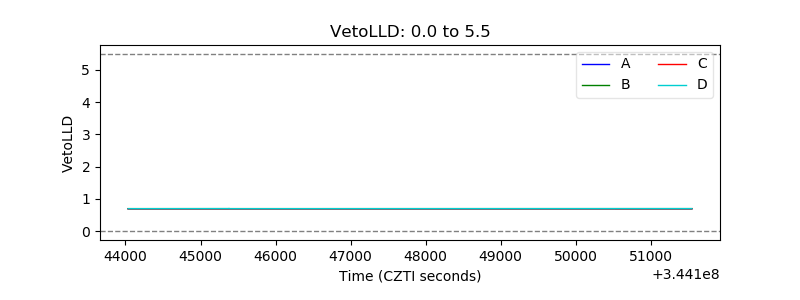 |
| Alpha Counter | 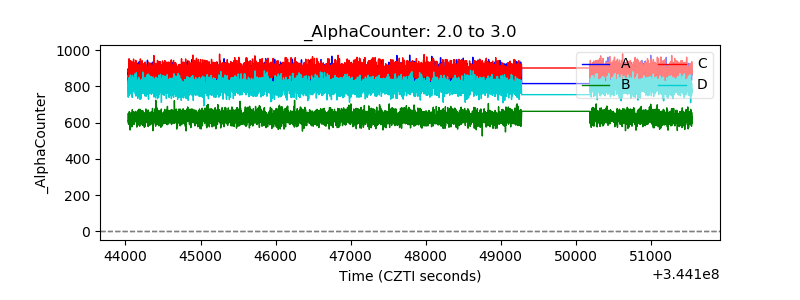 |
| _CPM_Rate | 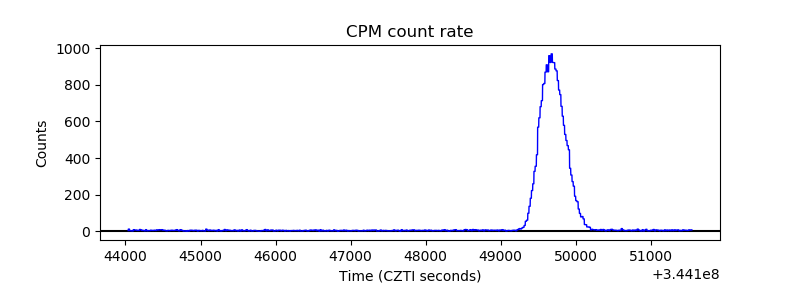 |
| CZT Counter | 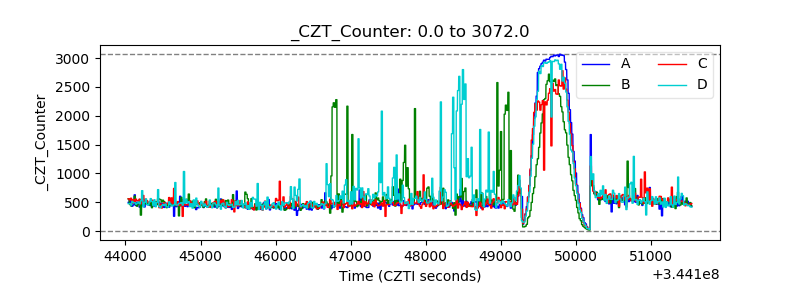 |
| +2.5 Volts monitor |  |
| +5 Volts monitor |  |
| _ROLL_ROT | 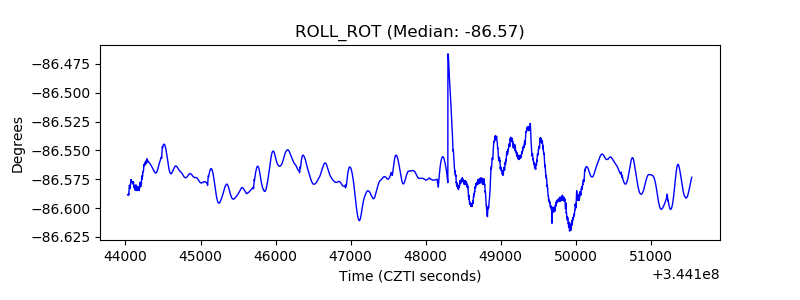 |
| _Roll_DEC | 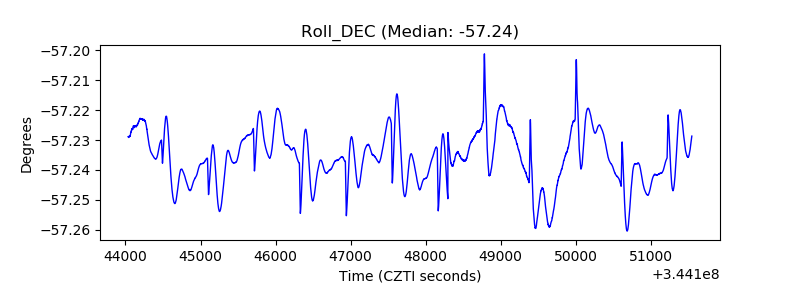 |
| _Roll_RA | 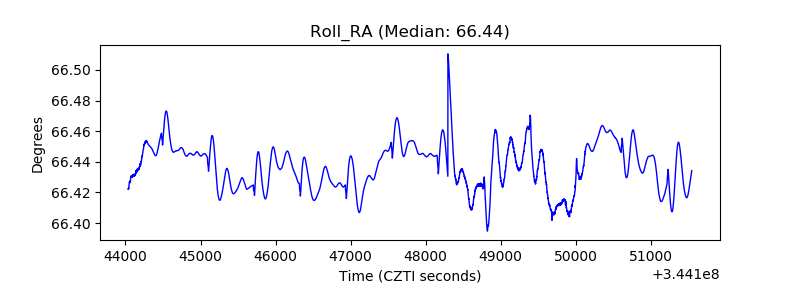 |
| Veto Counter | 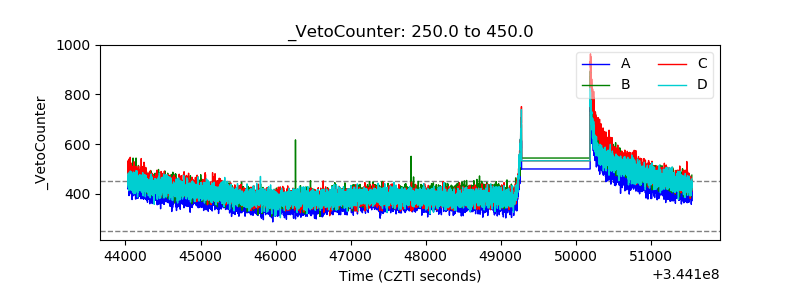 |