| Param | Original file | Final file |
|---|---|---|
| Filename | modeM0/AS1A10_049T01_9000004032_27932cztM0_level2.evt | modeM0/AS1A10_049T01_9000004032_27932cztM0_level2_quad_clean.evt |
| Size (bytes) | 486,990,720 | 86,572,800 |
| Size | 464.4 MB | 82.6 MB |
| Events in quadrant A | 2,985,476 | 567,785 |
| Events in quadrant B | 3,932,517 | 552,280 |
| Events in quadrant C | 3,725,942 | 538,715 |
| Events in quadrant D | 3,690,250 | 536,507 |
| Mode M9 | |||
|---|---|---|---|
| Quadrant | BADHDUFLAG | Total packets | Discarded packets |
| A | 0 | 11 | 0 |
| B | 0 | 11 | 0 |
| C | 0 | 11 | 0 |
| D | 0 | 11 | 0 |
| Mode M0 | |||
|---|---|---|---|
| Quadrant | BADHDUFLAG | Total packets | Discarded packets |
| A | 0 | 12791 | 0 |
| B | 0 | 15527 | 0 |
| C | 0 | 14916 | 0 |
| D | 0 | 14724 | 0 |
| Quadrant | Total seconds | Saturated seconds | Saturation percentage |
|---|---|---|---|
| A | 6103 | 53 | 0.868425% |
| B | 6104 | 378 | 6.192661% |
| C | 6104 | 200 | 3.276540% |
| D | 6104 | 93 | 1.523591% |
Noise dominated data is calculated using 1-second bins in cleaned event files. If a bin has >2000 counts, and if more than 50% of those come from <1% of pixels, then it is considered to be noise-dominated and hence unusable.
| Quadrant | # 1 sec bins | Bins with >0 counts | Bins with >2000 counts | High rate bins dominated by noise | Noise dominated (total time) | Noise dominated (detector-on time) | Marked lightcurve |
|---|---|---|---|---|---|---|---|
| A | 7158 | 6103 | 0 | 0 | 0.00% | 0.00% | 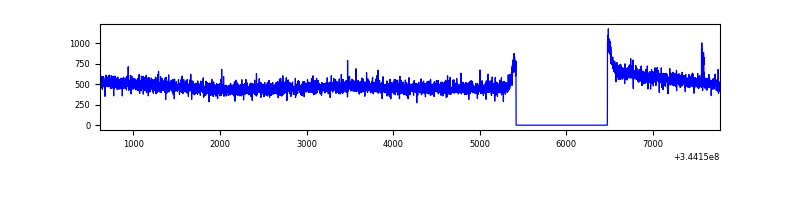 |
| B | 7159 | 6104 | 259 | 259 | 3.62% | 4.24% | 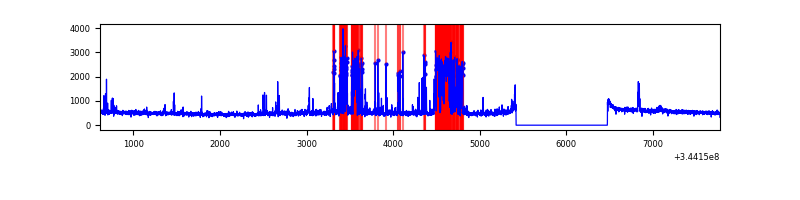 |
| C | 7159 | 6104 | 51 | 51 | 0.71% | 0.84% | 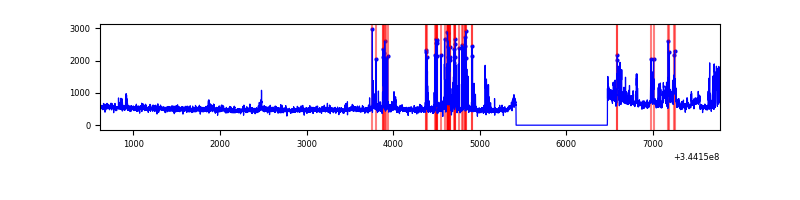 |
| D | 7159 | 6104 | 42 | 42 | 0.59% | 0.69% | 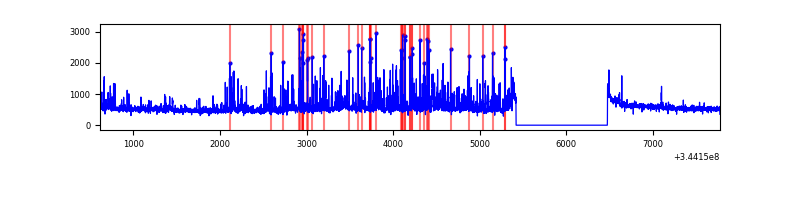 |
Top three noisy pixels from each quadrant. If the there are fewer than three noisy pixels in the level2.evt file, extra rows are filled as -1
| Pixel properties | Quadrant properties | ||||||
|---|---|---|---|---|---|---|---|
| Quadrant | DetID | PixID | Counts | Sigma | Mean | Median | Sigma |
| A | 13 | 254 | 10241 | 61.91 | 772 | 757 | 153.2 |
| A | 3 | 137 | 7075 | 41.24 | 772 | 757 | 153.2 |
| A | 0 | 226 | 6571 | 37.95 | 772 | 757 | 153.2 |
| B | 10 | 245 | 946738 | 6702.97 | 746 | 727 | 141.1 |
| B | 0 | 183 | 29971 | 207.21 | 746 | 727 | 141.1 |
| B | 12 | 111 | 16896 | 114.57 | 746 | 727 | 141.1 |
| C | 2 | 16 | 565643 | 3295.36 | 740 | 743 | 171.4 |
| C | 14 | 238 | 119981 | 695.58 | 740 | 743 | 171.4 |
| C | 3 | 233 | 115712 | 670.67 | 740 | 743 | 171.4 |
| D | 12 | 79 | 364726 | 2046.88 | 750 | 730 | 177.8 |
| D | 1 | 52 | 192314 | 1077.35 | 750 | 730 | 177.8 |
| D | 8 | 195 | 176499 | 988.41 | 750 | 730 | 177.8 |
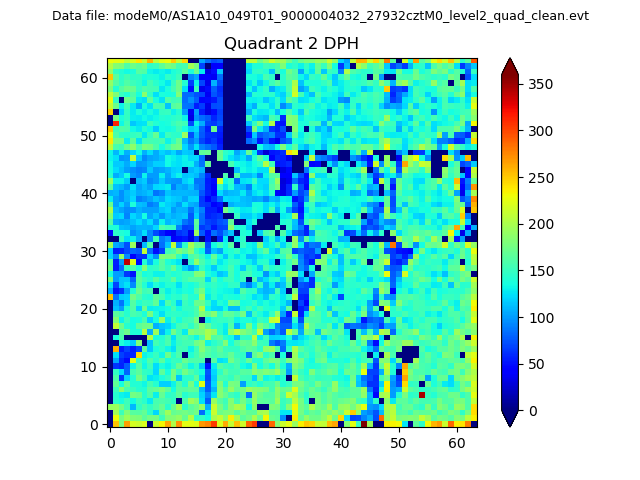
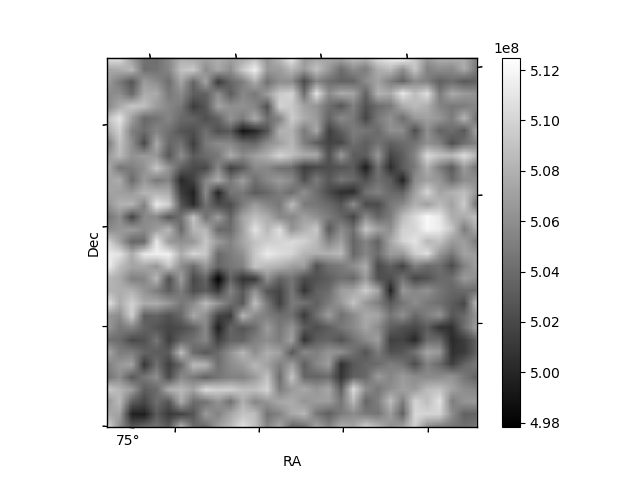
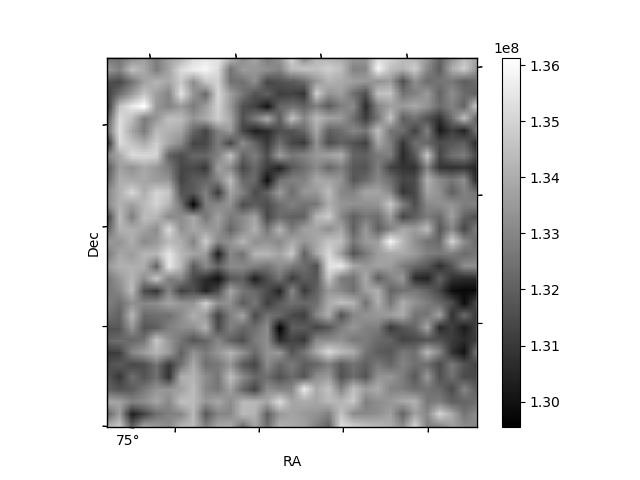
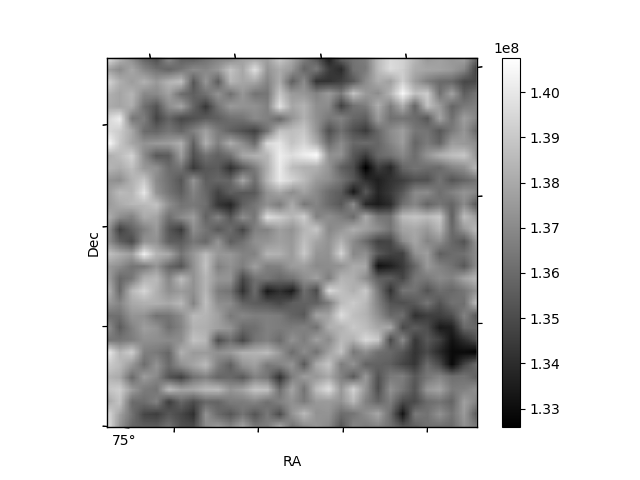
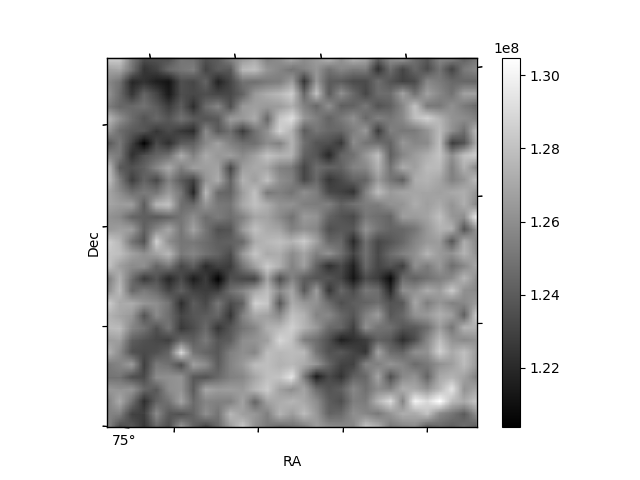
Histogram calculated using DETX and DETY for each event in the final _common_clean file
| Quadrant A | 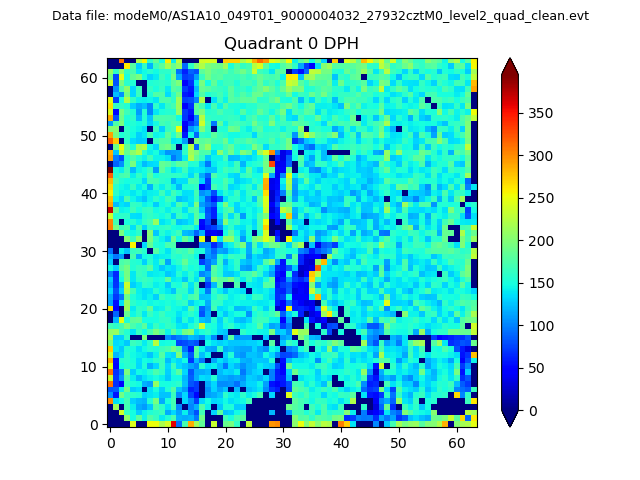 |
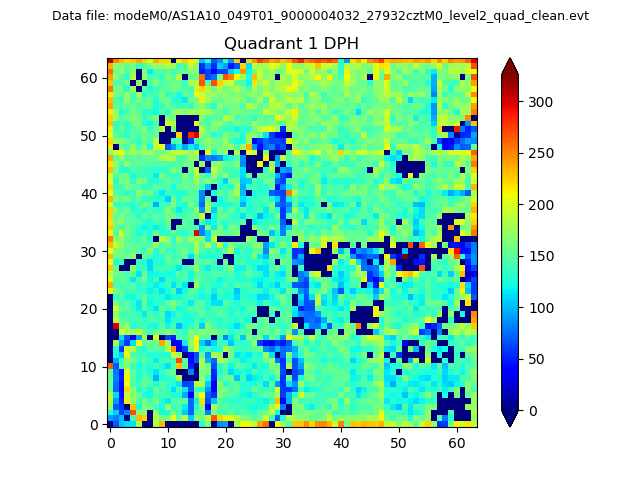 |
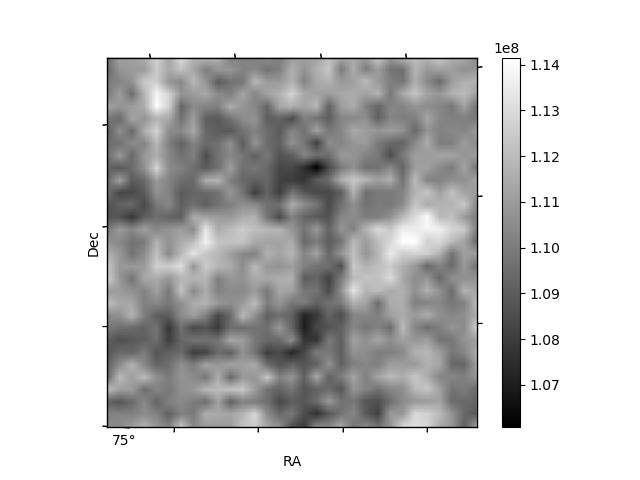
Quadrant B |
|---|---|---|---|
| Quadrant D | 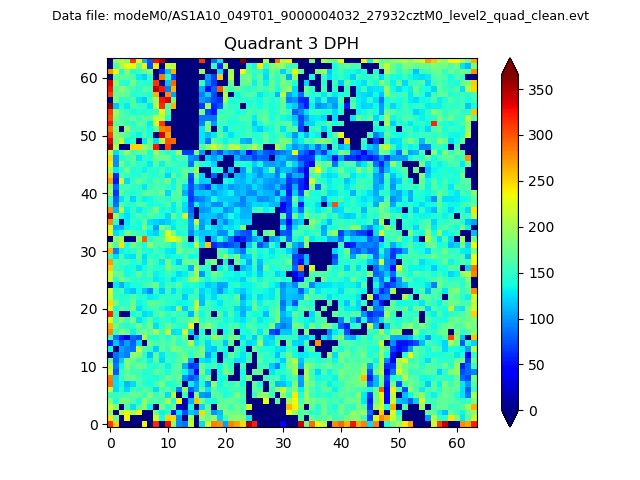 |
 |
Quadrant C |
| Plot type | Count rate plots | Images |
|---|---|---|
| Comparison with Poisson distribution Blue bars denote a histogram of data divided into 1 sec bins. Red curve is a Poisson curve with rate = median count rate of data. |
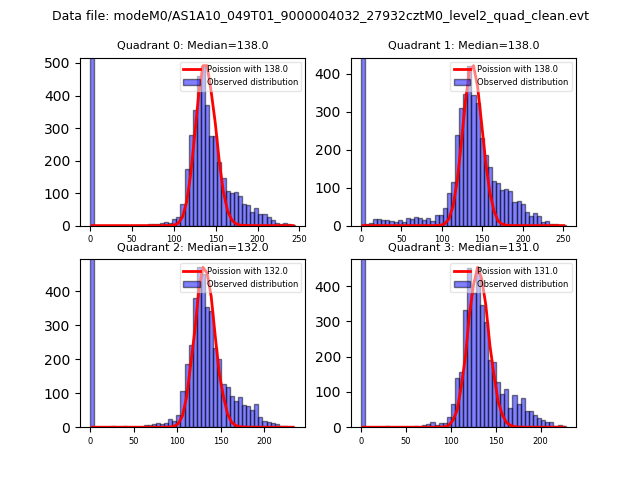 |
 |
| Quadrant-wise count rates Data is divided into 100 sec bins |
 |
|
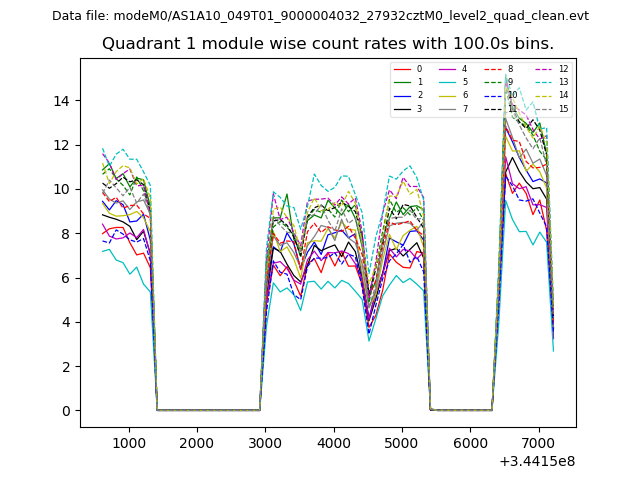
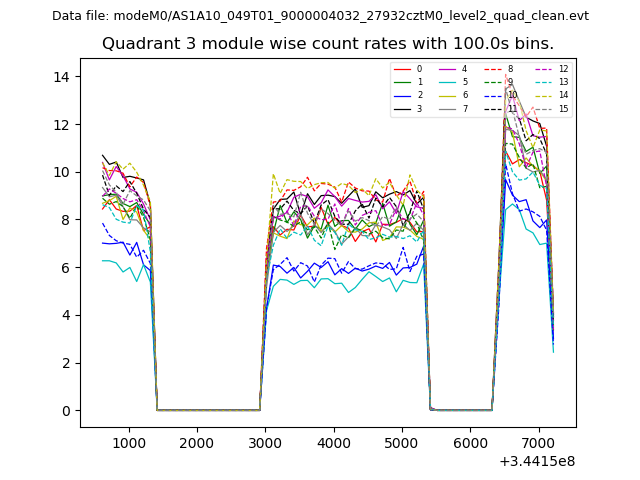
| Module-wise count rates for Quadrant A Data is divided into 100 sec bins |
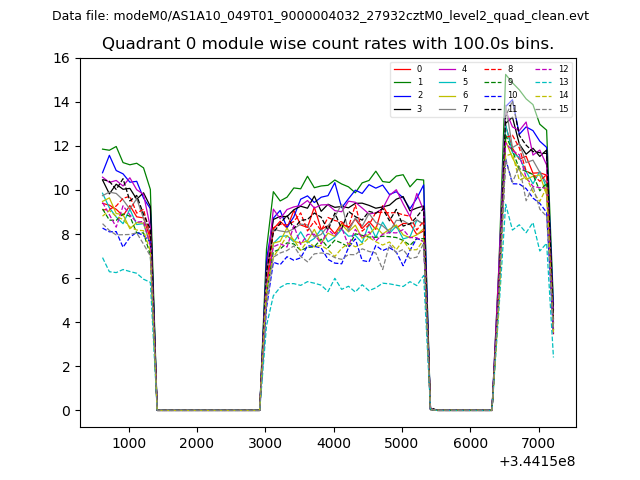 |
 |
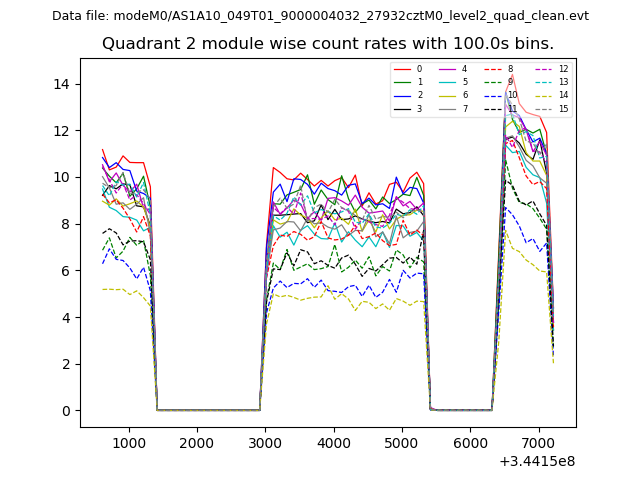
| Module-wise count rates for Quadrant B Data is divided into 100 sec bins |
 |
 |
| Module-wise count rates for Quadrant C Data is divided into 100 sec bins |
 |
 |
| Module-wise count rates for Quadrant D Data is divided into 100 sec bins |
 |
 |
| Parameter | Plot |
|---|---|
| CZT HV Monitor | 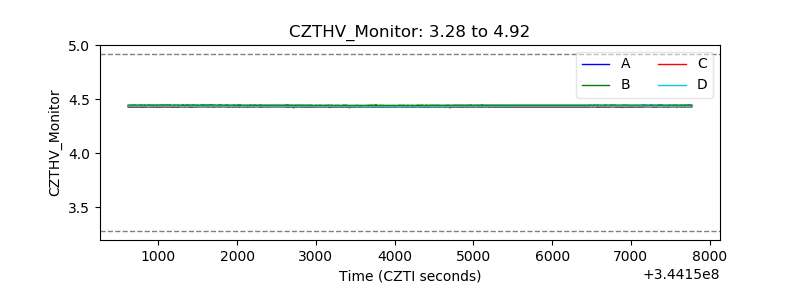 |
| D_VDD | 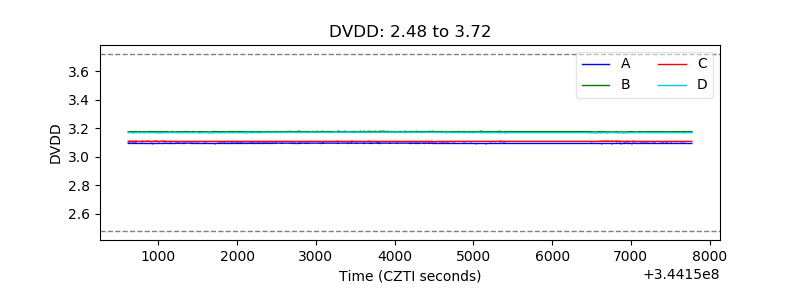 |
| Temperature 1 | 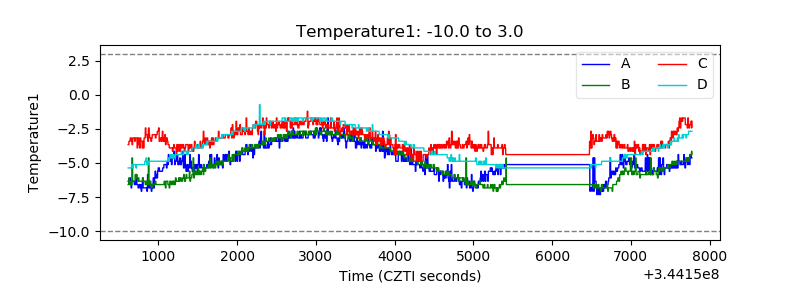 |
| Veto HV Monitor | 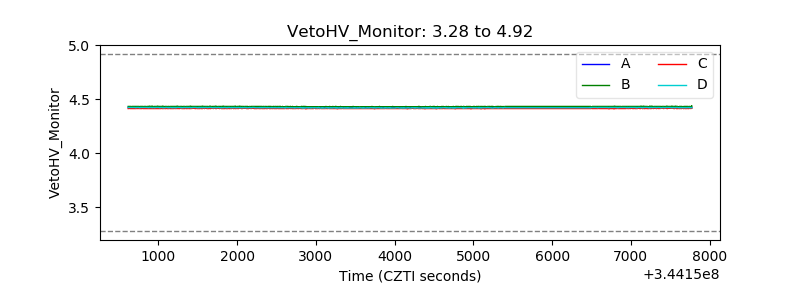 |
| Veto LLD | 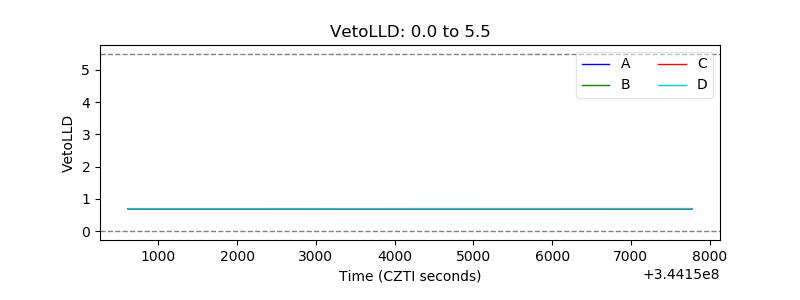 |
| Alpha Counter | 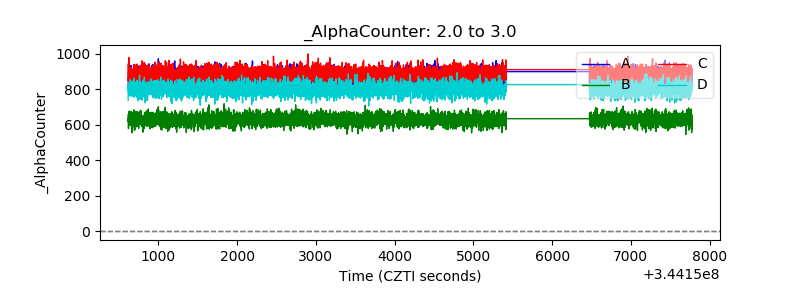 |
| _CPM_Rate | 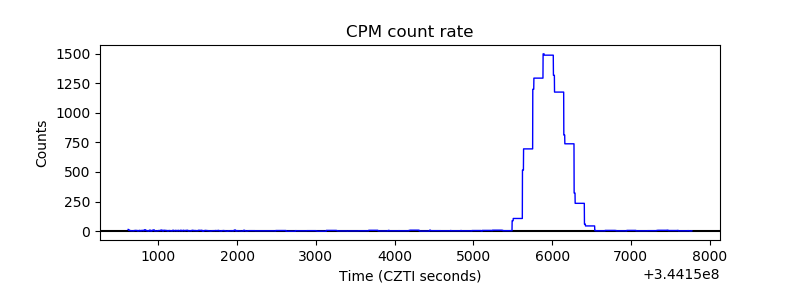 |
| CZT Counter | 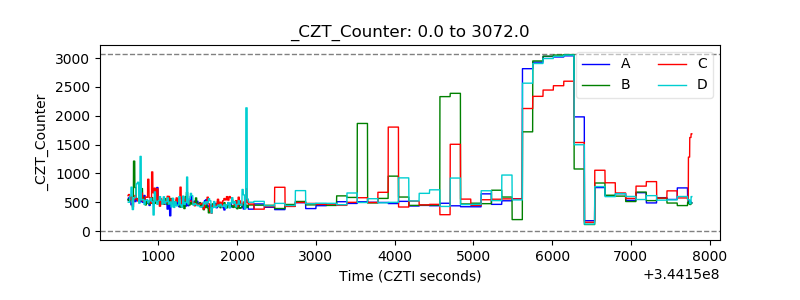 |
| +2.5 Volts monitor |  |
| +5 Volts monitor |  |
| _ROLL_ROT | 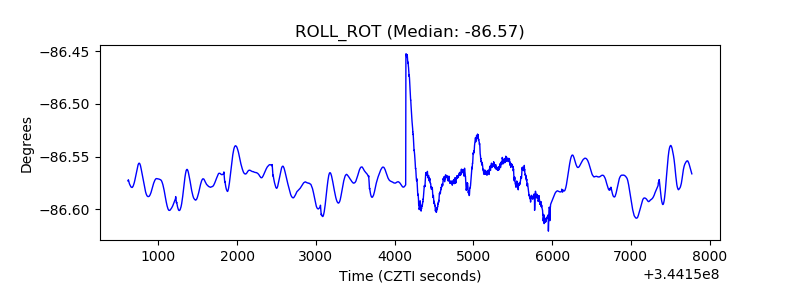 |
| _Roll_DEC | 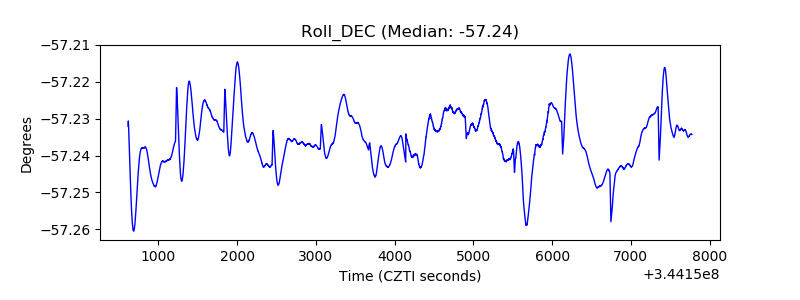 |
| _Roll_RA | 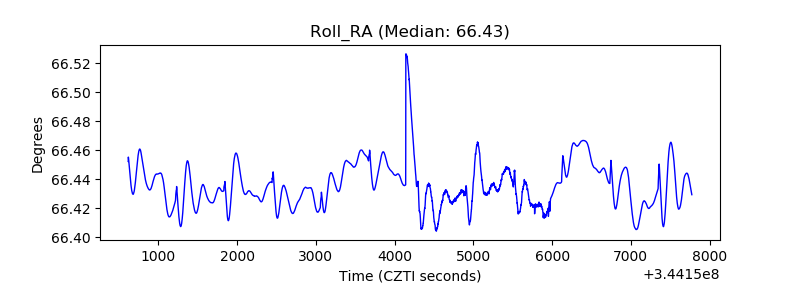 |
| Veto Counter | 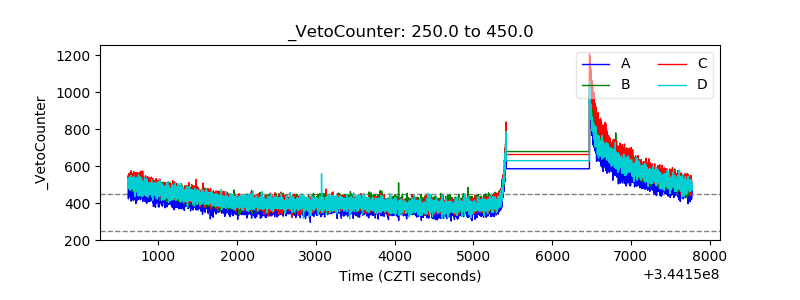 |